
Abstract
Bloc voting, whereby people vote for candidates of the same immigrant background as themselves, provides one possible avenue for immigrants to access political systems. A relevant but understudied element in the bloc voting process is the neighbourhood and, specifically, the effects of its demographic concentration. While we have observed how immigrant voters become socialised within the context of immigrant neighbourhoods, we do not yet understand how immigrant concentration at this level impacts immigrants’ political behaviour. Do such high levels relate more strongly to bloc voting than low levels? Using data from Amsterdam’s 2010 and 2014 local elections, this article compares voting patterns of the Dutch capital’s three largest immigrant groups: Turks, Moroccans and Surinamese. The study’s analyses determine whether changes within a neighbourhood relate to immigrant candidate votes. Our findings reveal that for some groups, the percentage of eligible co-immigrant voters in a neighbourhood shows a positive non-linear correlation with the percentage of votes for candidates of the same immigrant background. This illustrates that for these groups in these contexts a concentration effect is at play.
Introduction
In city halls across Europe, immigrants are severely underrepresented (Bloemraad, 2013). Even those whose groups have settled en masse over an extended period of time must overcome major hurdles to enter the precincts of urban power. This situation poses deep challenges to democratic practices and norms, and is exacerbated by the serious socioeconomic problems that many immigrant groups in Europe also face. Political participation can be a major means to improve a group’s position in society and address perceived group injustices. Immigrant political representation gives groups a voice in decisions affecting their constituencies and the opportunity to introduce new perspectives into deliberative decision-making processes (Bloemraad and Vermeulen, 2014). Higher levels of representation also lessen minority groups’ sense of marginalisation by sending a signal that the political system accepts or even welcomes diversity (Dancygier, 2017). Urban settings with high immigrant electorate levels seem to provide the most immediate and relevant opportunities for minorities to be politically represented and incorporated (Garbaye, 2005).
A significant means by which immigrants can increase their political representation is bloc voting, whereby immigrants and their descendants vote in relatively high numbers for candidates of the same ethnic background as themselves. The USA offers ample evidence that candidates’ racial or ethnic group identity matters to immigrant and minority voters, reflecting a preference for co-ethnic representatives (Barreto, 2007). European studies turn up similar patterns (Bergh and Björklund, 2011; Fisher et al., 2015; Michon and Vermeulen, 2013). Studies on bloc voting illustrate that people vote more frequently for candidates of the same ethnic background if the voters self-identify as members of a common ethnic and/or immigrant group and ethnicity is a salient political issue for them (Barreto, 2007).
Intensity of bloc voting and thereby the ability to elect candidates of the same background differs per group. An important element in explaining this difference is the organisational infrastructure of groups. High immigrant organisational density and strong inter-organisational networks correlate with an immigrant constituency that is more engaged politically, displays higher levels of political participation and more easily mobilises to support candidates from the same immigrant group (Fennema and Tillie, 1999; Vermeulen et al., 2014). In Western Europe, Turkish immigrants and their descendants exemplify institutionally complete communities, with the potential to exercise strong electoral power, especially at the local level. It is no coincidence that new pro-diversity immigrant political parties – including DENK in the Netherlands, Vlaams Multicultureel Collectief in Belgium, Allianz Deutscher Demokraten in Germany and Gemeinsam für Wien in Austria – all have their roots in Turkish communities that formed at the local level.
A crucial factor in this equation seems to be demographic concentration at the neighbourhood level. Immigrant life often hinges on the neighbourhood. It offers a whole spectrum of resources, including local ethnic businesses, religious institutions, community-based non-profit organisations, local educational institutions and informal social networks (Logan et al., 2002). Access to these resources, however, is uneven and often ethnically exclusive, leading to unequal integration outcomes for different groups (Zhou, 2009). For some, the immigrant neighbourhood provides relevant collective resources that can be applied towards political action, such as bloc voting; for others, such resources are unavailable, rendering the immigrant neighbourhood unhelpful in this capacity.
To better understand bloc voting, we must examine the local political socialisation process that goes on in environments where immigrants reside (Leighley, 2001). This requires more than locating the neighbourhoods where immigrant voters cluster. Concentrations of potential voters are just the beginning of the story (Gimpel and Cho, 2004: 988); we need to ask what happens in the neighbourhood that yields more or less bloc voting. To unpack these concentration effects, we can make use of electoral geographic studies (Johnston et al., 2000, 2004; Pattie and Johnston, 2016) that illustrate how voting is a learned activity, taking place in various contexts and through a range of mechanisms at several spatial scales (Cutts et al., 2014).
Studies on the spatial dimensions of immigrant bloc voting have focused primarily on American cities (Cho et al., 2006; Leighley, 2001; Sonenshein and Drayse, 2006). Studies on European cities and neighbourhoods are scarcer. However, bloc voting appears to be increasingly consequential for immigrant political mobilisation (Vermeulen et al., 2018) in European urban contexts. It is therefore relevant to study the mechanisms that underpin these dynamics in Europe as well. In addition, we do not understand exactly how and when neighbourhood resources and immigrant concentration at the neighbourhood level impact immigrants’ political behaviour or how significant the size of an ethnic concentration in this process is. Cho et al. (2006), for example, find a threshold effect on political participation of immigrants for the group size in a neighbourhood, emphasising that the ‘ethnic context’ is not static. In this vein, we are especially interested in the effects that an immigrant concentration’s size in the neighbourhood has on aggregate bloc voting in that neighbourhood and how any effects may differ across groups. We therefore ask if a high concentration of a particular immigrant group in a neighbourhood affects bloc voting in a way other than by more voters of an immigrant background leading to more potential voters for candidates of the same background. And if there is some sort of critical mass effect, does it apply universally or just to specific groups in specific contexts?
Working from the assumption that immigrant origin matters, this case study compares three groups whose communities have created social and civic networks in which place-specific processes can impact voting for candidates of the same immigrant background. Such patterns within these local milieus signal the possibility that specific groups’ collective strategies for political mobilisation at the neighbourhood level may indeed increase minority political representation. Amsterdam provides a robust case study because the Netherlands’ electoral system gives the option to cast preferential votes for individual candidates, which makes the already diverse capital city especially open to minority political participation. Studying the city’s three largest immigrant groups – Turks, Moroccans and Surinamese, each of which has distinct characteristics and relationships with neighbourhoods – allows us to compare and contrast how immigrant concentration at the neighbourhood level affects voting for candidates of the same immigrant background in these neighbourhoods. The terms ‘Turks’/‘Turkish’, ‘Moroccan’ and ‘Surinamese’ are used in this article to refer concisely to immigrants from Turkey, Morocco and Suriname as well as their Dutch-born descendants.
Beyond composition: Immigrant concentration effects on bloc voting
A basic premise of electoral geographers is that people with similar characteristics do not necessarily vote in similar ways if they live in different environments (Pattie and Johnston, 2016; Johnston et al., 2004). Voting decisions occur in a specific spatial context that has an effect on voting independent of other explanatory factors at the individual level. These spatial effects are due to social interaction patterns among neighbourhood residents and/or place-specific activities of political parties and other organisations in neighbourhoods (Johnston et al., 2004: 369; Sonenshein and Drayse, 2006). If the majority of a person’s social contacts favour one political position, party and/or candidate, that person is more likely to show such favouritism. Majority positions, in terms of political preferences, seem to have a more dominant effect on voting patterns in neighbourhoods than do individual voters’ characteristics (MacAllister et al., 2001: 42). Even in cases with very little social interaction among neighbours, people internalise and often emulate what they see (on billboards, at local events, etc.), suggesting that those who live together behave similarly politically (Gimpel and Cho, 2004). Called conversion by conversation (Johnston et al., 2004), this socialisation process breeds more political viewpoint homogeneity than would be otherwise present in a local environment.
The literature on bloc voting shows similar findings of social interactions among ethnic group members. Sonenshein and Drayse (2006) argue that bloc voting is strengthened by local social interaction and place-based identities in areas where immigrant groups reside. Martin (2016) states that social influence from one’s ethnic in-group can lead to support for a co-ethnic candidate. Groups with strong ethnic networks and high levels of ethnic or religious identification may display more co-ethnic mobilisation because of social pressure to vote for a co-ethnic candidate.
Besides these social mechanisms that influence voting behaviour in neighbourhoods with high levels of immigrant concentration, we may expect candidates and parties to behave in ways that influence voters in these areas to follow similar behaviour. People who live together respond together to party campaigns. Perhaps of even greater consequence, parties and candidates invest in larger concentrations of constituencies. Political parties actively seek votes, and some areas with higher voter concentration may prove more valuable than others. Voters are more likely to support parties and candidates in places where they campaign intensively (Johnston et al., 2004), leading to homogeneous political behaviour by certain parties, candidates and/or organisations.
The literature has offered similar observations on bloc voting and immigrant candidates. Leighley (2001) notes that if a minority group constitutes a significant portion of the electorate, this group is more likely to be targeted by parties and candidates, therefore leading to more participation and support for these actors. Cho et al. (2006) argue that large concentrations of a particular group are the beneficiaries of mobilisation efforts by parties and candidates, whereas small concentrations are far more likely to be ignored. When an immigrant group constitutes a substantial part of the electorate, its members may feel their votes matter, as well as receiving targeted appeals stating as much from candidates, thus reinforcing their sense of efficacy.
Both processes led to our expectation that an immigrant group’s size, both absolute and percentage, within a particular geographical context independently influences the degree of bloc voting. But more importantly, taking cues from the aforementioned literature, we also expected the extent of a neighbourhood’s immigrant concentration, beyond mere composition, to have effects. If present, social interaction and party mobilisation mechanisms should be significantly stronger in neighbourhoods with more inhabitants of immigrant background, particularly among large groups of a common background, than in neighbourhoods with smaller such concentrations. These concentration effects are not necessarily linear though most likely have threshold effects (Cho et al., 2006; Cutts et al., 2014). Concentration size must reach a certain level for the mechanisms to take effect, producing a critical mass effect. Vermeulen (2006) observes how immigrant organisations start to form only when a certain number of co-ethnics exist in a city. DeSante and Perry (2016) argue that the size of a co-ethnic population conditions both costs and desire to seek and acquire political knowledge. High rates of ethnic concentration thus facilitate access to resources and social groups; that, in turn, aids in the development of civic skills, knowledge and political interest. Low levels do not provide these resources. Bhatti and Hansen (2016) find effects of ethnic residential concentration on voter turnout once the concentration becomes a critical mass. Dancygier (2017) finds a similar effect on preferential voting in areas of high concentration of Muslims in Belgian municipalities.
Such mechanisms’ effects are expected to be stronger with high, rather than low, levels of immigrant concentration where there is a presence of organisational and informal social infrastructure, which helps sustain the mechanisms. We therefore expected the effect of an ethnic group’s relative size to be non-linear, positive, and larger on bloc voting in neighbourhoods where the group is already relatively large.
Hypothesis 1: In a neighbourhood, the effect of the relative size of an immigrant group on the degree of bloc voting is positive and non-linear; the effect of the relative size of an immigrant group on bloc voting is larger at higher relative sizes of the immigrant group.
Immigrant groups in Amsterdam and their political integration
This article examines two particular mechanisms in the neighbourhood context that work to encourage bloc voting. First, in some cases, voters feel that their immigrant community’s interests can be most effectively addressed by a candidate who knows their problems at first-hand, looks like them, and speaks the same language (Leighley, 2001). Their group’s perceived interests thus become a proxy for their own individual interests, with ethnicity providing a shortcut to electoral decision-making. In a second set of cases, strong in-group solidarity exists in an ethnic community and/or out-group hostility is directed at a different community (Fisher et al., 2015; Martin, 2016). Conscious that these mechanisms work differently for groups of different backgrounds, we now turn to exploring Amsterdam’s three largest immigrant communities.
In 2019, Turks represented about 5% of Amsterdam’s population and Moroccans about 9%. Both Turks and Moroccans arrived as (mainly male) guest workers in the late 1960s to take up low-skilled jobs in Amsterdam’s heavy industry. After the economic crisis of the early 1970s when most of the city’s factories closed, many became unemployed. A large percentage decided not to return, but rather to send for their families, as enabled through family reunification. The presence of Turks and Moroccans thus grew rapidly over the next decades, mostly in post-war neighbourhoods in the city’s west, where both groups lived together in mixed neighbourhoods. Both groups are predominantly Muslim, making them a religious minority in a highly secular city and in a country where Islam is increasingly cast in a negative light (Vermeulen et al., 2014).
As of 2019, 9% of Amsterdam’s population was of Surinamese background. Immigration from Suriname to the Netherlands has a long history, intimately tied to the countries’ colonial relationship. Suriname’s population comprises several distinct ethnic groups, the largest being Afro-Surinamese or ‘Creoles’ (descendants of African slaves) and the Indo-Surinamese or ‘Hindustanis’ (descendants of contract labourers brought mainly from India to Suriname after the Dutch colonies abolished slavery in 1863). After the war, Surinamese migration became more ethnically diverse and economically driven. The prospect of Suriname becoming independent, which occurred in 1975, caused increased economic and political uncertainty, resulting in more emigrants. An exodus of over 50,000 people occurred between 1974 and 1975. Many moved to Amsterdam, with over 10,000 settling in the Dutch capital in 1975 (Vermeulen, 2006). Often, they lived in newly built suburban districts in the city’s south-east, which to this day remains home to the most densely populated Surinamese neighbourhoods.
Of the groups we analysed, ample evidence shows that Turks constitute the tightest-knit ethnic community in Amsterdam, followed by Moroccans. The Turkish community is characterised by strong ideological polarisation between religious and secular groups, different ethnic subgroups, and various religious denominations. A representative national study (Huijnk and Andriessen, 2016) recently found that 80% of first- and second-generation Turks in the Netherlands identify strongly or very strongly with their ethnic community and that almost 30% identify only somewhat or not at all as Dutch; for Moroccans, that latter figure is 15%. Among Surinamese in the Netherlands, 75% strongly identify as Dutch. Turks have also formed the most immigrant organisations in Amsterdam and are densely connected through inter-organisational networks (Michon and Vermeulen, 2013; Vermeulen, 2006). They are significantly more often members of an immigrant organisation than Moroccans or Surinamese (Vermeulen et al., 2014).
Amsterdam is a hospitable city for minority groups’ political engagement and representation. Elections occur through a party list system, with pure proportionality and very low thresholds. Parties submit lists of candidates, and seats are allocated to each party in proportion to numbers of votes. A threshold exists to ensure that a party receives a minimum percentage of votes before obtaining seats. Low thresholds in the 2014 Amsterdam elections, for example, meant only 7061 votes (2.22% of valid votes) were needed for a party to win a seat in the local council. Another feature favourable for minority groups is the option to cast preferential votes, which means that on election day, voters not only choose a party, but also a specific candidate from the party. Each party predetermines the candidate list order, though voters can select a candidate ranked anywhere on the list; if there are enough votes, a lower listee wins a seat even if it means displacing a higher listee. Direct election through preferential voting required about 1800 votes in 2014 (0.6% of valid votes). Since 1985, moreover, the Netherlands began allowing non-citizens to participate in local elections after five years of legal residence in the country. It is not even necessary to self-register; the municipal administration automatically mails voter registration cards to all entitled inhabitants (Michon and Vermeulen, 2013; Vermeulen et al., 2014).
Given this political context, Amsterdam’s three largest immigrant groups display greatly varying patterns and stages of political engagement and incorporation. Supported by their well-organised community, Turks participate most in Amsterdam’s political system. They have relatively high turnout rates during local elections compared with other immigrant groups and are statistically overrepresented in the city council. Moroccans do not mobilise as strongly as Turks, neither organisationally nor politically, though have attained executive positions in the local political system more often than other immigrant groups. Surinamese, who show a fragmented community with an active elite, are well represented in Amsterdam’s political arena, although their turnout rate is one of the city’s lowest; in every local election since the 1990s, the rate was no higher than 25% (Vermeulen et al., 2014).
Community mobilisation processes transpire through social connectedness and community networks – formal and informal, secular and religious (Fieldhouse and Cutts, 2008). We therefore expected immigrant groups with a well-developed sense of community to experience stronger effects of immigrant concentration on political mobilisation. In Amsterdam, Turks are an example par excellence.
Hypothesis 2: In a neighbourhood, the effect of the relative size of an immigrant group on the degree of bloc voting is larger among Turks than among Moroccans or Surinamese.
Data and operationalisation
This study used official election results containing the number of votes for every candidate in every polling station for Amsterdam’s municipal elections in 2010 and 2014. According to their addresses, we classified the approximately 500 polling stations as belonging to one of 96 neighbourhoods. 1 We applied the city’s definition of what constitutes a neighbourhood (known in the Amsterdam context as a wijk) since extensive data are available at that geographical level. The neighbourhoods differ vastly in terms of surface area and number of residents. The maximum number of residents in a single neighbourhood was 26,548; the minimum was 2120. The average number of residents per neighbourhood was 10,296.
Because people can vote anywhere within their municipality, it is not a given that polling stations reflect neighbourhood preferences. But using similar types of data, Van Gent et al. (2014) find that the majority of votes do reflect neighbourhood preference. Our own analysis of voter numbers and turnout in each neighbourhood between 2002 and 2006 (thus both before and after the option to vote anywhere in the city) suggests that a vast majority of voters chose a polling station in the neighbourhood where they live. 2 For the present study, we classified candidates according to background: Turkish, Moroccan, Surinamese, other. We then divided the sum of votes per background and neighbourhood by the total number of votes in the neighbourhood. This resulted in voting percentage for Turkish, Moroccan and Surinamese candidates per neighbourhood and election year. The dependent variable was the vote share per neighbourhood for Turkish, Moroccan and Surinamese candidates.
We expected several neighbourhood characteristics to correlate with the relative number of votes for Turkish, Moroccan and Surinamese candidates at the neighbourhood level. Information on these characteristics was drawn from Amsterdam’s Department of Research, Information, and Statistics (OIS). The main independent variable was percentage of eligible Turkish, Moroccan and Surinamese voters at the neighbourhood level, which indicates concentration size of the immigrant group at the neighbourhood level. Conducting the analyses for percentage of inhabitants, including those ineligible to vote, we found similar results. We included a quadratic term for percentage of eligible voters to account for a possible non-linear correlation with bloc voting, exploring whether this percentage was more than a mere compositional effect. Neighbourhoods with relatively fewer immigrants could result in these groups being less well organised, having less social interaction, and being less appealing to political parties.
We included several control variables related to age to ensure that the observed correlation was not due to a composition effect. We controlled for the mean age of inhabitants 18 or older (18+) per immigrant group and according to neighbourhoods and years. The percentage of eligible immigrant-origin voters, however, might not have fully accounted for voting patterns; aspects of the correlation could be explained by the group’s age. If younger people were more likely to participate in bloc voting, we had to determine that it was not the relative size of the group per se, but rather composition according to age that explained patterns of bloc voting across neighbourhoods. We therefore tested an interaction between percentage of eligible voters and mean age per immigrant group, including in our calculations only 18+ individuals, to see how the two mechanisms might correlate differently with bloc voting for younger and older groups.
Miller (1978: 265) notes a possible reaction among voters of a particular group when the presence of other out-groups in the neighbourhood increases. The reactive environmental effect model suggests that ‘people may be irritated, alarmed and antagonized by contact with those unlike themselves’, and become even stronger supporters of their party or candidate (MacAllister et al., 2001). This led to our expectation that bloc voting increases when the size of other immigrant groups increases. We tested this by looking at the percentage of other non-Western groups in the neighbourhood. 3
Leisure organisations, sports, cultural performances and hobbies are social anchors in their neighbourhoods (Vermeulen et al., 2016). Widely recognised as the most heterogeneous type of voluntary organisations, they encompass members from various socioeconomic and sociocultural backgrounds. Previous studies have shown how these leisure organisations also cater to immigrant populations albeit to a lesser degree than among groups with no immigration background (Dekker and De Hart, 2009; Vermeulen et al., 2016). A high number of leisure organisations could indicate strong civic networks in the neighbourhood. These networks may enhance the coming together of politically engaged people and thus stimulate political debate. This could also increase bloc voting, as something partly explained by social interaction. The density of leisure organisations per 1000 inhabitants per neighbourhood was added to our analyses. Amsterdam’s leisure organisational density is available for 2007 and 2012 (Vermeulen et al., 2016); the 2007 density was fed into our data for the 2010 elections, and the 2012 density for the 2014 elections. We then added percentages of the first generation as a percentage of the total immigrant group, according to neighbourhood. We also included average settlement period per neighbourhood in years according to elections years and neighbourhoods.
Traditionally, the party favoured by immigrant voters in Amsterdam was the social democratic Partij van de Arbeid (PvdA) (Vermeulen et al., 2014). However, the most recent elections saw a sharp decline in the party’s popularity among immigrant voters in Amsterdam. Gaining from the PvdA’s losses was the Multicultureel Plus Partij (M+), which formed some months before the 2014 elections and mainly comprised candidates of Turkish background (Kranendonk et al., 2014). We thus added the percentage of PvdA votes according to neighbourhoods and election years in the analyses. Finally, we added voter turnout per election year and neighbourhood as a control variable.
Methods
Our analysis was two-pronged. First, we explored the cross-sectional variance between votes and neighbourhoods. We used linear regression analyses with clustered errors at the neighbourhood level to account for the nested nature of the data – namely, elections within neighbourhoods. Dummies for election years were included to account for variance between election years and bloc votes. This is something we expected to appear with 2014’s emergence of M+ as an immigrant party comprising candidates predominantly of Turkish background. In this analysis we also included a quadratic term of percentage of eligible Turkish, Moroccan and Surinamese voters to explore a non-linear correlation with bloc voting. Additionally, we included an interaction with the immigrant groups’ mean age among the 18+. We conducted neighbourhood-level analyses with the relative size of the immigrant group including ineligible voters, and the results proved similar to those including only the relative size of the group of eligible voters.
Second, we conducted analyses including fixed effects for both election years and neighbourhoods. This is a very strong test, permitting control for omitted variable bias at the neighbourhood level (neighbourhood dummies) and as a general trend (year dummies). All stable differences between neighbourhoods and the general trend between 2010 and 2014 in voting percentages are absorbed by the neighbourhood and year fixed effects. We used this test to explore whether changes within a neighbourhood relate to bloc voting in the neighbourhood. By only using variation within the same neighbourhood, we avoided comparing neighbourhoods that might be dissimilar for reasons other than relative size of groups of eligible immigrant voters. We do not individually discuss the fixed effects – thus the separate neighbourhood effects – because we are not interested in how one specific neighbourhood differs in percentage of bloc votes compared with another. We are interested in either the general neighbourhood mechanism or the variance within the neighbourhood that is left when we consider stable neighbourhood differences. Considering the within-neighbourhood changes further adds to the internal validity of our study. Zooming in on the variance, rather than relying only on cross-sectional analyses, lets us more confidently measure the correlation between percentages of immigrant inhabitants and votes for candidates of these backgrounds. Models that include fixed effects and observe changes over time are less vulnerable to unobserved heterogeneity than those of a cross-sectional design.
The neighbourhoods vary in terms of relative numbers of eligible Moroccan, Turkish and Surinamese voters between the election years. The variation may be due to a new generation coming of voting age and/or more people moving into or out of a neighbourhood. Relative size can also be affected by the behaviour of other groups, such as moving into or out of a neighbourhood, and housing availability. For example, large-scale residential developments, which attract a lot of new inhabitants, can affect groups’ relative sizes. Comparing 2010 with 2014, neighbourhoods had, respectively, 3.5% fewer Turkish inhabitants and 3.1% more Turkish inhabitants (0.87 standard deviation); 3.3% fewer Moroccan inhabitants and 2.7% more Moroccan inhabitants (1.06 standard deviation); and 4.6% fewer Surinamese inhabitants and 1.4% more Surinamese inhabitants (0.87 standard deviation). Comparing the two years, on average in 2014, Moroccan candidates received 3% fewer votes (2.2 standard deviation at the neighbourhood level); Turkish candidates 1.2% more votes in 2014 (2.5 standard deviation); and Surinamese candidates roughly the same in both elections (1.4 standard deviation).
We acknowledge that these research strategies run the risk of ecological fallacies (Robinson, 1950). While the aggregate data may show patterns consistent with hypothesised concentration effects, it cannot explicitly verify the underpinning reason at the individual level. For this, we would need data integrating individual and neighbourhood levels (Johnston et al., 2004). We aimed to minimise this problem, first, by controlling for different neighbourhood demographics and analysed changes within neighbourhoods. This endeavoured to rule out as many confounding factors as possible. Second, we evaluated the basic association at the individual level. To the extent that the association remained similar across levels, it became more plausible that the aggregate-level results reflected individual-level mechanisms.
Individual-level voter data came from exit polls conducted by OIS and the Institute for Migration and Ethnic Studies (IMES) (Kranendonk et al., 2014; Van der Heijden and Van Heelsum, 2010). The samples comprised eight polling stations in 2010 and eight in 2014, selected from neighbourhoods where the population of inhabitants of immigrant background was relatively high (above 50%). After having voted, people were asked to complete a questionnaire about party and candidate choices and personal demographics. There was no information about the neighbourhoods in which the respondents reside.
Exit polls (which are not elaborated on in our results) showed that bloc voting for these two Amsterdam elections was mostly prevalent among Turks, with 42% of respondents having voted for a Turkish candidate; that figure is around 21% for Moroccans and around 15% for Surinamese. 4 The finding illustrates that Turks are more likely than Moroccans and Surinamese to vote for a candidate of the same immigrant background (controlling for age, education, gender and generation). This is consistent with our aggregated data results, as illustrated in the next section. However, because we cannot integrate individual and aggregate data sets, we remain cautious about drawing conclusions concerning some of our anticipated mechanisms at the individual level using aggregate-level data.
Results
We begin assessing our results by examining scatterplots and a model estimating correlations between the percentage of eligible immigrant voters in a neighbourhood and that of votes for Turkish, Moroccan and Surinamese candidates.
Figure 1 shows the distribution of neighbourhood votes for Turkish, Moroccan and Surinamese candidates, according to percentage of eligible immigrant voters. The range of eligible Turkish voters is 0–21% between neighbourhoods; for Moroccans, 0–28%; and for Surinamese, 0–40%. 5 A difference between groups lies in the voters’ residential patterns. Eligible Surinamese voters live in neighbourhoods where they are either a relatively small group (less than 15% of the population) or a relatively large group (over 26%). The distribution of eligible Turkish and Moroccan voters across neighbourhoods is more even and does not exceed 30%. For all groups, we see that neighbourhoods with more Turks, Moroccans and Surinamese score higher percentages of votes for those candidates. However, the distribution of neighbourhoods according to eligible voters and bloc votes shows most variance amongst Moroccans. For example, some neighbourhoods with a small percentage of eligible Moroccan voters or none at all still score 5% or more of votes for Moroccan candidates. This shows that Moroccan candidates get preferential votes from voters of other backgrounds. PvdA politician Ahmed Marcouch is a case in point (Van der Heijden and Van Heelsum, 2010); he served as an Amsterdam district mayor, a municipal councillor, an MP and was recently appointed mayor of the sizable Dutch city of Arnhem. Neighbourhoods with a close-to-zero percentage of eligible Turkish and Surinamese voters also report close-to-zero percentage votes for Turkish and Surinamese candidates.
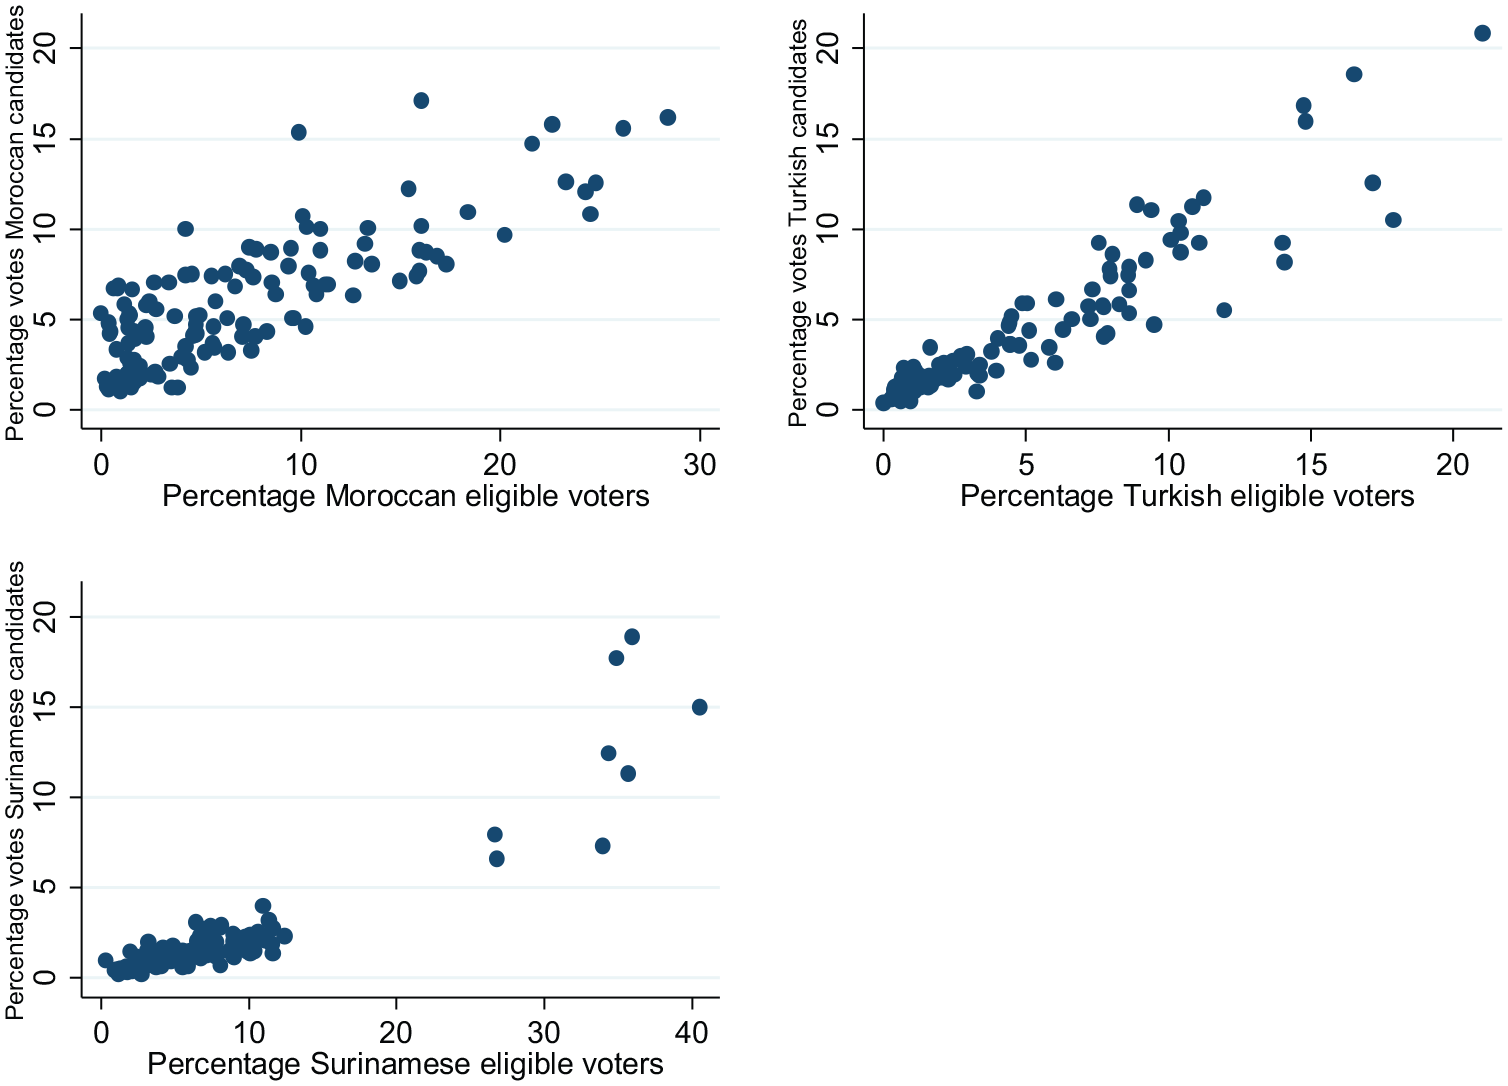
Percentage of votes for immigrant candidates according to percentage of eligible immigrant voters per neighbourhood.
Table 1 shows how a percentage of eligible voters from a specific immigrant group in a neighbourhood relates to immigrant votes for candidates of the same background in the neighbourhood. These effects are all positive, though some differences appear between groups. The coefficient for percentage of eligible Turkish voters is somewhat (though not significantly) larger than in models without control variables (not illustrated). The coefficients for percentages of eligible Moroccan and Surinamese voters are the same.
Factors that relate to voting for candidate with similar immigrant background.
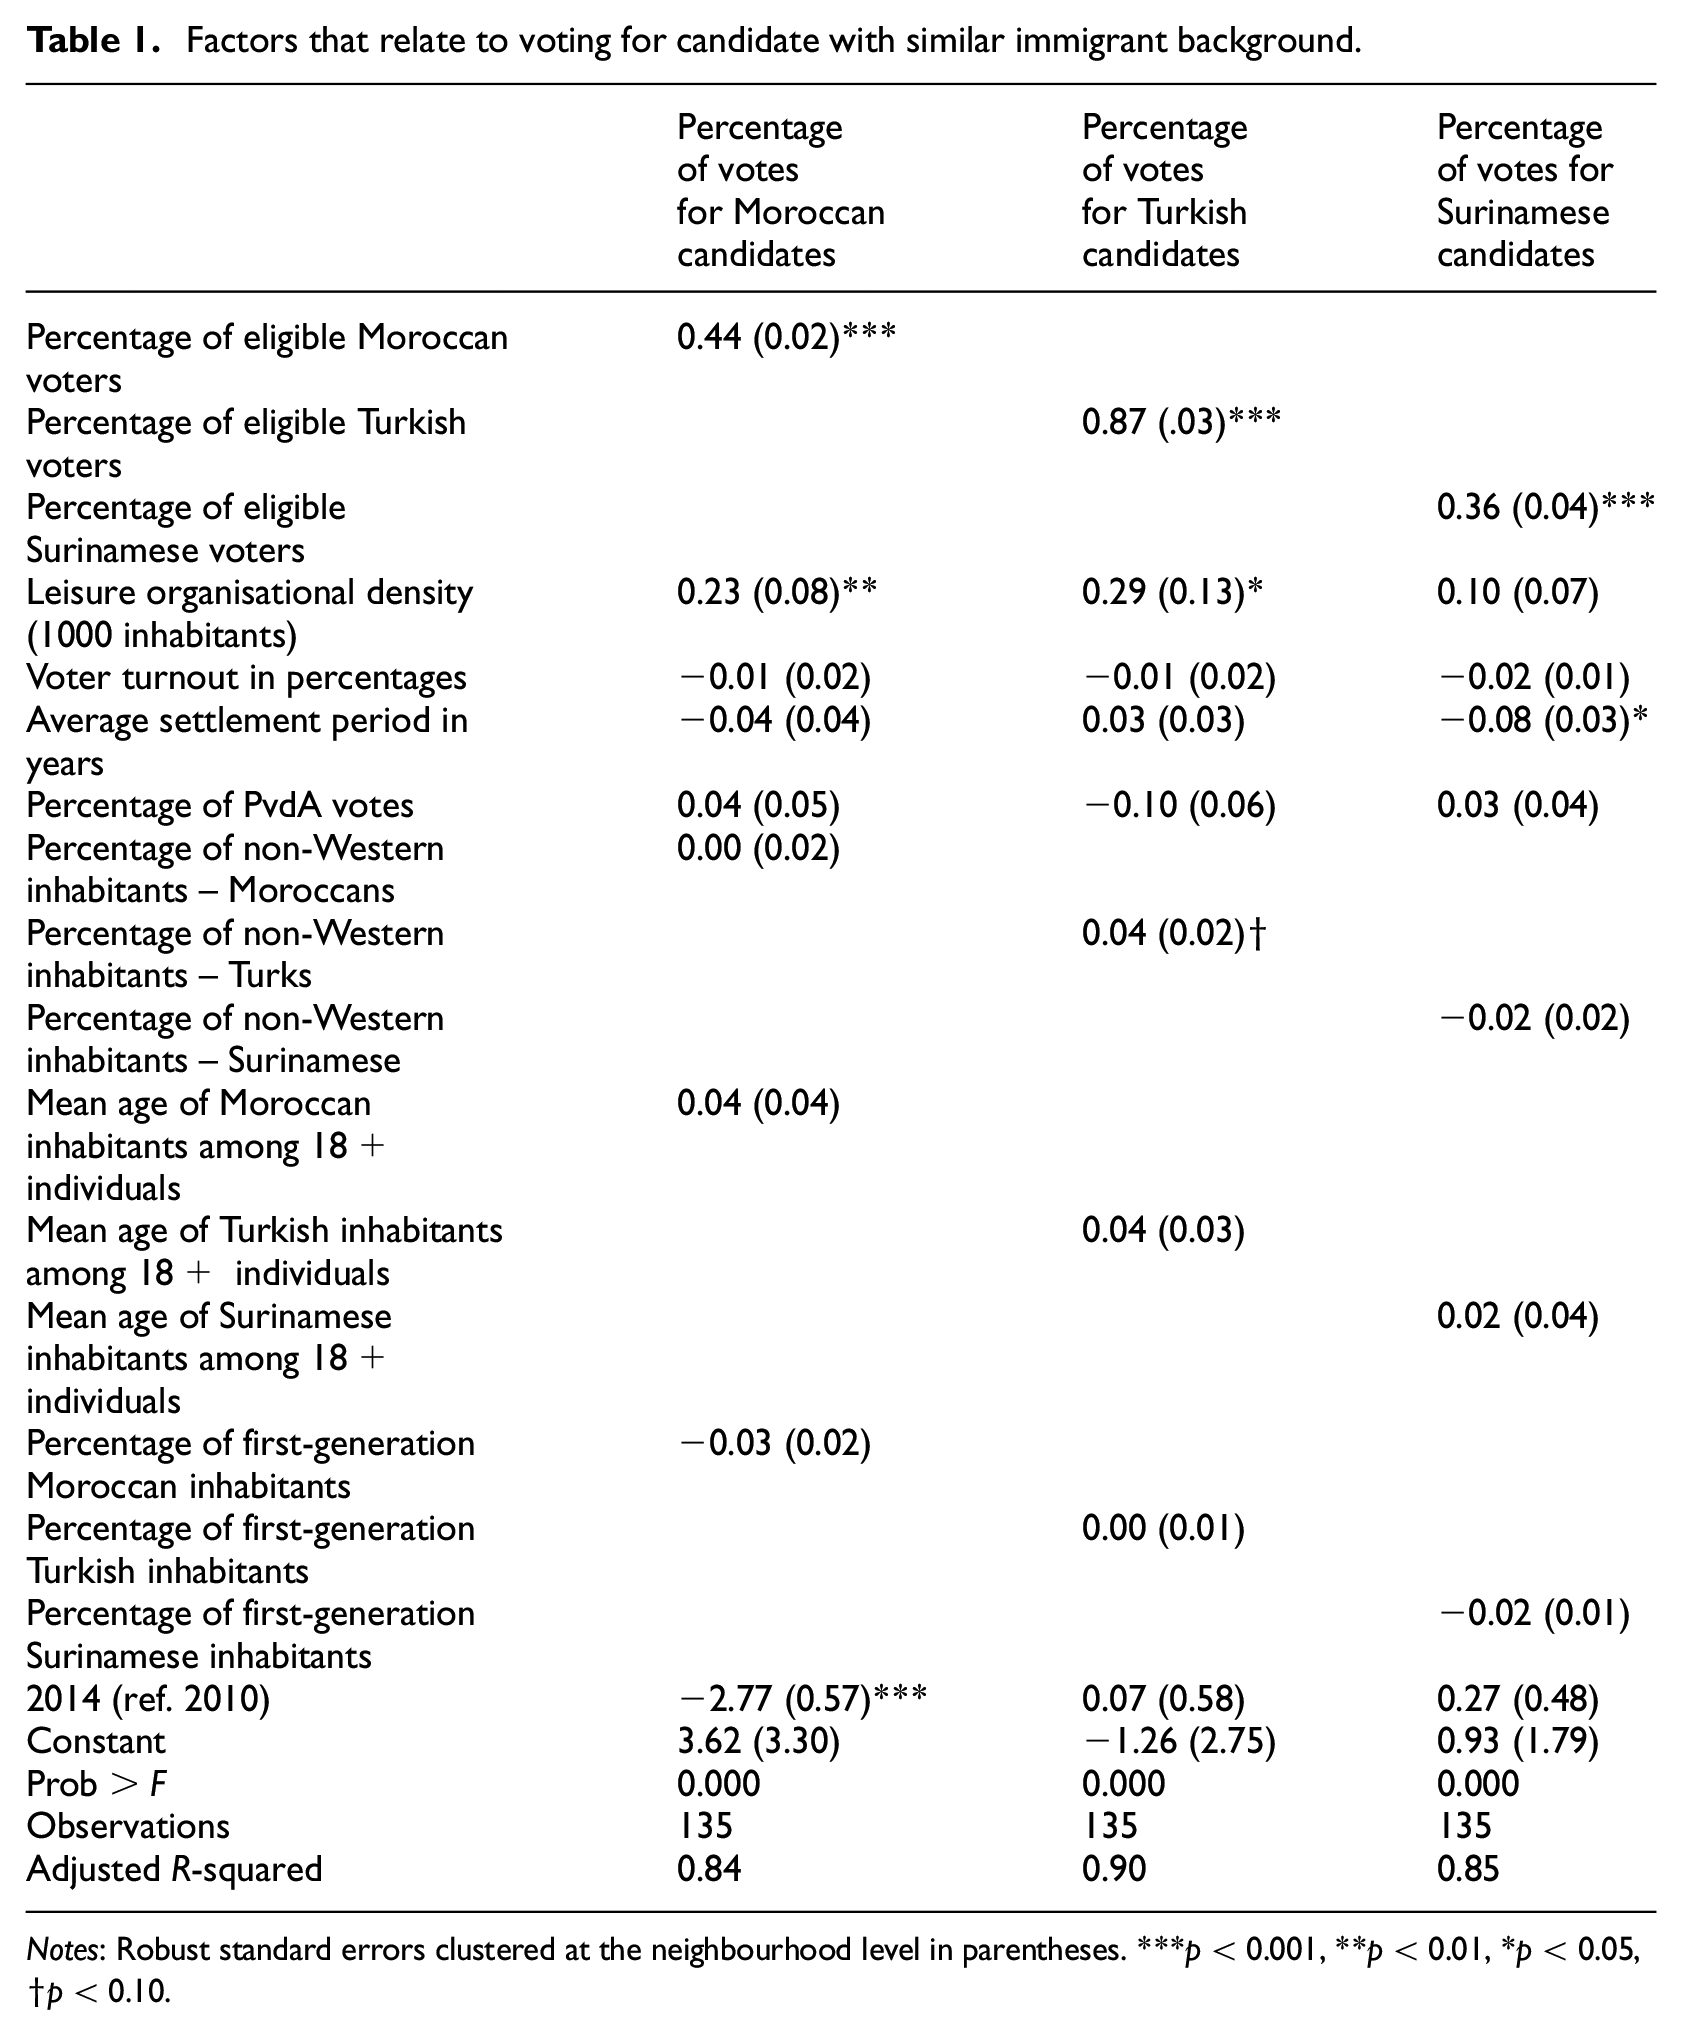
Notes: Robust standard errors clustered at the neighbourhood level in parentheses. ***p < 0.001, **p < 0.01, *p < 0.05, †p < 0.10.
A 1% increase in eligible Moroccan and Surinamese voters leads to, respectively, a 0.44% increase in votes for Moroccan candidates and a 0.36% increase for Surinamese candidates. The effect is much larger for eligible Turkish voters, where a 1% increase leads to a 0.82% increase in votes for Turkish candidates. The effect is larger among Turks than among Moroccans or Surinamese, therefore seeming to confirm hypothesis 2.
We also included in our analyses control variables to explore whether the aforementioned effects can be explained by average settlement period, percentage of non-Western inhabitants (minus the concerned immigrant group), leisure organisational density, PvdA votes, percentage of first-generation immigrants and mean age among the 18+. Leisure organisational density relates positively to bloc voting for all groups, though the effect is not statistically significant for voting for Surinamese candidates (P = 0.11). Neighbourhoods with a high level of these organisations displayed more bloc voting. We surmise that these heterogeneous civic networks function as mobilising networks for immigrant candidates.
Average settlement period relates negatively to percentage of votes for Surinamese candidates. Percentage of non-Western inhabitants (derived from subtracting the percentage of Turkish, Moroccan and Surinamese inhabitants) relates positively to that of votes for Turkish candidates (P < 0.10). Percentage of votes for Moroccan candidates was lower in 2014 than in 2010.
Effects within a neighbourhood
Table 2 shows analyses in which we included dummies both for election years and for neighbourhoods. Doing so allowed us to determine whether changes within a neighbourhood relate to votes for immigrant candidates.
Factors that relate to voting for candidate with similar immigrant background: Changes within neighbourhoods.
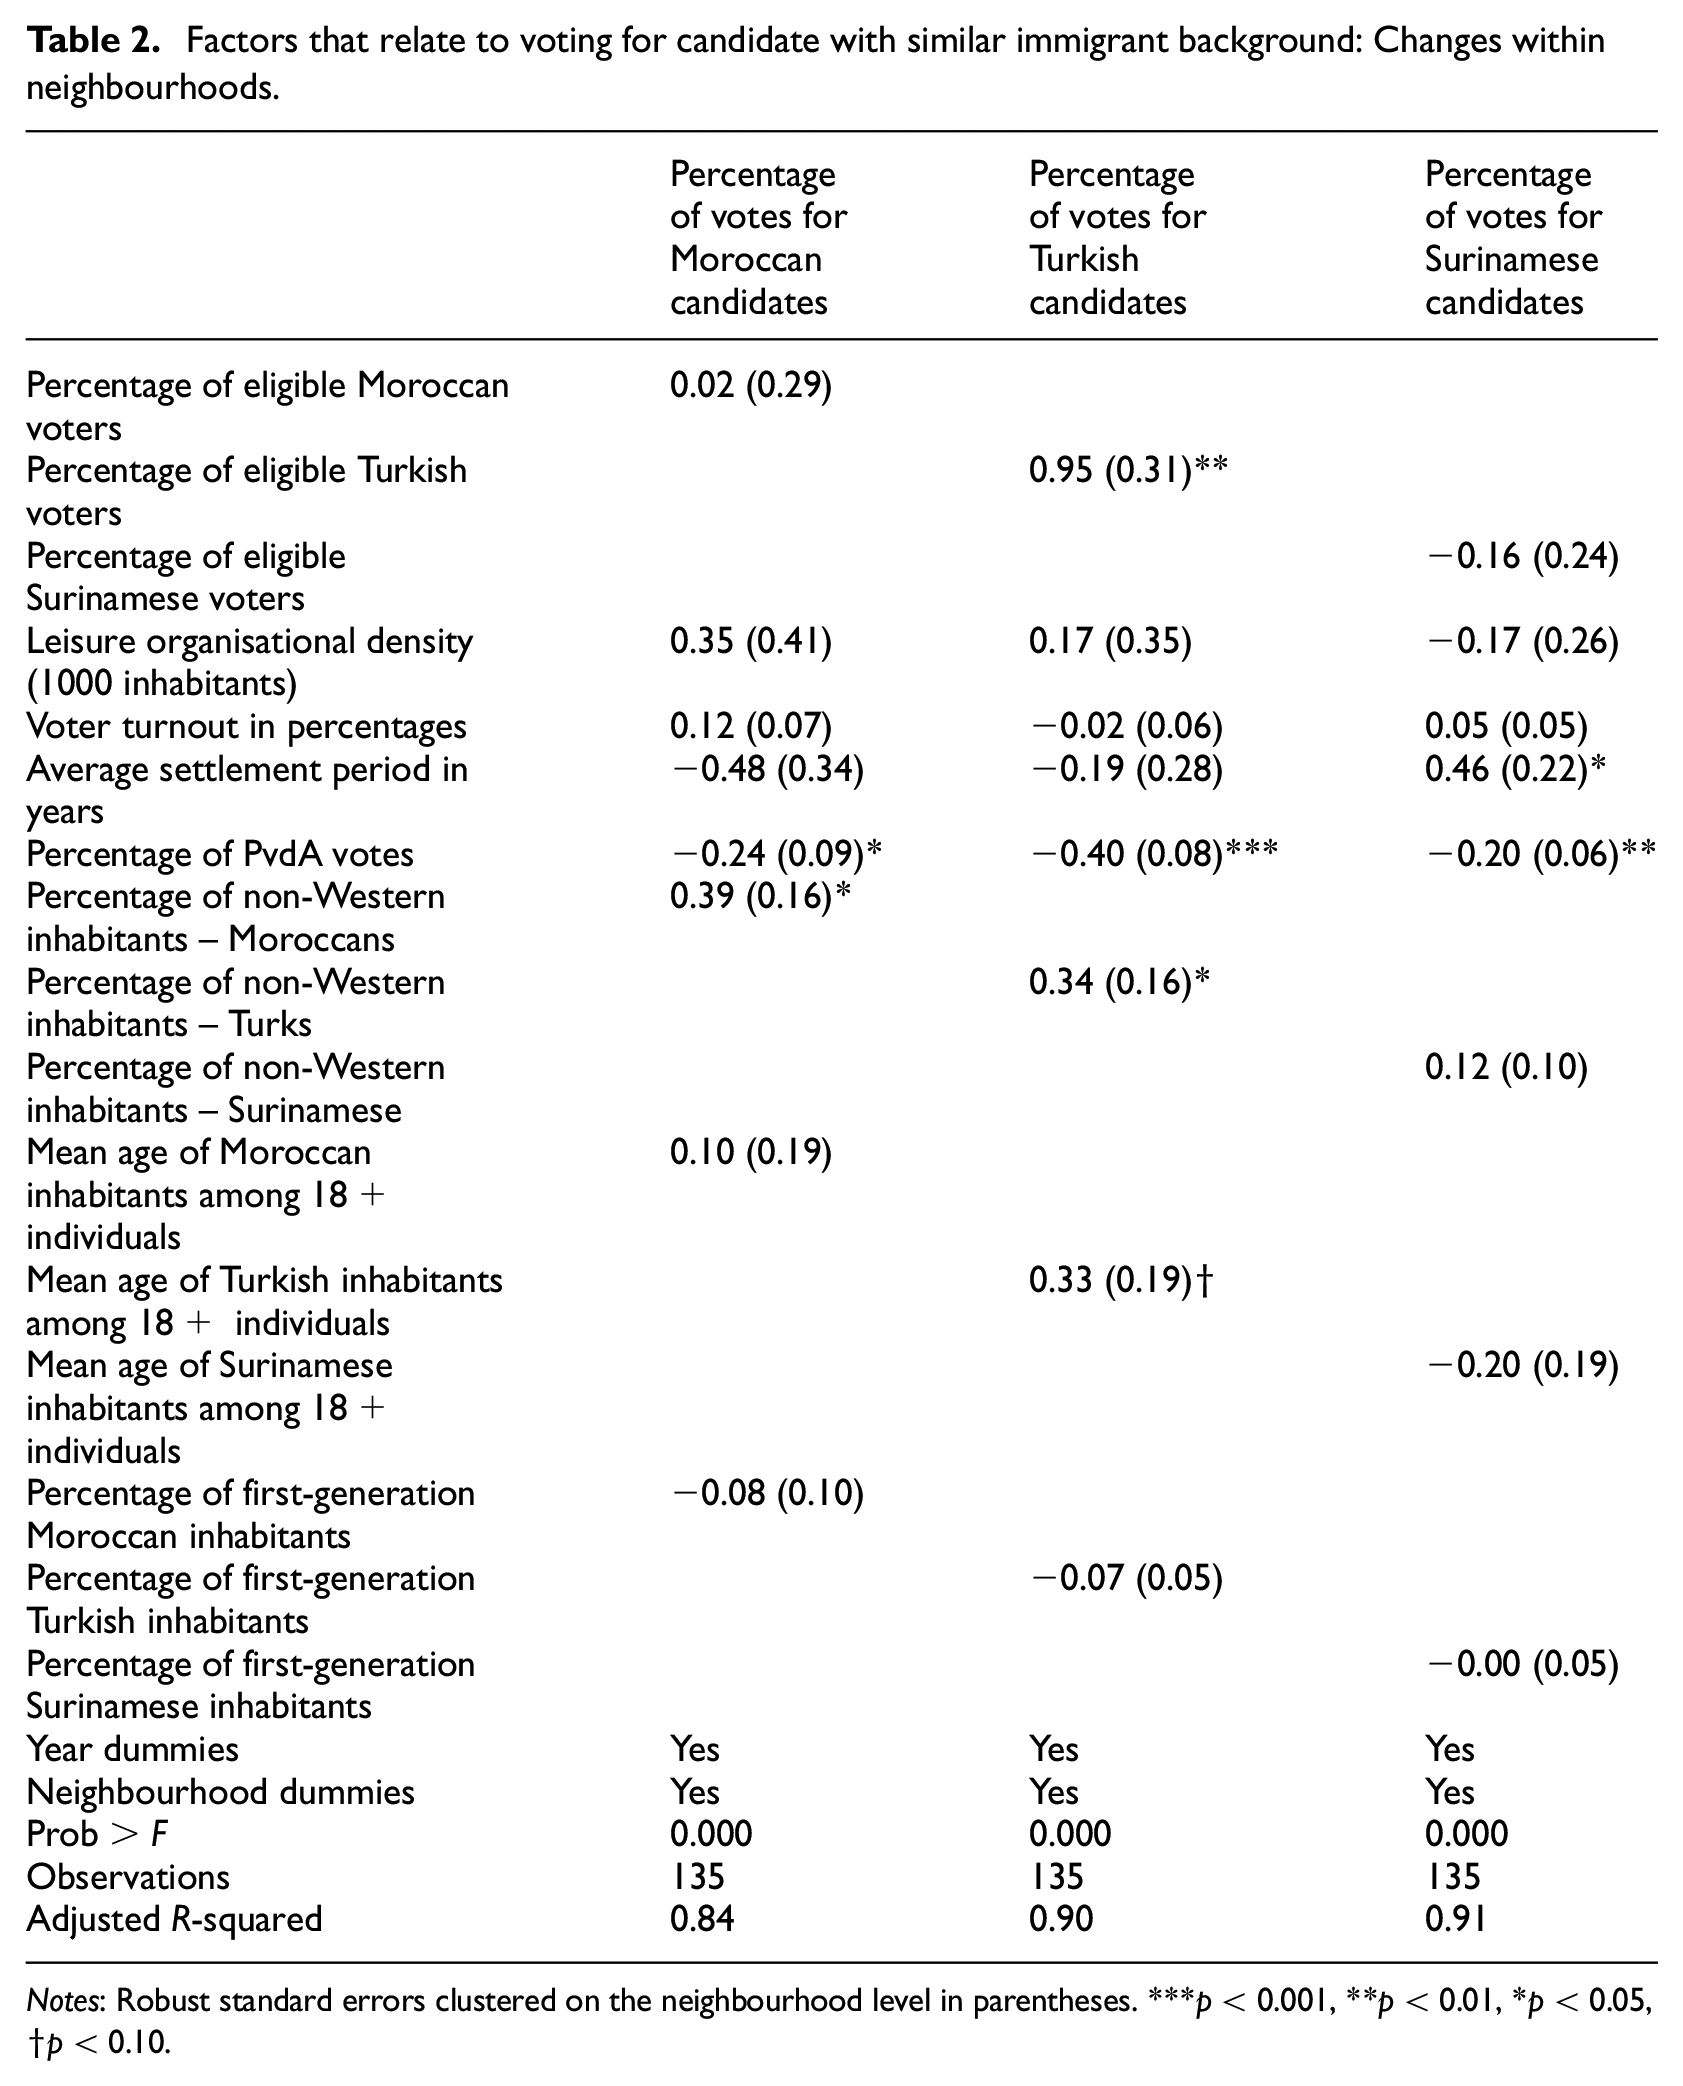
Notes: Robust standard errors clustered on the neighbourhood level in parentheses. ***p < 0.001, **p < 0.01, *p < 0.05, †p < 0.10.
The table also indicates that an increased percentage of eligible Moroccan and Surinamese voters in a neighbourhood does not relate significantly with that of votes for Moroccan and Surinamese candidates. The significant positive effects of percentages of eligible Moroccan and Surinamese voters could therefore be caused by unobserved or omitted characteristics at the neighbourhood level, which in Table 2 are absorbed by the neighbourhood dummies. Increased eligible Turkish voters within neighbourhoods relate positively to votes for Turkish candidates in these neighbourhoods; overall, a 1% increase of these voters coincides with a 0.95% increase of votes for Turkish candidates. This large effect size indicates the average effect among neighbourhoods. The standard deviation of 0.31 indicates that some variation among the neighbourhoods still exists. Since our analyses comprise most of the neighbourhoods for 2010 and 2014, the effect size tells us something about the average size of effects in the neighbourhoods. We only found support for the notion that an increased percentage of eligible Turkish voters relates positively to votes for Turkish candidates within these neighbourhoods, and not for the other groups. Again, we therefore found that the effects of the size of the immigrant group on the percentage of votes for immigrant candidates is stronger among Turks than Moroccans or Surinamese. As shown in our methods section, the variance – indicated by the standard deviation of the difference in numbers of Turkish inhabitants in 2010 and 2014 in the neighbourhoods was smaller than that of Moroccans and similar to that of Surinamese. The statistically significant result for Turkish inhabitants and non-significant results for the other groups cannot therefore be attributed to a lack of variance in percentages of Moroccan and Surinamese inhabitants in the neighbourhoods.
As for the control variables, an increase in PvdA votes relates negatively to votes for all candidates of immigrant background. Reflected here are the decreased PvdA votes between 2010 (29.3%) and 2014 (18.4%). We see that an increase in average neighbourhood settlement period relates positively to percentage of votes for Surinamese candidates. An increase in percentage of other non-Western inhabitants relates positively to votes for Turkish and Moroccan candidates. Lastly, an increase in mean age of 18+ Turkish inhabitants relates positively to percentage of votes for Turkish candidates (P < 0.10).
Testing the concentration effect
To explore possible non-linear correlation with the percentage of bloc votes, we added a quadratic term for percentage of eligible Turkish, Moroccan and Surinamese voters. The quadratic term for eligible Moroccan voters was not significant (not illustrated in a graph), indicating a linear correlation between percentages of eligible Moroccan voters and votes for Moroccan candidates. Therefore, we found no applicability for hypothesis 1 for Moroccans. The quadratic terms for eligible Turkish and Surinamese voters are significant. The relationship with bloc votes is depicted in Figure 2 (based on Table 3). It shows how the percentage of eligible voters relates to a lesser extent with the percentage of votes for Turkish and Surinamese candidates in neighbourhoods with lower percentages of eligible Turkish and Surinamese voters. An increased percentage of eligible Turkish and Surinamese voters has a larger effect on the percentage of immigrant votes in neighbourhoods with a relatively large percentage of eligible Turkish and Surinamese voters. In other words, the increase in eligible Surinamese voters from 3% to 4% had a smaller effect on the percentage of bloc votes than an increase from 20% to 21%. This association was most obvious for Surinamese voters, while Turks still showed a mostly linear association. Closer analyses indicated that the non-linear effect on Surinamese bloc voting was caused by neighbourhood outliers – those with eligible Surinamese voters comprising more than 20% of the total.
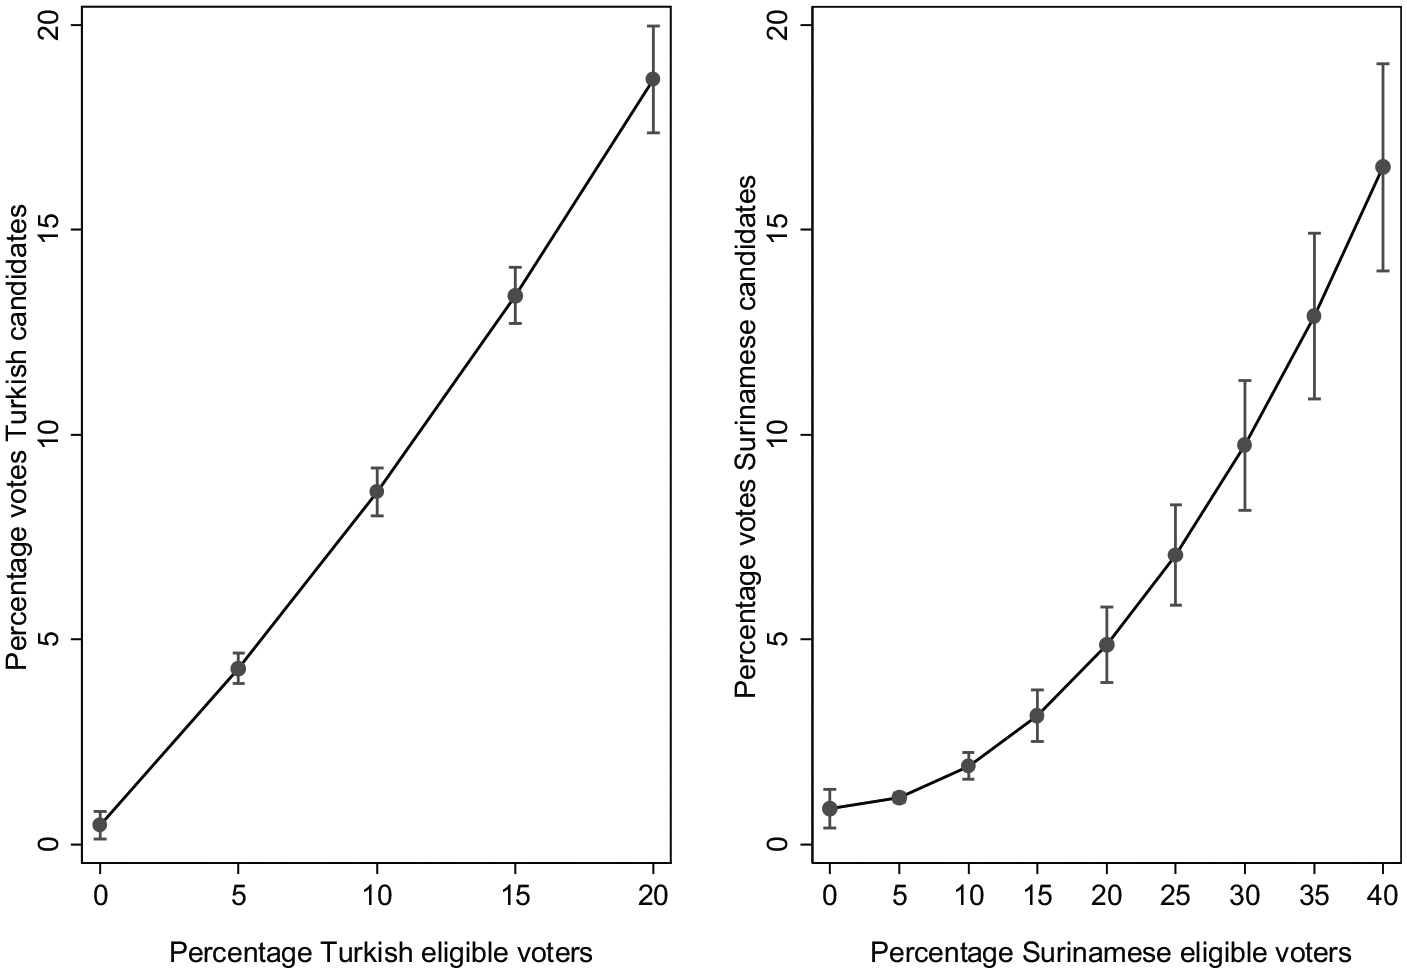
How percentage of eligible immigrant voters relates to the percentage of votes for candidates with similar immigrant background (95% confidence interval).
Factors that relate to ethnic voting: A non-linear effect of relative size of ethnic group voters.
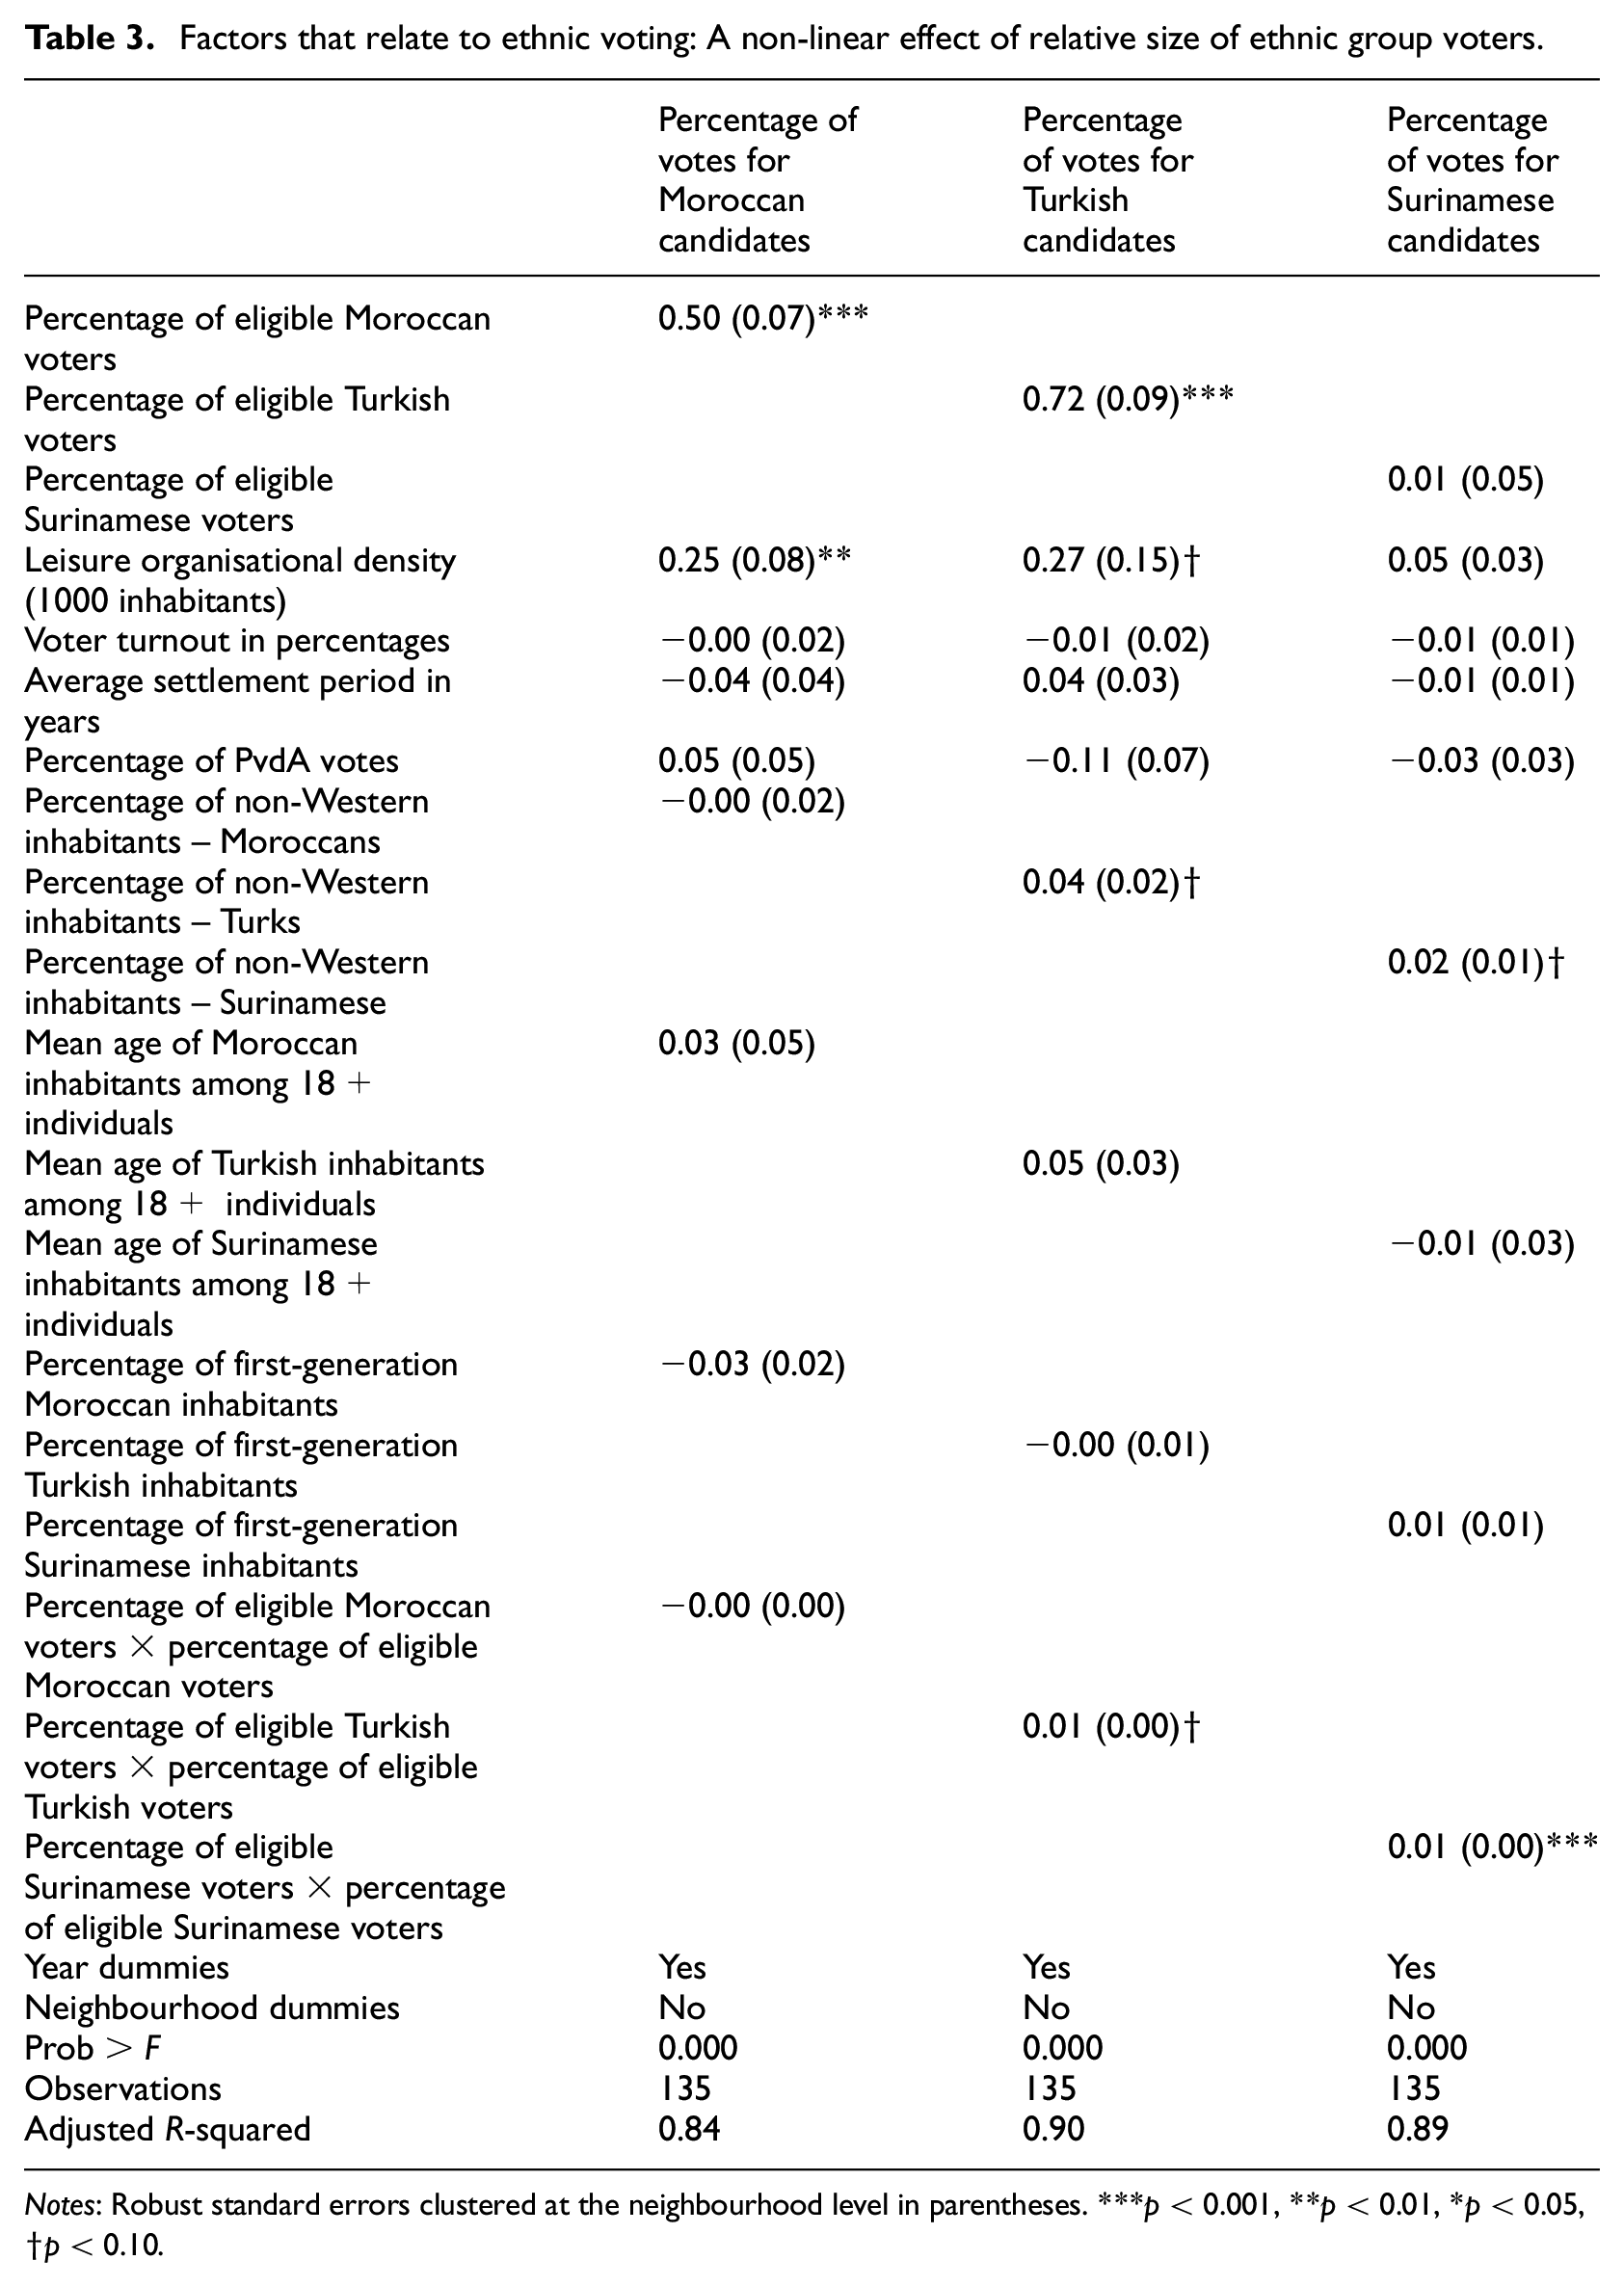
Notes: Robust standard errors clustered at the neighbourhood level in parentheses. ***p < 0.001, **p < 0.01, *p < 0.05, †p < 0.10.
We also tested the quadratic effect in the model that includes dummies for neighbourhoods and election years, as we did in Table 4. Figure 3 (based on Table 4) shows how the association between percentages of eligible Turkish voters and votes for Turkish candidates was more obviously non-linear if we controlled for variance between neighbourhoods. Even if we controlled for this as well as variance between election years, we found that percentage of eligible Turkish voters has a non-linear positive effect on that of votes for Turkish candidates. We thus found support for hypotheses 1 and 2; it is not merely a neighbourhood’s composition, but also the within-neighbourhood dynamics that matter. The association between percentages of eligible Surinamese voters and votes for Surinamese candidates did not hold if we controlled for variance between neighbourhoods.
Factors that relate to ethnic voting: A non-linear effect of relative size of ethnic group voters within neighbourhoods.
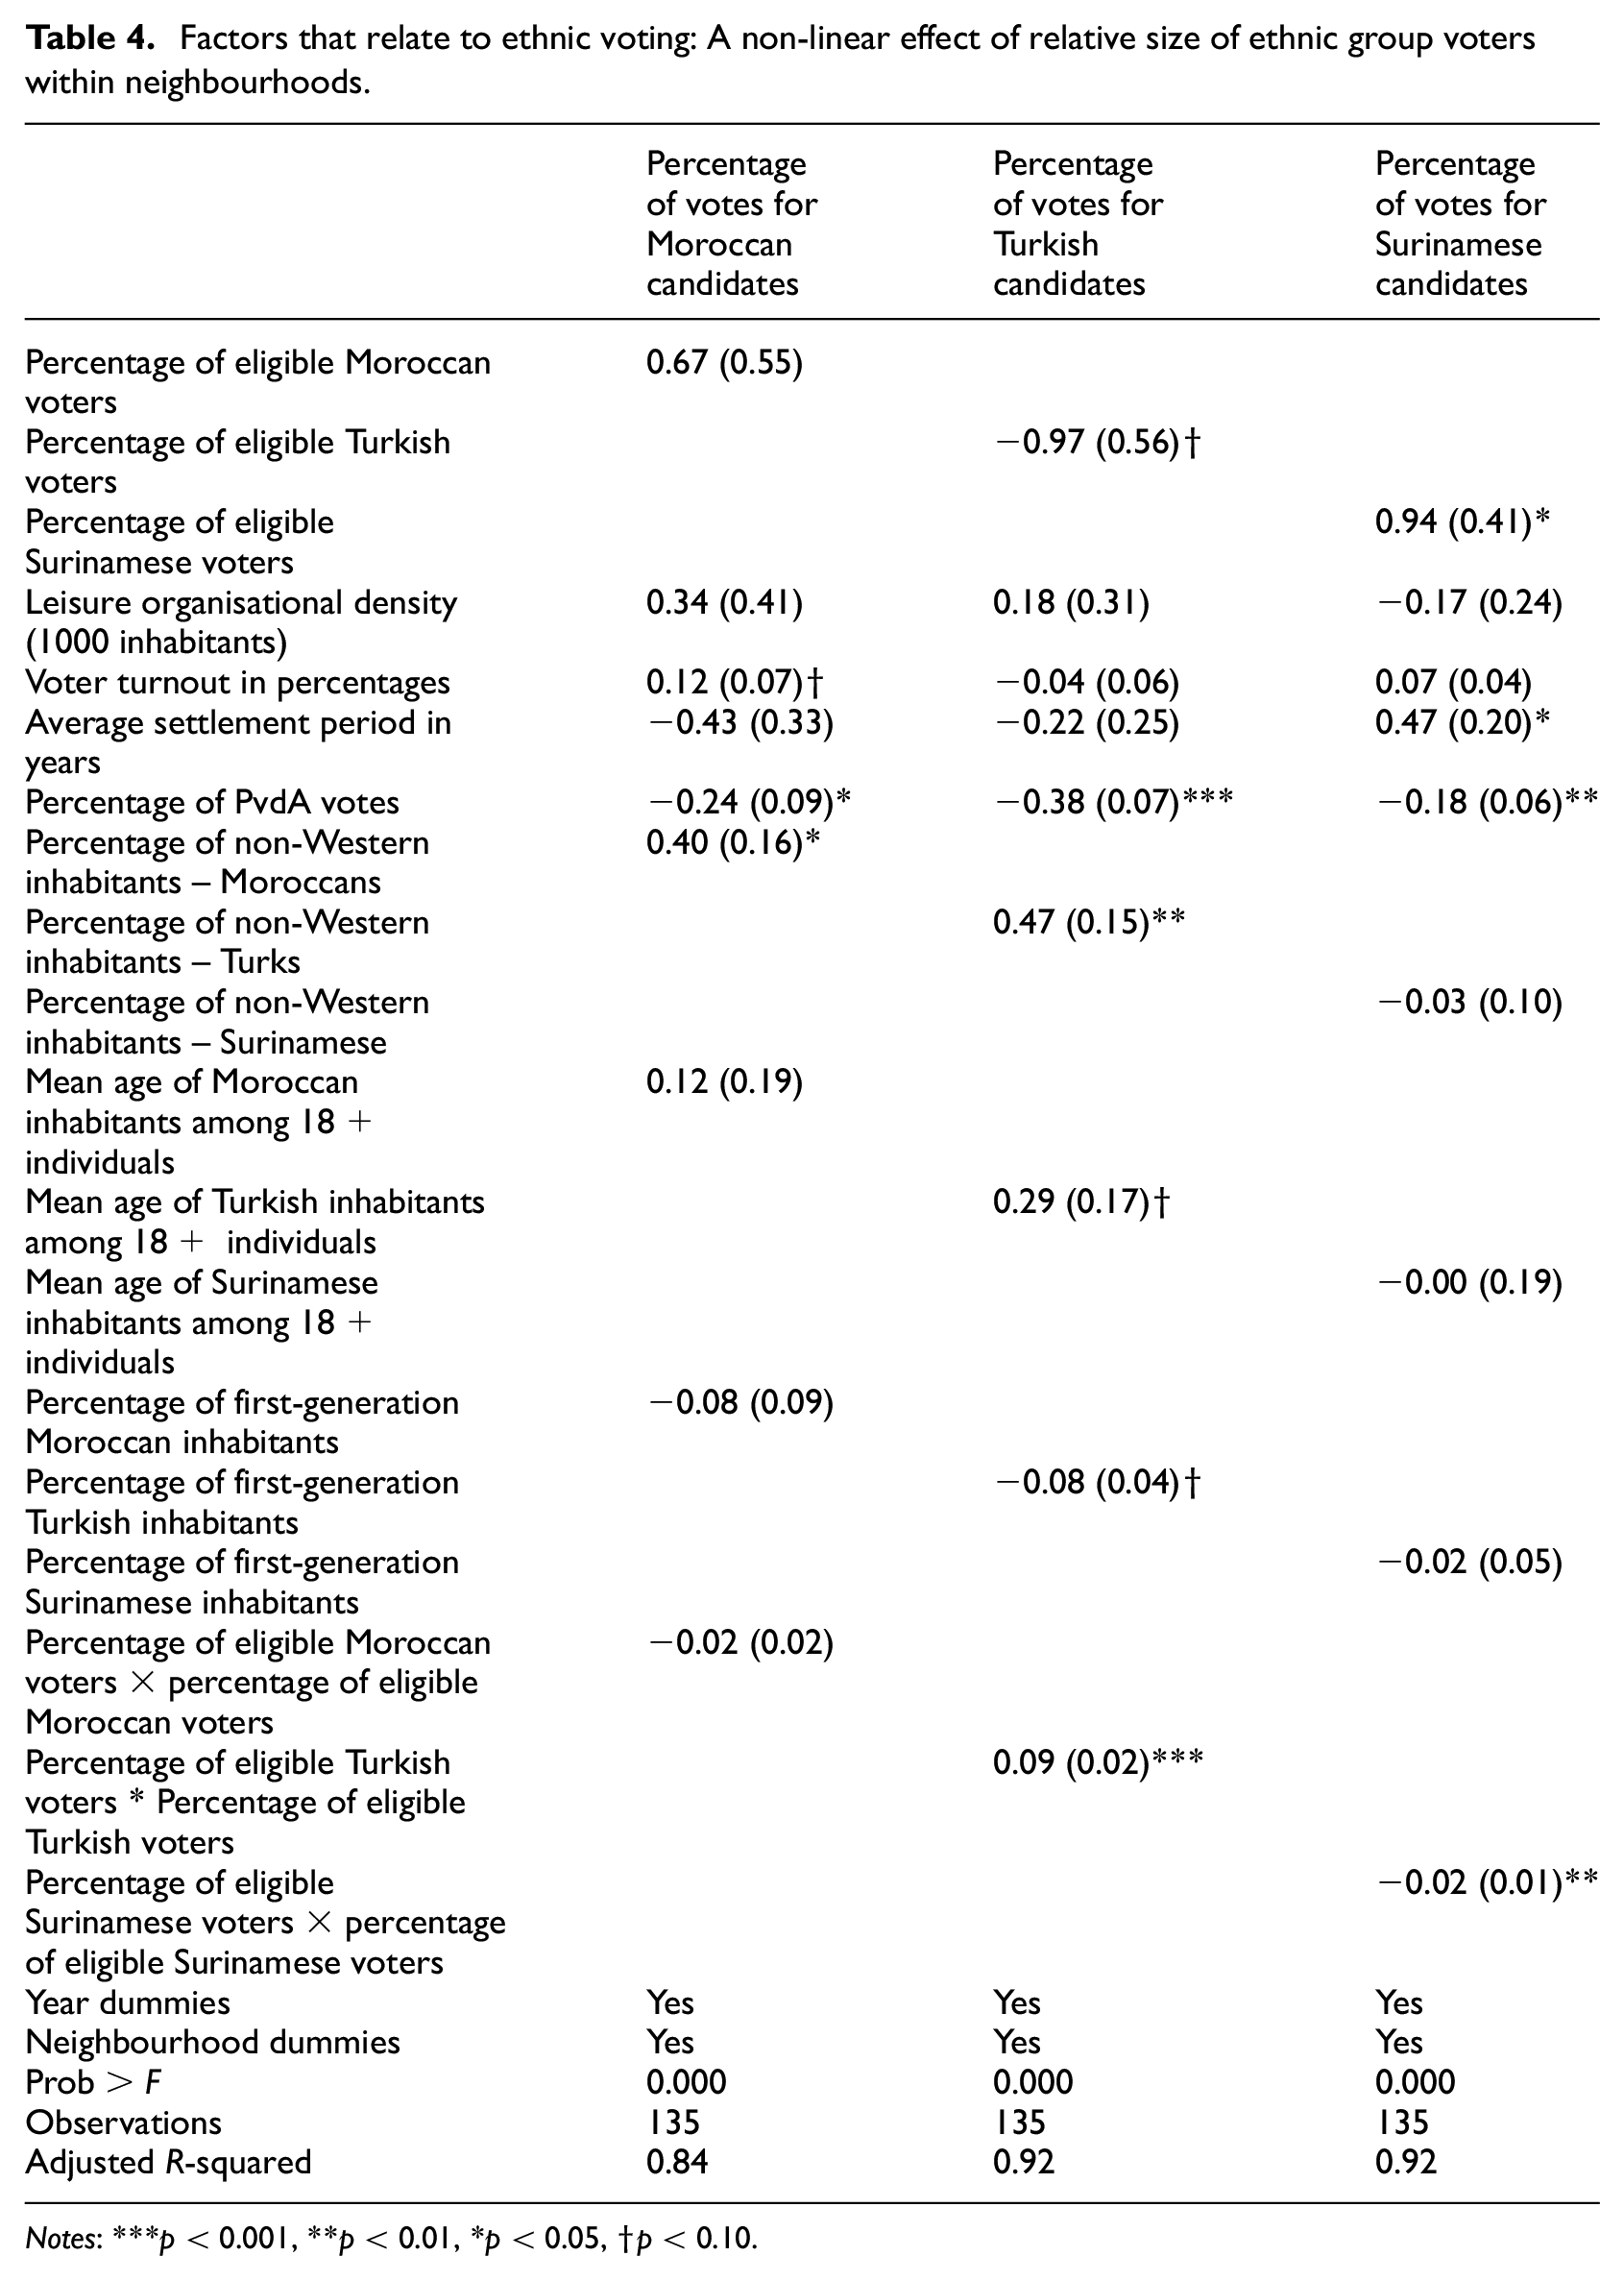
Notes: ***p < 0.001, **p < 0.01, *p < 0.05, †p < 0.10.
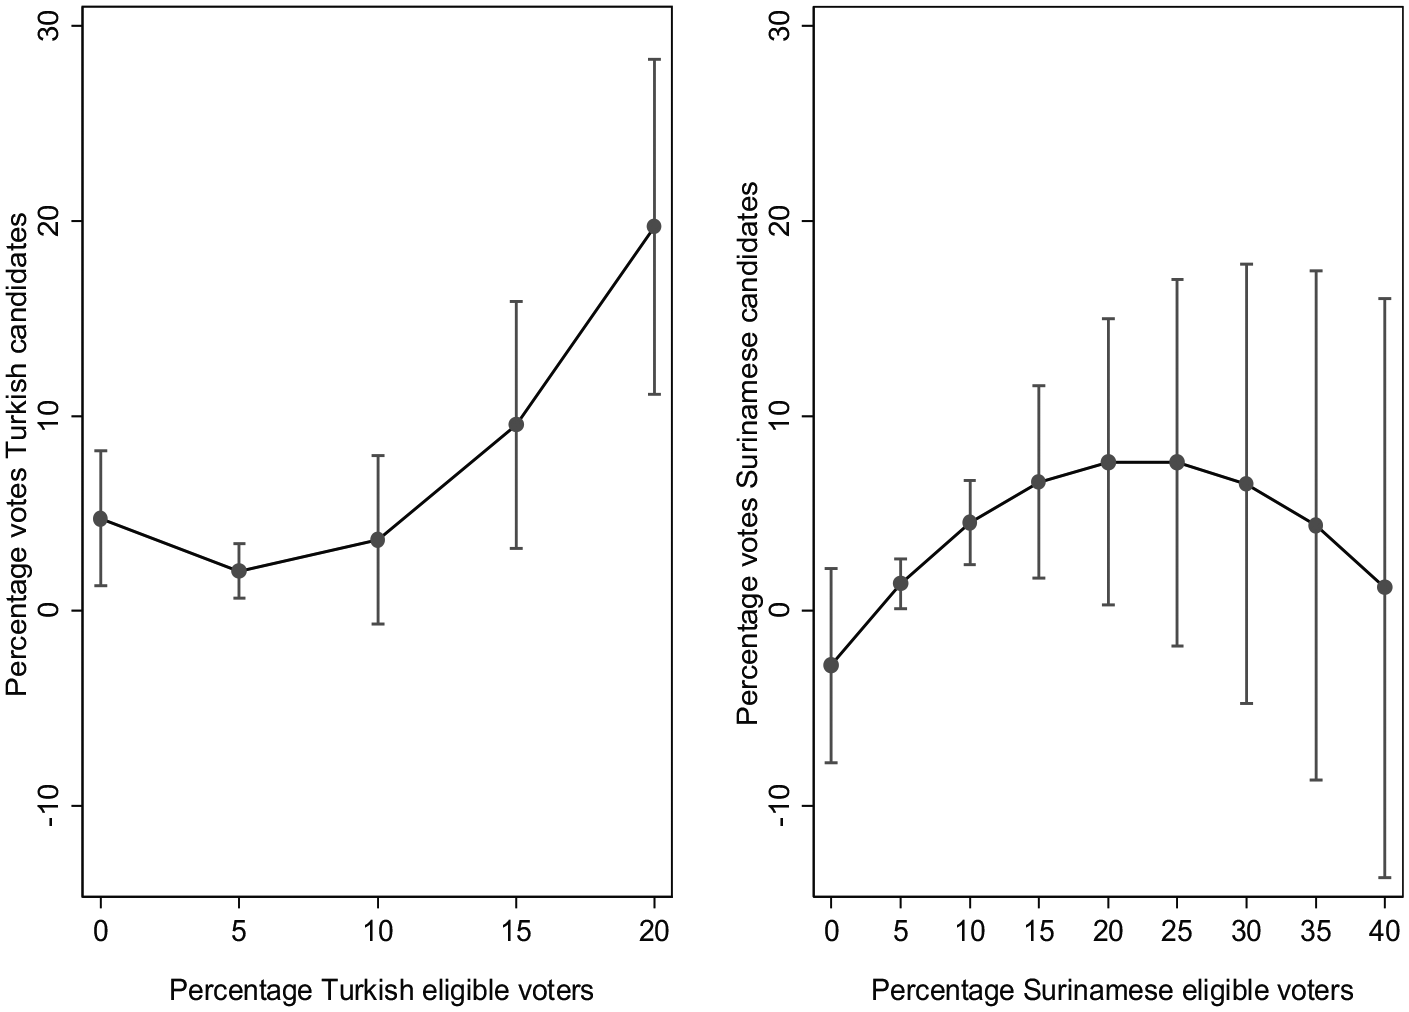
How percentage of eligible immigrant voters within the neighbourhood relates to the percentage of votes for candidates with similar immigrant background (95% confidence interval).
Finally, to see how the percentage of eligible immigrant voters relates to the percentage of immigrant votes depending on the group’s mean age, we added an interaction between mean age of 18+ inhabitants per immigrant group and percentage of eligible immigrant voters as well as its quadratic term. 6 The percentage of eligible Moroccan voters did not relate differently to that of votes for Moroccan candidates across neighbourhoods with Moroccan inhabitants of varying average age. It did so for Turks and Surinamese. The percentage of eligible Turkish voters did not relate to that of votes for Turkish candidates in neighbourhoods with Turkish inhabitants of the lowest average age (33) among the 18+. The same held true for Surinamese in neighbourhoods with inhabitants of the lowest average age (37). We observed a similar pattern for neighbourhoods with a high average age among the 18+ Turkish and Surinamese inhabitants. For both, the percentage of eligible Turkish and Surinamese voters positively relates to that of immigrant votes. We again observed the non-linear effect here; the increase in eligible Surinamese voters from 3% to 4% had a smaller effect on percentage of bloc votes than an increase from 20% to 21% in neighbourhoods with the highest average age (49) among Surinamese inhabitants. This positive non-linear pattern also became obvious among eligible Turkish voters in neighbourhoods where Turkish inhabitants have a higher average age (49) among the 18+.
Conclusions
This article examined whether the concentration of an immigrant population in a neighbourhood had an effect on the extent to which its inhabitants vote for candidates of the same background in local elections. Based on political geography literature and studies on immigrant bloc voting, we identified two possible mechanisms that can yield this effect: social interaction (conversion by conversation) and party mobilisation (people who live together respond together to political campaigns). Both processes led us to expect that the size (absolute and percentage) of an immigrant group in a specific geographical context (neighbourhood) would influence the degree of bloc voting. We were especially interested in effects beyond composition. We expected that social interaction and party mobilisation mechanisms would be significantly stronger in neighbourhoods with more inhabitants of immigrant background than those with smaller concentrations thereof. These concentration effects are not necessarily linear though most likely have threshold effects (Cho et al., 2006) and differ across groups. Groups with strong place-based ethnic or religious networks and with relatively many local organisations are expected to illustrate stronger correlations between concentration at the neighbourhood level and bloc voting.
We did indeed find that the percentage of eligible Turkish voters had a stronger effect on bloc voting in neighbourhoods than was the case for Moroccans or Surinamese. In our analyses of effects within neighbourhoods, we observed how changes solely in percentage of eligible Turkish voters positively related to that of votes for Turkish candidates. Such changes in the Moroccan and Surinamese communities did not relate to bloc voting. For Turks, we thus also found a threshold effect; the percentage of eligible voters could have a non-linear effect on bloc voting, as well as differ according to groups’ mean age. Political behaviour by inhabitants in neighbourhoods in which the size of the immigrant population was large and there was a strong local infrastructure – in terms of robust social, ethnic and civic networks in which predominantly older first-generation immigrants participate – was accordingly influenced and transformed. Concentration facilitates political conversations, leading to greater political conversion. Simultaneously, the neighbourhoods become more attractive for campaigning parties and candidates, garnering more votes for candidates of the same background. We did not find such neighbourhood effects for Moroccans or Surinamese communities – both of whom have lower levels of ethnic identity, ethnic networks and immigrant organisational density – or in neighbourhoods with relatively few Turkish voters. This shows that immigrant concentration in itself can, but only under certain circumstances, have important implications for the political behaviour of voters of immigrant background. That, in turn, can have significant consequences for the ability of immigrant groups to enter the precincts of power in particular urban contexts.
That said, political geography literature hints at possible segregation effects of social interaction mechanisms in neighbourhoods. Pattie and Johnston (2016) argue that conversation networks may increase perceived distance between individuals’ opinions and those of other groups. Conversations may further bond individuals within their own neighbourhood, both socially and ideologically, while isolating them from other networks and groups. Moreover, collective strategies, such as bloc voting, often further segregate groups from mainstream political parties, sometimes thwarting representation of the immigrant constituency’s interests within the Dutch political arena (Vermeulen et al., 2014).
Our results lead us to believe that, for some individuals and groups with specific characteristics, the neighbourhood affects patterns of bloc voting in specific ways. Immigrant concentration, depending on neighbourhood and circumstances, can enhance social connectedness and community networks – formal and informal, secular and religious – which, in turn, enables mechanisms leading to bloc voting. In those instances, immigrant concentration at the neighbourhood level can be a major resource for immigrant political participation and representation. However, reasons for bloc voting, what ethnicity or immigrant background actually means for voters, and the manner in which a candidate’s ethnicity signals particular cues for voters, cannot be fully understood using only our study’s applied data. Even for Turkish voters, who collectively show evidence of conversation network effects, more is at play than, say, a candidate possessing a Turkish-sounding name that provides relatability and legitimacy for Turkish voters. The Turkish community in Amsterdam is, much as in other European cities, highly diverse in ideology, ethnicity and religion. To a voter, that someone is of Turkish descent matters, but so might belonging to the same subgroup within the larger Turkish immigrant community. More research at the neighbourhood level is therefore needed to disentangle the precise manner in which these neighbourhood conversation networks operate. Doing so would reveal how such networks in specific demographic and neighbourhood contexts may independently sway specific groups of individuals in specific contexts to vote for specific candidates.
Footnotes
Appendix
Mean and standard deviation of variables on neighbourhood/election year level.
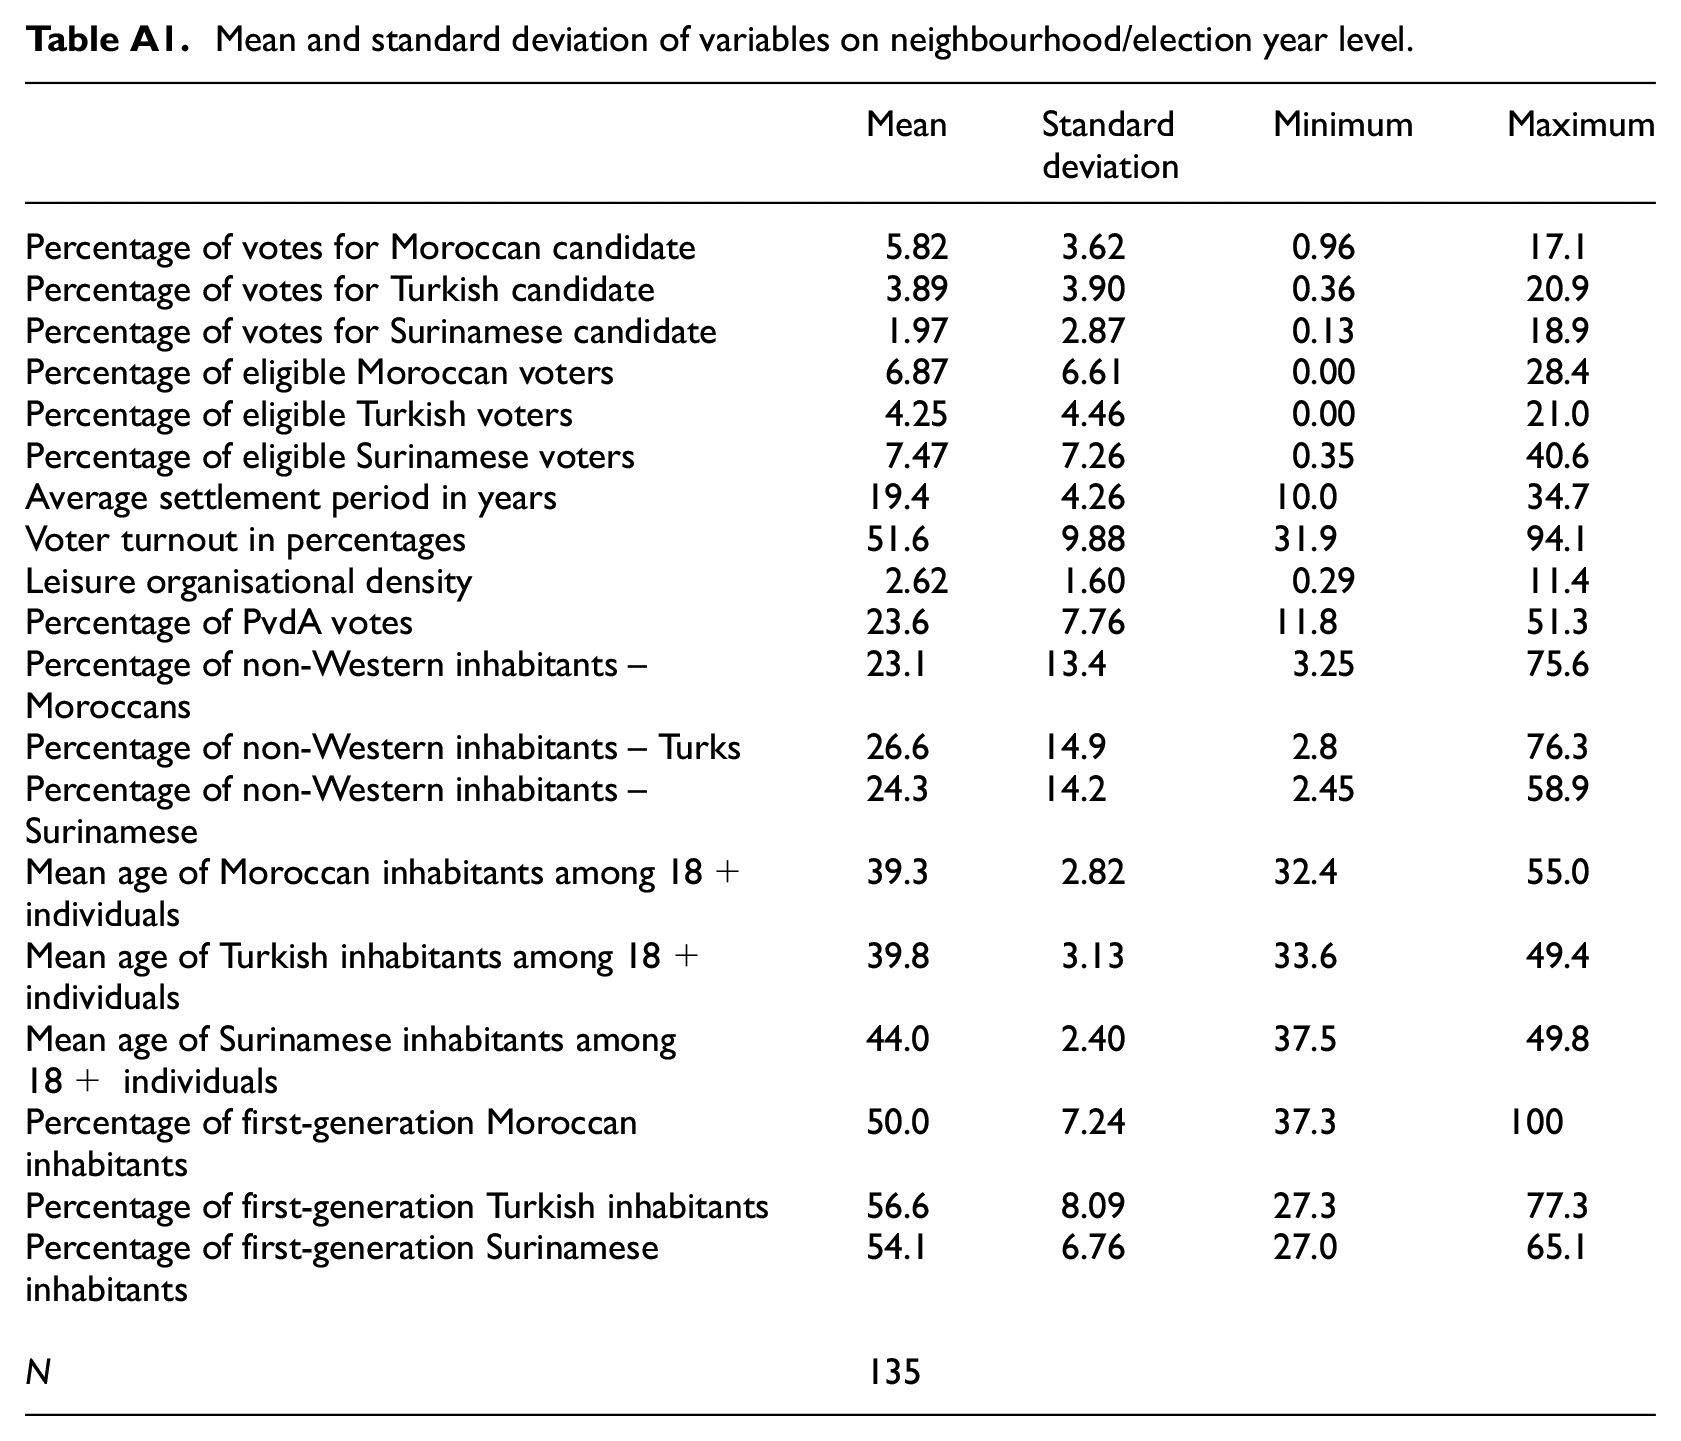
| Mean | Standard deviation | Minimum | Maximum | |
|---|---|---|---|---|
| Percentage of votes for Moroccan candidate | 5.82 | 3.62 | 0.96 | 17.1 |
| Percentage of votes for Turkish candidate | 3.89 | 3.90 | 0.36 | 20.9 |
| Percentage of votes for Surinamese candidate | 1.97 | 2.87 | 0.13 | 18.9 |
| Percentage of eligible Moroccan voters | 6.87 | 6.61 | 0.00 | 28.4 |
| Percentage of eligible Turkish voters | 4.25 | 4.46 | 0.00 | 21.0 |
| Percentage of eligible Surinamese voters | 7.47 | 7.26 | 0.35 | 40.6 |
| Average settlement period in years | 19.4 | 4.26 | 10.0 | 34.7 |
| Voter turnout in percentages | 51.6 | 9.88 | 31.9 | 94.1 |
| Leisure organisational density | 2.62 | 1.60 | 0.29 | 11.4 |
| Percentage of PvdA votes | 23.6 | 7.76 | 11.8 | 51.3 |
| Percentage of non-Western inhabitants – Moroccans | 23.1 | 13.4 | 3.25 | 75.6 |
| Percentage of non-Western inhabitants – Turks | 26.6 | 14.9 | 2.8 | 76.3 |
| Percentage of non-Western inhabitants – Surinamese | 24.3 | 14.2 | 2.45 | 58.9 |
| Mean age of Moroccan inhabitants among 18+ individuals | 39.3 | 2.82 | 32.4 | 55.0 |
| Mean age of Turkish inhabitants among 18+ individuals | 39.8 | 3.13 | 33.6 | 49.4 |
| Mean age of Surinamese inhabitants among 18+ individuals | 44.0 | 2.40 | 37.5 | 49.8 |
| Percentage of first-generation Moroccan inhabitants | 50.0 | 7.24 | 37.3 | 100 |
| Percentage of first-generation Turkish inhabitants | 56.6 | 8.09 | 27.3 | 77.3 |
| Percentage of first-generation Surinamese inhabitants | 54.1 | 6.76 | 27.0 | 65.1 |
| N | 135 |
Acknowledgements
We thank Boris van den Berg for his assistance with preparing the dataset for the analyses. For their comments, we are grateful to Nancy Foner and participants at the presentation of an earlier version of this article given on 2 May 2017 at the Graduate Center, City University of New York. We also thank the reviewers, Eelco Harteveld and Walter Nicholls for providing useful feedback on previous versions.
Declaration of conflicting interests
The author(s) declared no potential conflicts of interest with respect to the research, authorship, and/or publication of this article.
Funding
The author(s) received no financial support for the research, authorship, and/or publication of this article.