
Abstract
Introduction:
Ionized Hydrogen Peroxide (iHP) is a new technology used for the decontamination of surfaces or laboratory areas. It utilizes a low concentration of hydrogen peroxide (H2O2) mixed with air and ionized through a cold plasma arc. This technology generates reactive oxygen species (ROS) as a means of decontamination.
Objectives:
The purpose of this study is to evaluate the diffusion effect of iHP and its decontamination capabilities using biological and enzyme indicators.
Methods:
A gas-tight fumigation room with a volume of 880 ft3 was used for the decontamination trials. During the decontamination process, empty animal cages were placed inside to create fumigant distribution restrictions. Spore and enzyme indicators were placed in eleven locations throughout the decontamination room. Generation of iHP was done with the use of TOMI’s SteraMist Environmental System and the SteraMist Solution, with 7.8% H2O2 at a dose of 0.5 ml per ft3.
Results:
For the decontamination of 1hr, 2hrs, 6hrs, and 12hrs, the biological indicators of B. atrophaeus in Stainless Steel (SS) Disk in Tyvek envelope have an inactivation rate of 94%, 97%, 100%, and 100%, respectively. For G. stearothermophilus in SS disk and Tyvek envelope, it has 82%, 68%, 100%, and 100%, respectively and, for G. stearothermophilus in SS strips it has an effective rate of 88%, 67%, 91%, and 100%, respectively.
Conclusion:
iHP inactivates spores, and the residual tAK activity indicates a gas-like fumigant diffusion due to the uniformity of the inactivation without the use of oscillating fans as the contact time is extended.
Keywords
Introduction
Ionized hydrogen peroxide (iHP) is a new technology used for the decontamination of surfaces or laboratory areas. It uses a low concentration of hydrogen peroxide (H2O2) at 7.8% mixed with air and ionized through a cold plasma arc. This technology generates reactive oxygen species (ROS) as a means of decontamination. Members of the ROS in the air include ozone, atomic oxygen, superoxide, peroxide, and hydroxyl radicals. 1,2 In addition to these, H2O2 generates oxidative stress that attacks multiple molecular targets, including nucleic acids, enzymes, cell wall proteins, and lipids. 3,4
There have been other hydrogen peroxide systems that have been used in the past to decontaminate surfaces, laboratories, and HEPA filters, but their lack of penetration is a concern. 5 Because iHP is the newest technology available, its application and incompatibility issues have not been documented. In preliminary test trials (personal communication), the iHP system presents diffusion-like patterns similar to a gaseous system. One of the advantages of using hydrogen peroxide is that it does not leave any residue after the decontamination process because it breaks down into water and oxygen. 6 -8 The purpose of this particular study is to evaluate the diffusion effect of iHP and its decontamination capabilities using biological and enzyme indicators.
Materials and Methods
Biological Indicator and Enzyme Indicators
To evaluate the effectiveness and diffusion of the decontamination process, biological indicators of Bacillus atrophaeus ATCC 9372 in stainless steel disks and Tyvek envelope (Catalog No. GRS-090, population 2.2 × 10⁶, d-value 0.7 minutes, Mesa Labs, Lakewood, CA, USA) along with biological indicators of Geobacillus stearothermophilus ATCC 12980 in stainless steel disks with Tyvek envelope (Catalog HMV-091, Population 2.0 × 10⁶, d-value, 1.7 minutes, Mesa Labs, Lakewood, CA, USA) and in stainless steel strips (Catalog SBC-327, population 1.9 × 10⁶, d-value 2.4 minutes, Mesa Labs, Lakewood, CA, USA) were used.
In addition to the biological indicators, thermostable adenylate kinase (tAK) enzyme indicators (Protak Scientific, Redhill, Surrey, UK) were used alongside the biological indicators. The tAK enzymes indicators are made of tAK from thermophilic bacteria found in hot springs (Sulpholobus acidocaldarius). 9,10 The tAK enzyme is a phosphotransferase enzyme that catalyzes the reversible formation of adenosine triphosphate (ATP) and adenosine monophosphate (AMP). 11 Its composition has been modified with luciferase/luciferin assay to emit fluorescence with the production of ATP that can be measured with a luminometer.
Decontamination Setup
A fumigation room with a volume of 880 ft3 (8 ft × 11 ft ×10 ft) was used for the decontamination trials. This gas-tight room has air-pressure-resistant doors and bioseal dampers to isolate the room during decontamination procedures. During the decontamination process, empty animal cages (2.75 ft × 2.75 ft × 7 ft) were placed inside the fumigation room to create fumigant distribution restrictions. Spore indicators and enzyme indicators were placed in 11 locations throughout the decontamination room in the corners in high and low positions and underneath or behind the animal cages.
Decontamination Process
Generation of iHP was done with the use of the SteraMist Environmental System equipment (TOMI Environmental Solutions, Beverly Hills, CA, USA) at a rate of 25 ml/min and 20 psi of air pressure through the plasma arc.
The total room volume was adjusted to 900 ft3 for ease of dose calculations, and the disinfection solution used was SteraMist Solution (TOMI Environmental Solutions, Beverly Hills, CA, USA), with 7.8% H2O2 at the dose of 0.5 ml per ft3. Air-sampling monitors for measuring concentrations of 03 and H2O2 were located inside the room, and the bioseal dampers and the pneumatic gasketed door were closed before the start of the fumigation to provide a gas-tight room. The total spray time per decontamination trial was 18 minutes, and the contact periods that started at the end of the spray times were for 1 hour, 2 hours, 6 hours, and 12 hours. For each decontamination period, a total of 3 trials were done. The samples were collected and processed after a 30-minute ventilation period of the room.
Room environmental conditions during decontamination were measured using a temperature and humidity sensor (Velocicalc, Model 9555P, Probe Model 966, TSI Incorporated, USA). Also, hydrogen peroxide and ozone levels were measured using a portable gas detector (PortaSens II, Model C16, Analytical Technology, Inc, USA) with smart-sensor modules for ozone (O3, 1-5 ppm, Part No. H10-00-1008) and hydrogen peroxide (H2O2, 10-100 ppm, Part No. H10-00-1042).
Evaluation of Inactivation Effectiveness
The biological indicators of B. atrophaeus were incubated at 37°C in Soybean Casein Digest Medium (Red Releasat, RM/100, MesaLabs, Lakewood, CA, USA) and of G. stearothermophilus were incubated at 56°C in Soybean Casein Digest Medium (Purple Releasat, PM/100, MesaLabs, Lakewood, CA, USA). All biological indicators were incubated for 7 days.
The reduction of enzyme activity was analyzed by a luminometer (Model PR2A, Protak Scientific, Red Hill Surrey, UK) per manufacturer’s instructions. The luminometer data were analyzed using Protak’s Athena Software.
Graphing and statistical software used for data analysis was GraphPad Prism 8 (Graphpad Software Inc, La Jolla, CA, USA). The graphs are presented using a median with interquartile range because of the variability in environmental conditions during the decontamination process.
Results
Biological indicators and enzyme indicators were placed side by side in 11 locations throughout the decontamination room, including the corners in high and low positions and underneath or behind the animal cages, as shown in Figure 1. The purpose was to simulate the decontamination scenario that is typical to formaldehyde gas decontamination of animal cages. A typical formaldehyde decontamination cycle for this room is 2:30 hours of formaldehyde injection, overnight contact time (≥12 hours), followed by neutralization of formaldehyde of 2:30 hours and finally ventilation of the room for a minimum of 2 hours before biological indicators are extracted by staff wearing protective equipment.
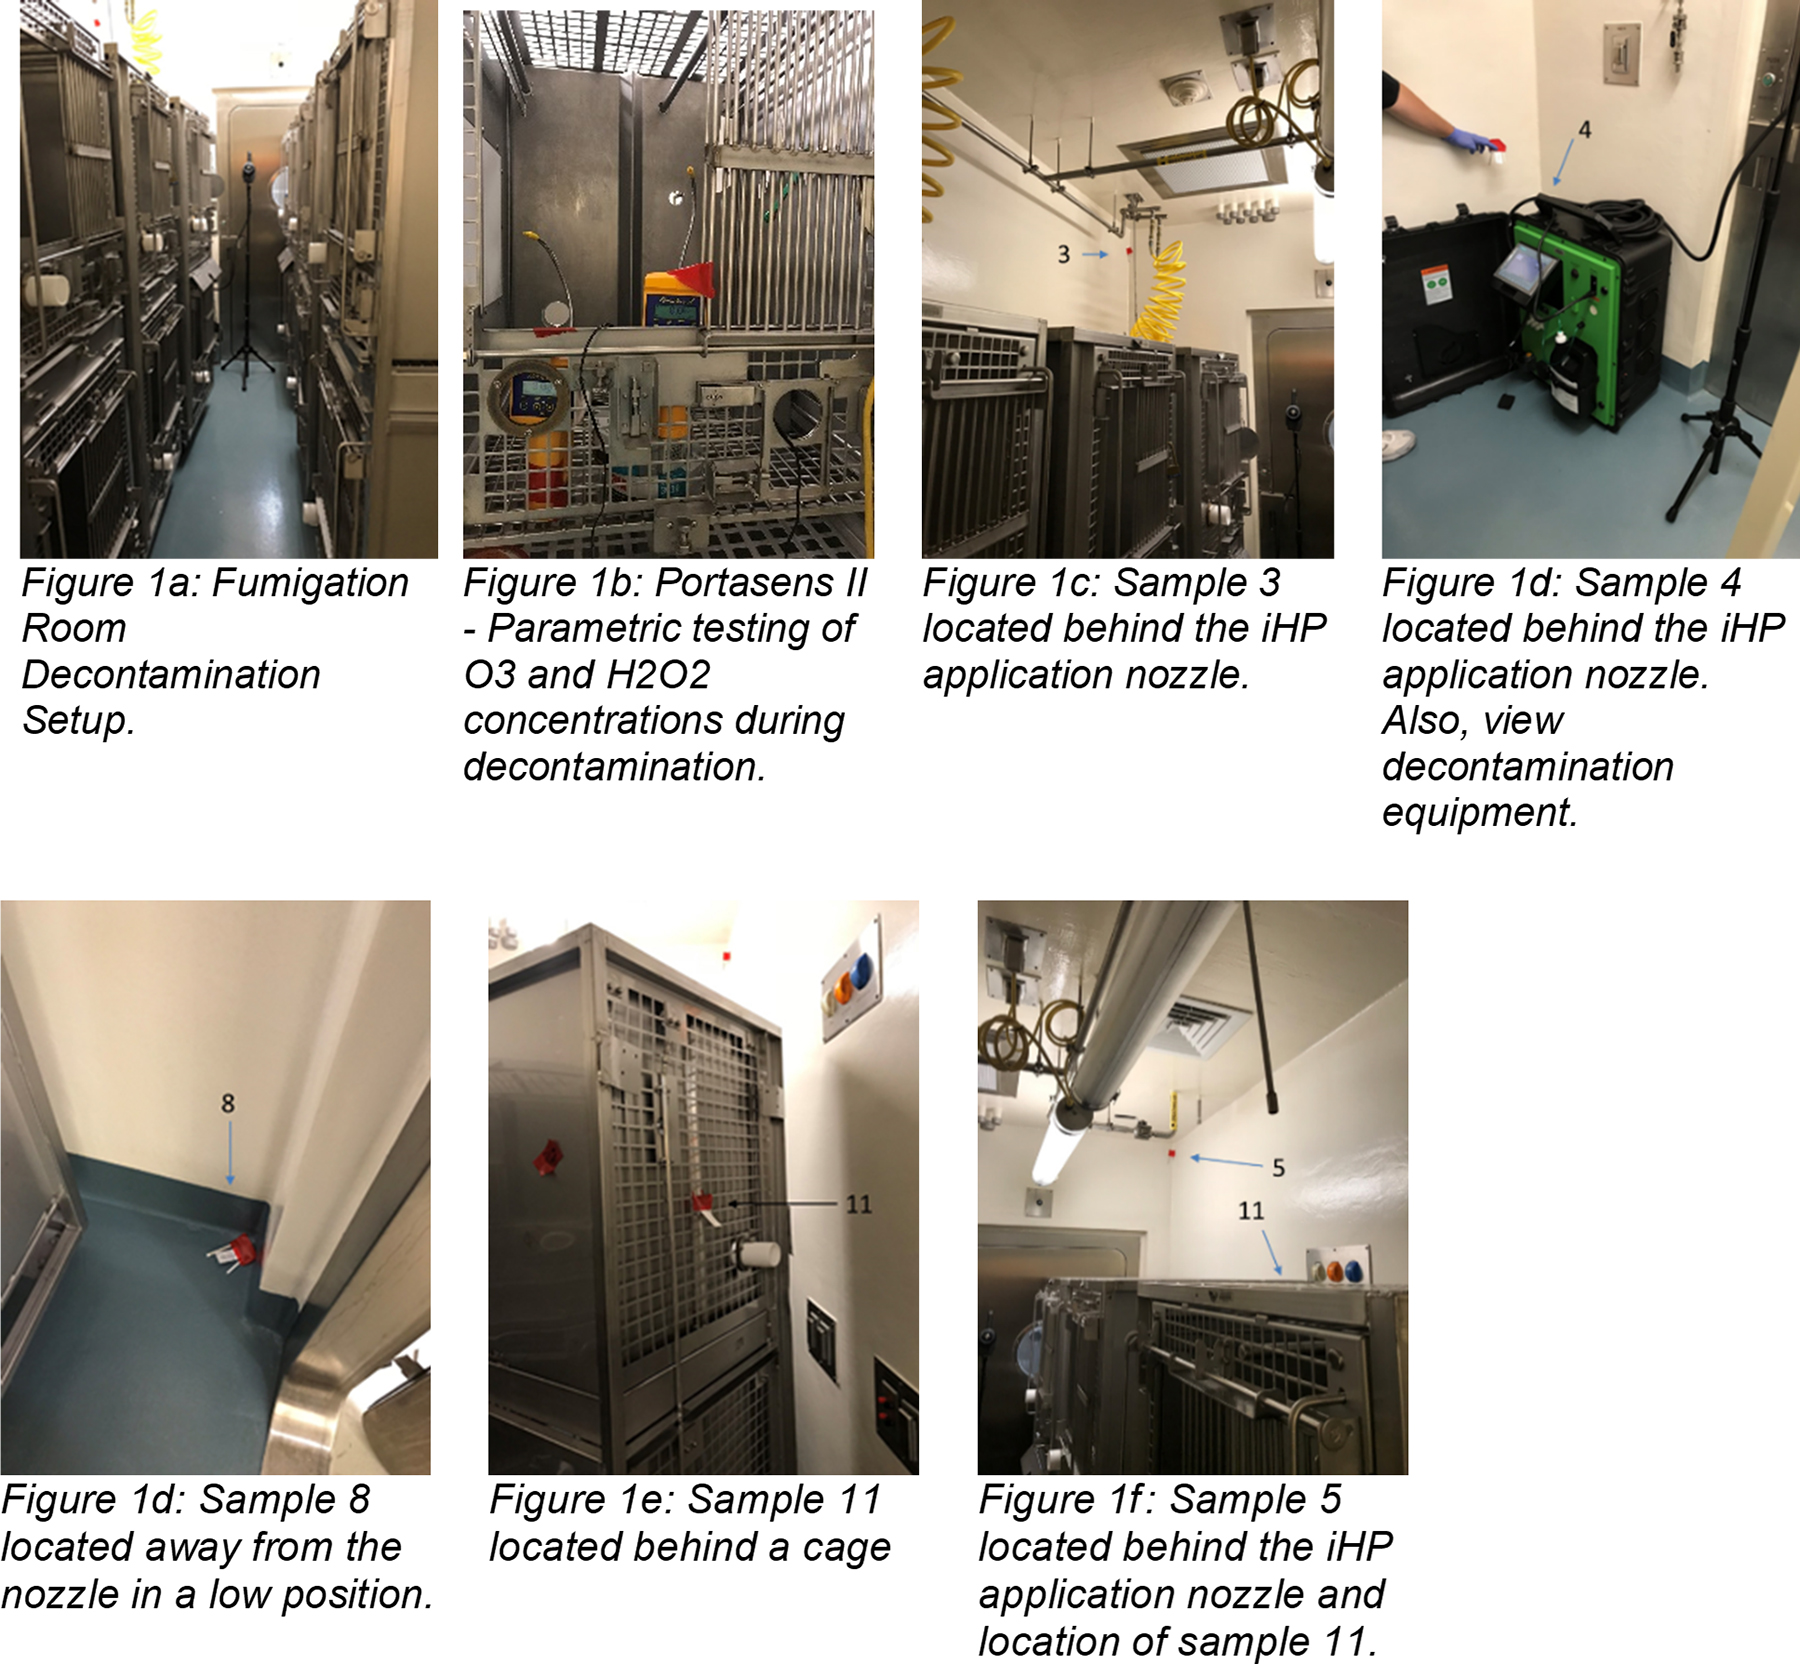
(a) Fumigation room decontamination setup. (b) Portasens II – Parametric testing of O3 and H2O2 concentrations during decontamination. (c) Sample 3 located behind the ionized hydrogen peroxide (iHP) application nozzle. (d) Sample 4 located behind the iHP application nozzle. Also view decontamination equipment. Sample 8 located away from the nozzle in a low position. (e) Sample 11 located behind a cage. (f) Sample 5 located behind the iHP application nozzle and location of sample 11.
The environmental conditions during the decontamination trials were in average temperatures from 22.3°C to 23.9°C and humidity from 57.2% to 72.7%. The observed hydrogen peroxide readings during the decontamination of the room were from 53.3 ppm to a maximum of 111.1 ppm, and the Portasens II ozone sensor reached its detection limit of 6.01 ppm in 2 minutes into the injection of the iHP.
Biological Indicators Results
Biological indicator results for the 4 different contact times of ionized hydrogen peroxide (iHP decontamination are described as follows.
For the 1-hour iHP decontamination contact time (Table 1), the biological indicators of B.atrophaeus resulted in an inactivation of 31 out of 33 samples for a 94% inactivation rate, the G. stearothermophilus in stainless steel (SS) disks resulted in an inactivation of 18 out of 22 for an 82% inactivation rate, and the G. stearothermophilus samples in SS strips resulted in an inactivation of 29 out of 33 samples for a 88% inactivation rate.
Evaluation of Inactivation Effectiveness After 1-Hour iHP Exposure.a
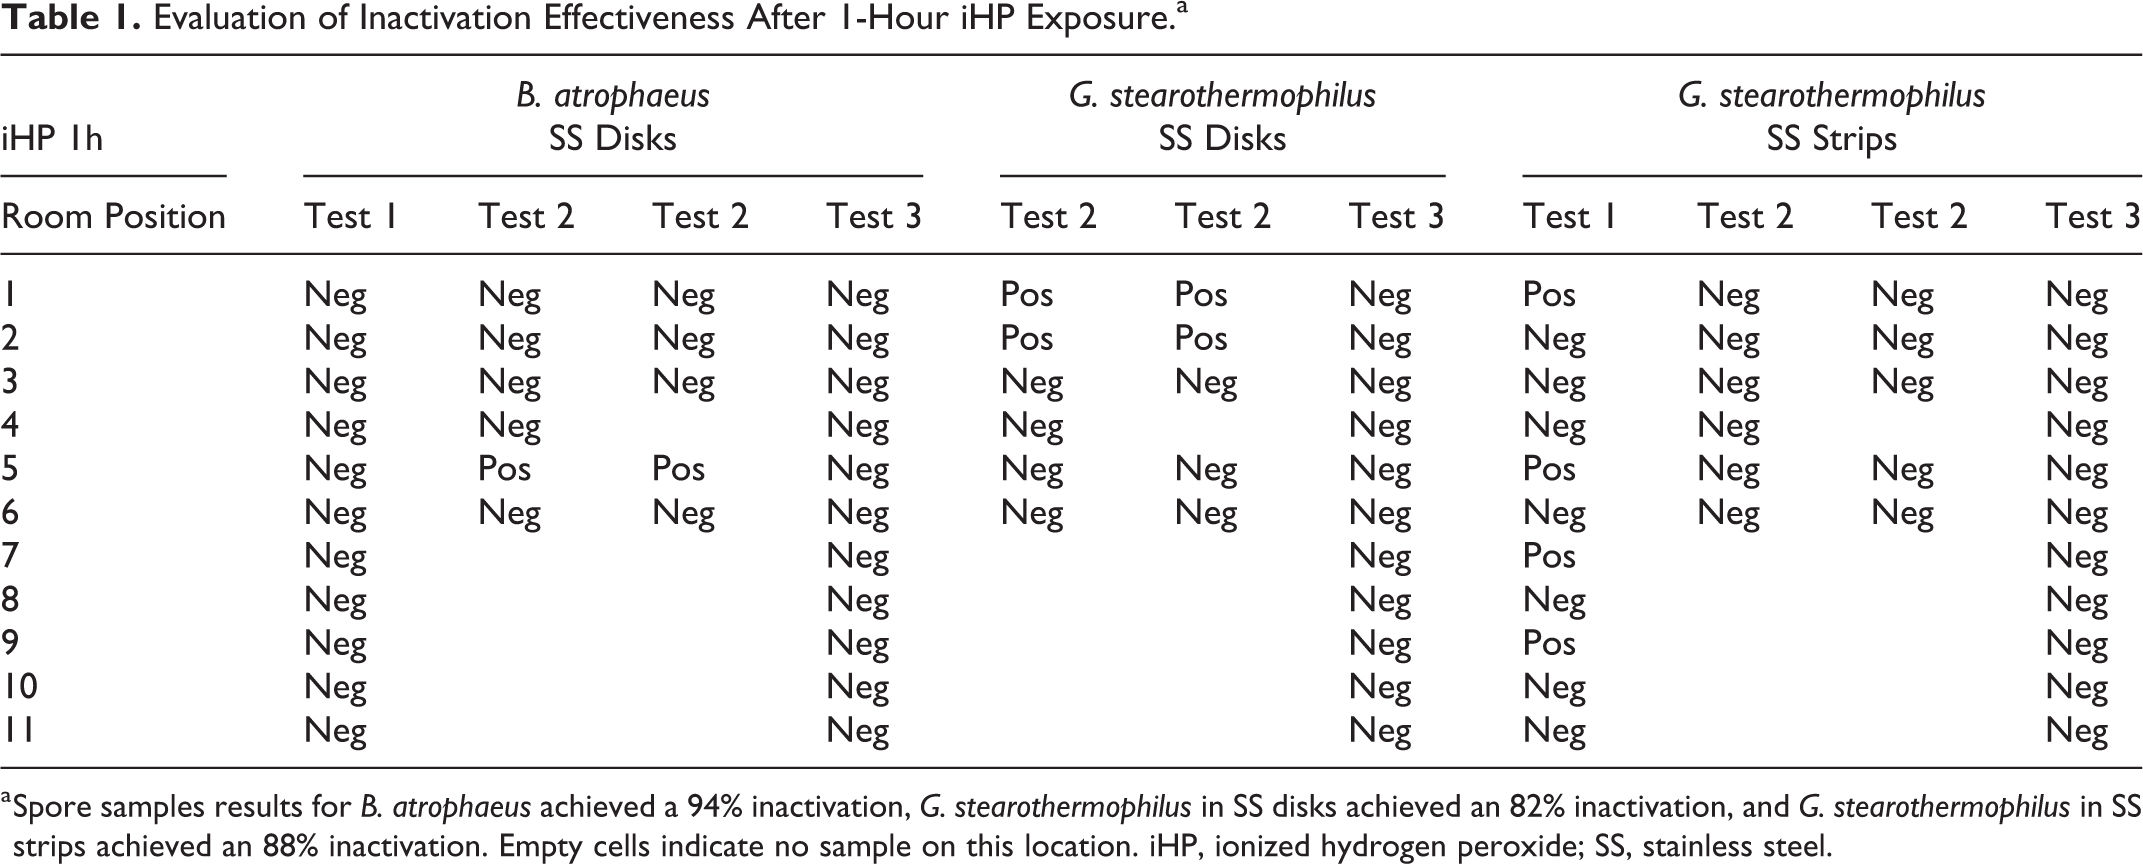
a Spore samples results for B. atrophaeus achieved a 94% inactivation, G. stearothermophilus in SS disks achieved an 82% inactivation, and G. stearothermophilus in SS strips achieved an 88% inactivation. Empty cells indicate no sample on this location. iHP, ionized hydrogen peroxide; SS, stainless steel.
For the 2-hour iHP decontamination contact time (Table 2), the biological indicators of B.atrophaeus resulted in an inactivation of 32 out of 33 samples for a 97% inactivation rate, the G. stearothermophilus in SS disks resulted in an inactivation of 15 out of 22 for a 68% inactivation rate, and the G. stearothermophilus samples in SS strips resulted in an inactivation of 22 out of 33 samples for a 67% inactivation rate.
Evaluation of Inactivation Effectiveness After 2-Hour iHP Exposure.a
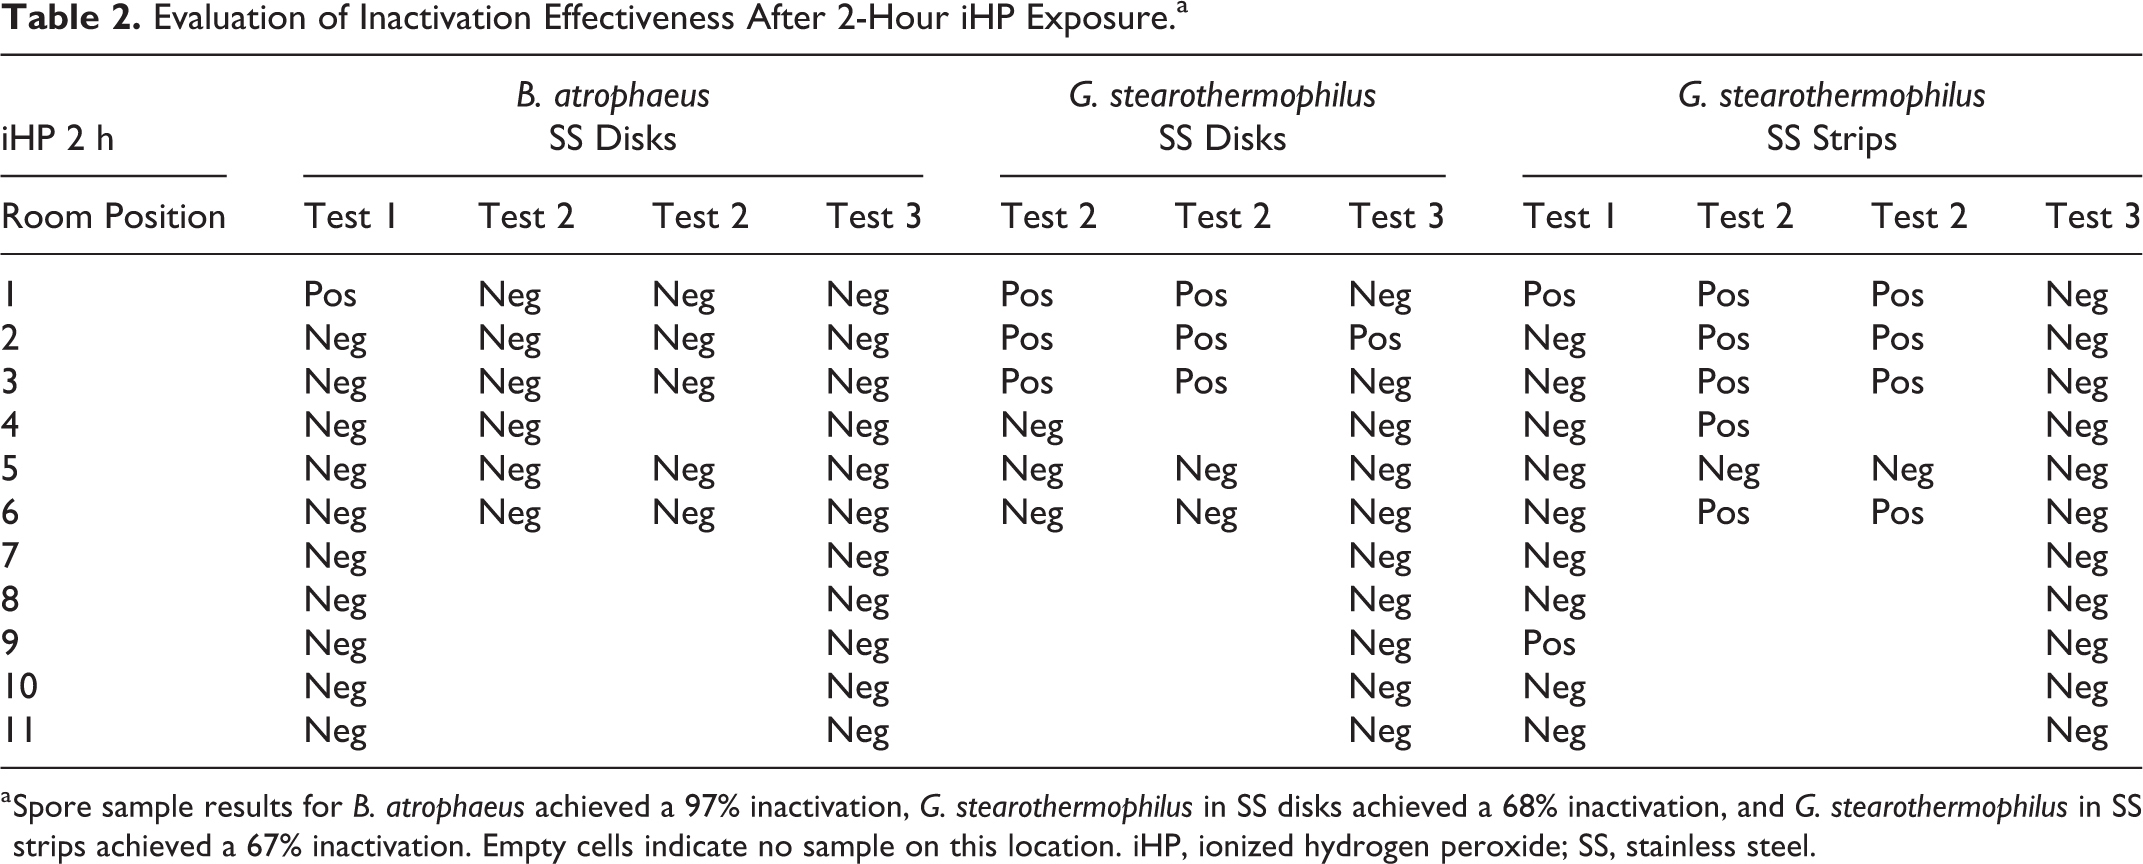
a Spore sample results for B. atrophaeus achieved a 97% inactivation, G. stearothermophilus in SS disks achieved a 68% inactivation, and G. stearothermophilus in SS strips achieved a 67% inactivation. Empty cells indicate no sample on this location. iHP, ionized hydrogen peroxide; SS, stainless steel.
For the 6-hour iHP decontamination contact time (Table 3), the biological indicators of B.atrophaeus resulted in an inactivation of 44 out of 44 samples for a 100% inactivation rate, the G. stearothermophilus in SS disks resulted in an inactivation of 44 out of 44 for a 100% inactivation rate, and the G. stearothermophilus samples in SS strips resulted in an inactivation of 20 out of 22 samples for a 91% inactivation rate.
Evaluation of Inactivation Effectiveness After 6-Hour iHP Exposure.a
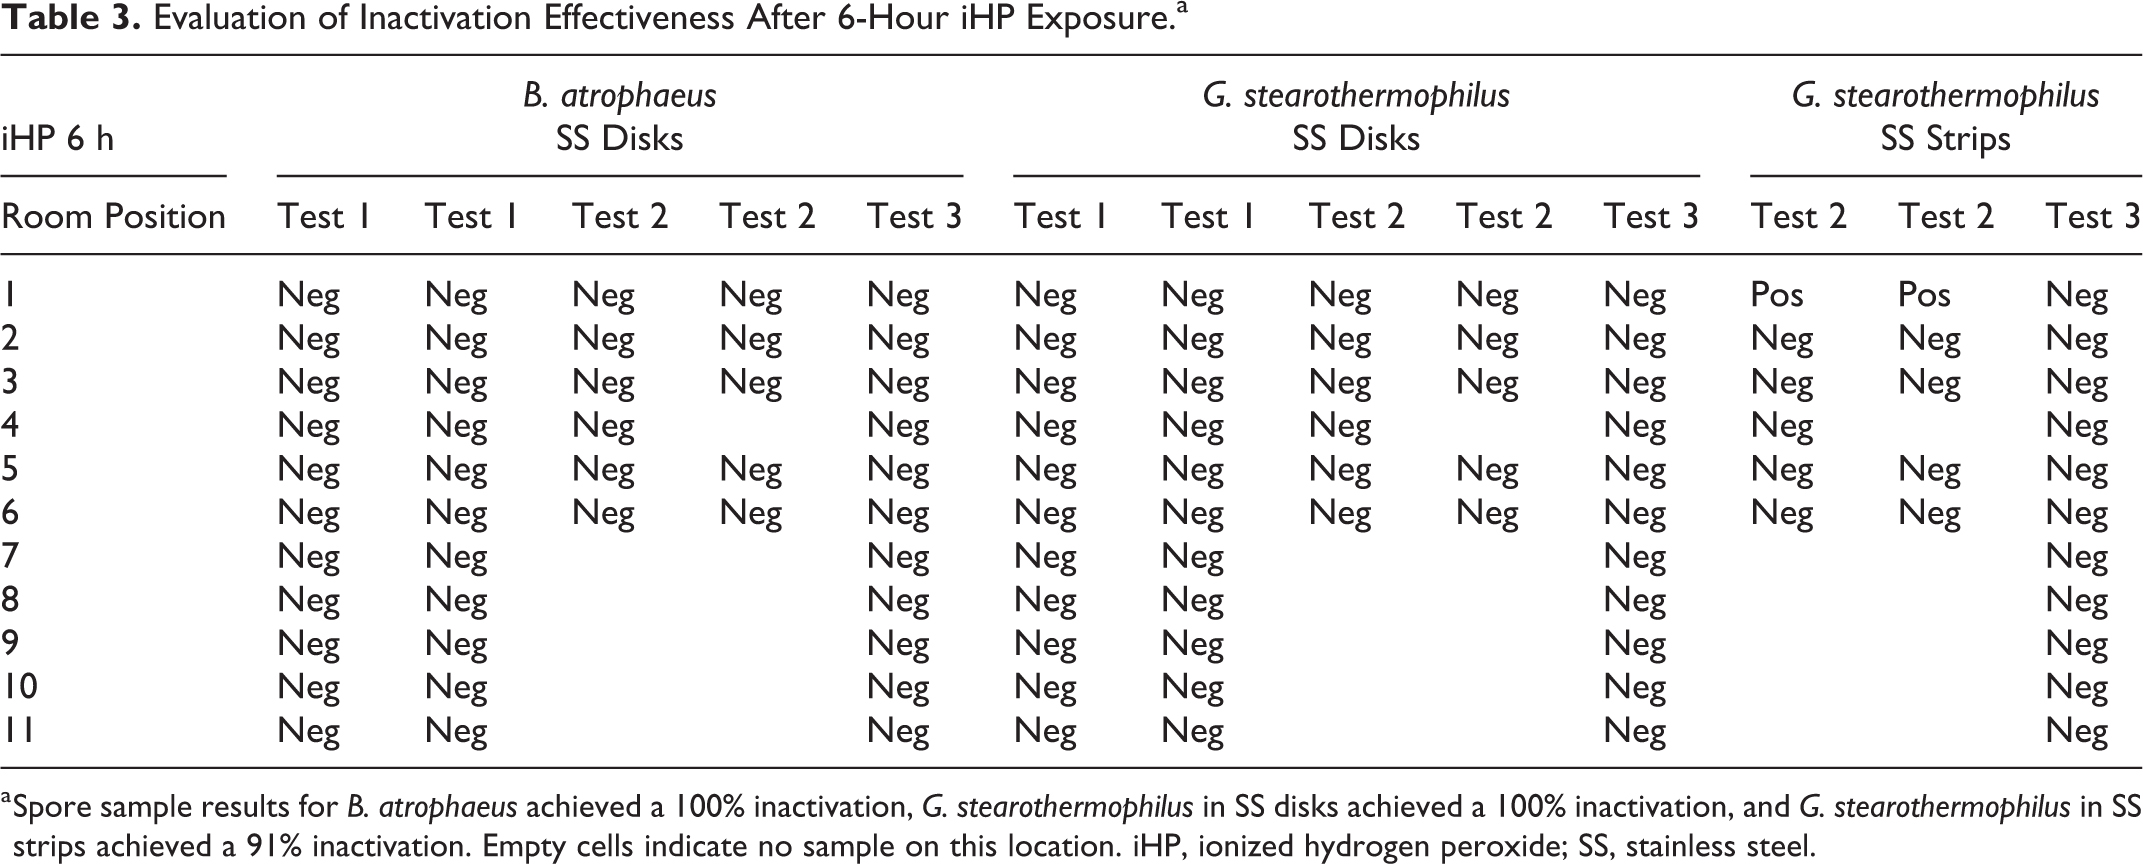
a Spore sample results for B. atrophaeus achieved a 100% inactivation, G. stearothermophilus in SS disks achieved a 100% inactivation, and G. stearothermophilus in SS strips achieved a 91% inactivation. Empty cells indicate no sample on this location. iHP, ionized hydrogen peroxide; SS, stainless steel.
For the 12-hour iHP decontamination contact time (Table 4), the biological indicators of B.atrophaeus resulted in an inactivation of 44 out of 44 samples for a 100% inactivation rate, the G. stearothermophilus in SS disks resulted in an inactivation of 44 out of 44 for a 100% inactivation rate, and the G. stearothermophilus samples in SS strips resulted in an inactivation of 22 out of 22 samples for a 100% inactivation rate.
Evaluation of Inactivation Effectiveness After 12-Hour iHP Exposure.a

a Spore sample results for B. atrophaeus achieved a 100% inactivation, G. stearothermophilus in SS disks achieved a 100% inactivation, and G. stearothermophilus in SS strips achieved a 100% inactivation. Empty cells indicate no sample on this location. iHP, ionized hydrogen peroxide; SS, stainless steel.
For all decontamination trials, a comparison graph of pass rate percentage per spore type and contact time is shown in Figure 2.
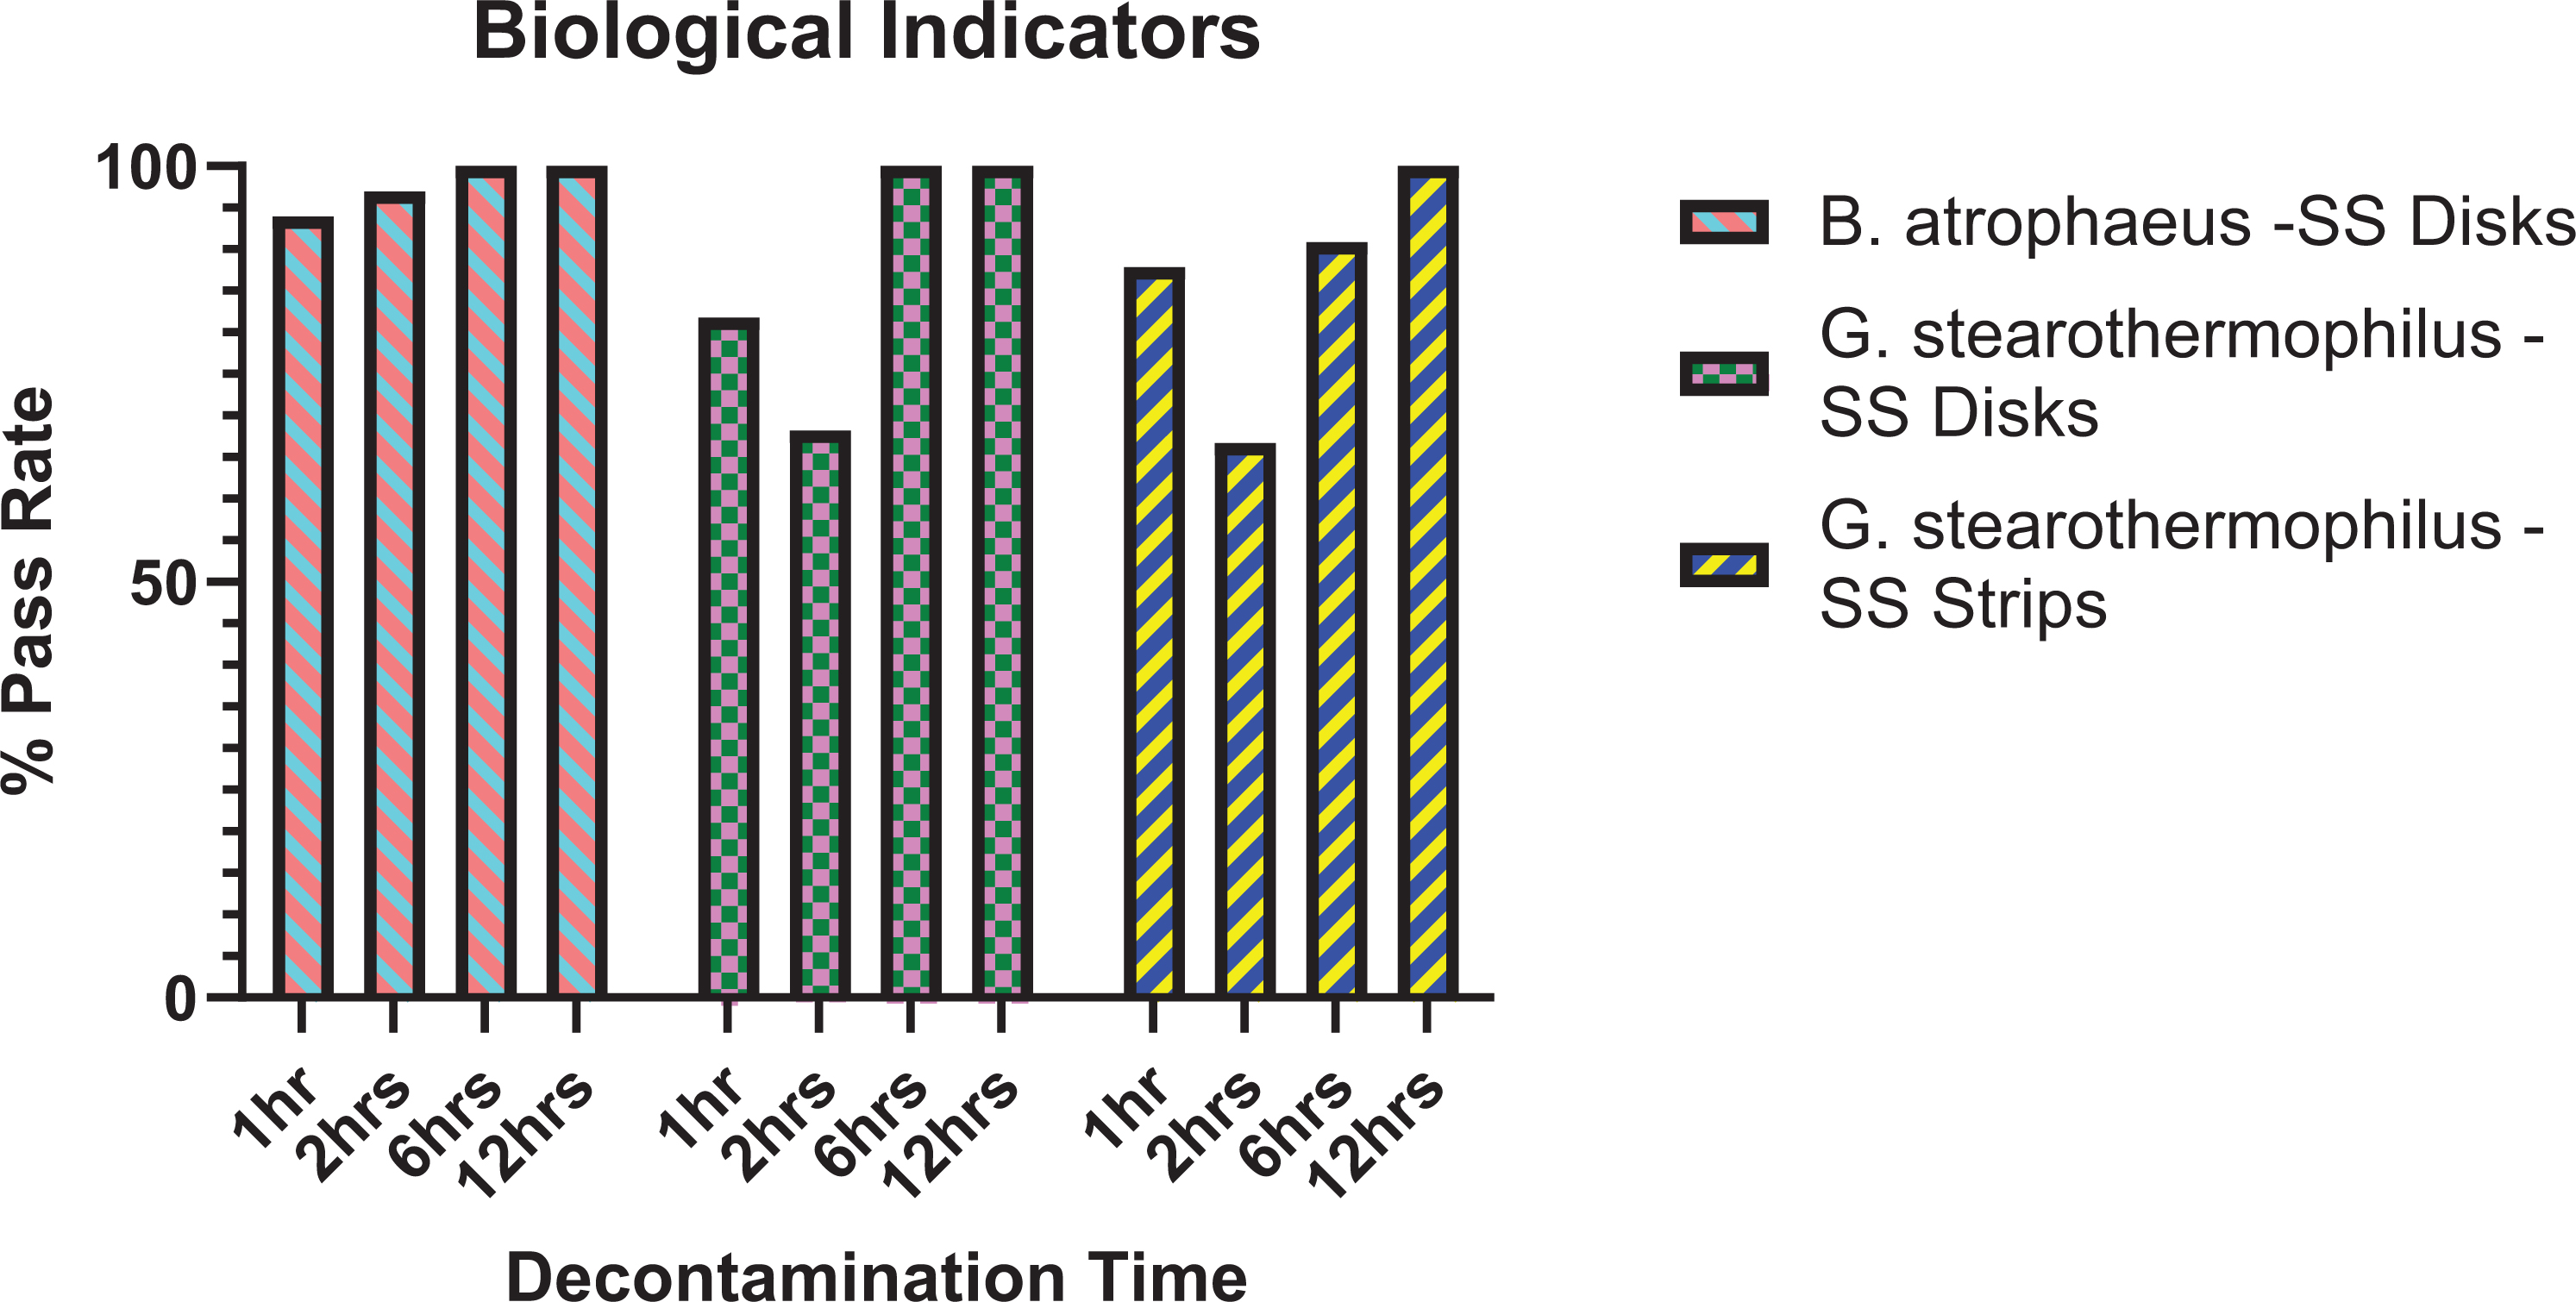
Percentage pass rate of biological indicators per decontamination trial.
Enzyme Indicators Results
The luminometer reading of the production of fluorescent ATP from the residual enzyme activity in relative light units (RLU) for both positive and negative controls as well as the 11 samples in the room is shown in Figure 3. The measure of residual enzyme activity indicated that as the contact time of iHP decontamination increased, an increase in inactivation of enzyme activity was observed in parallel.
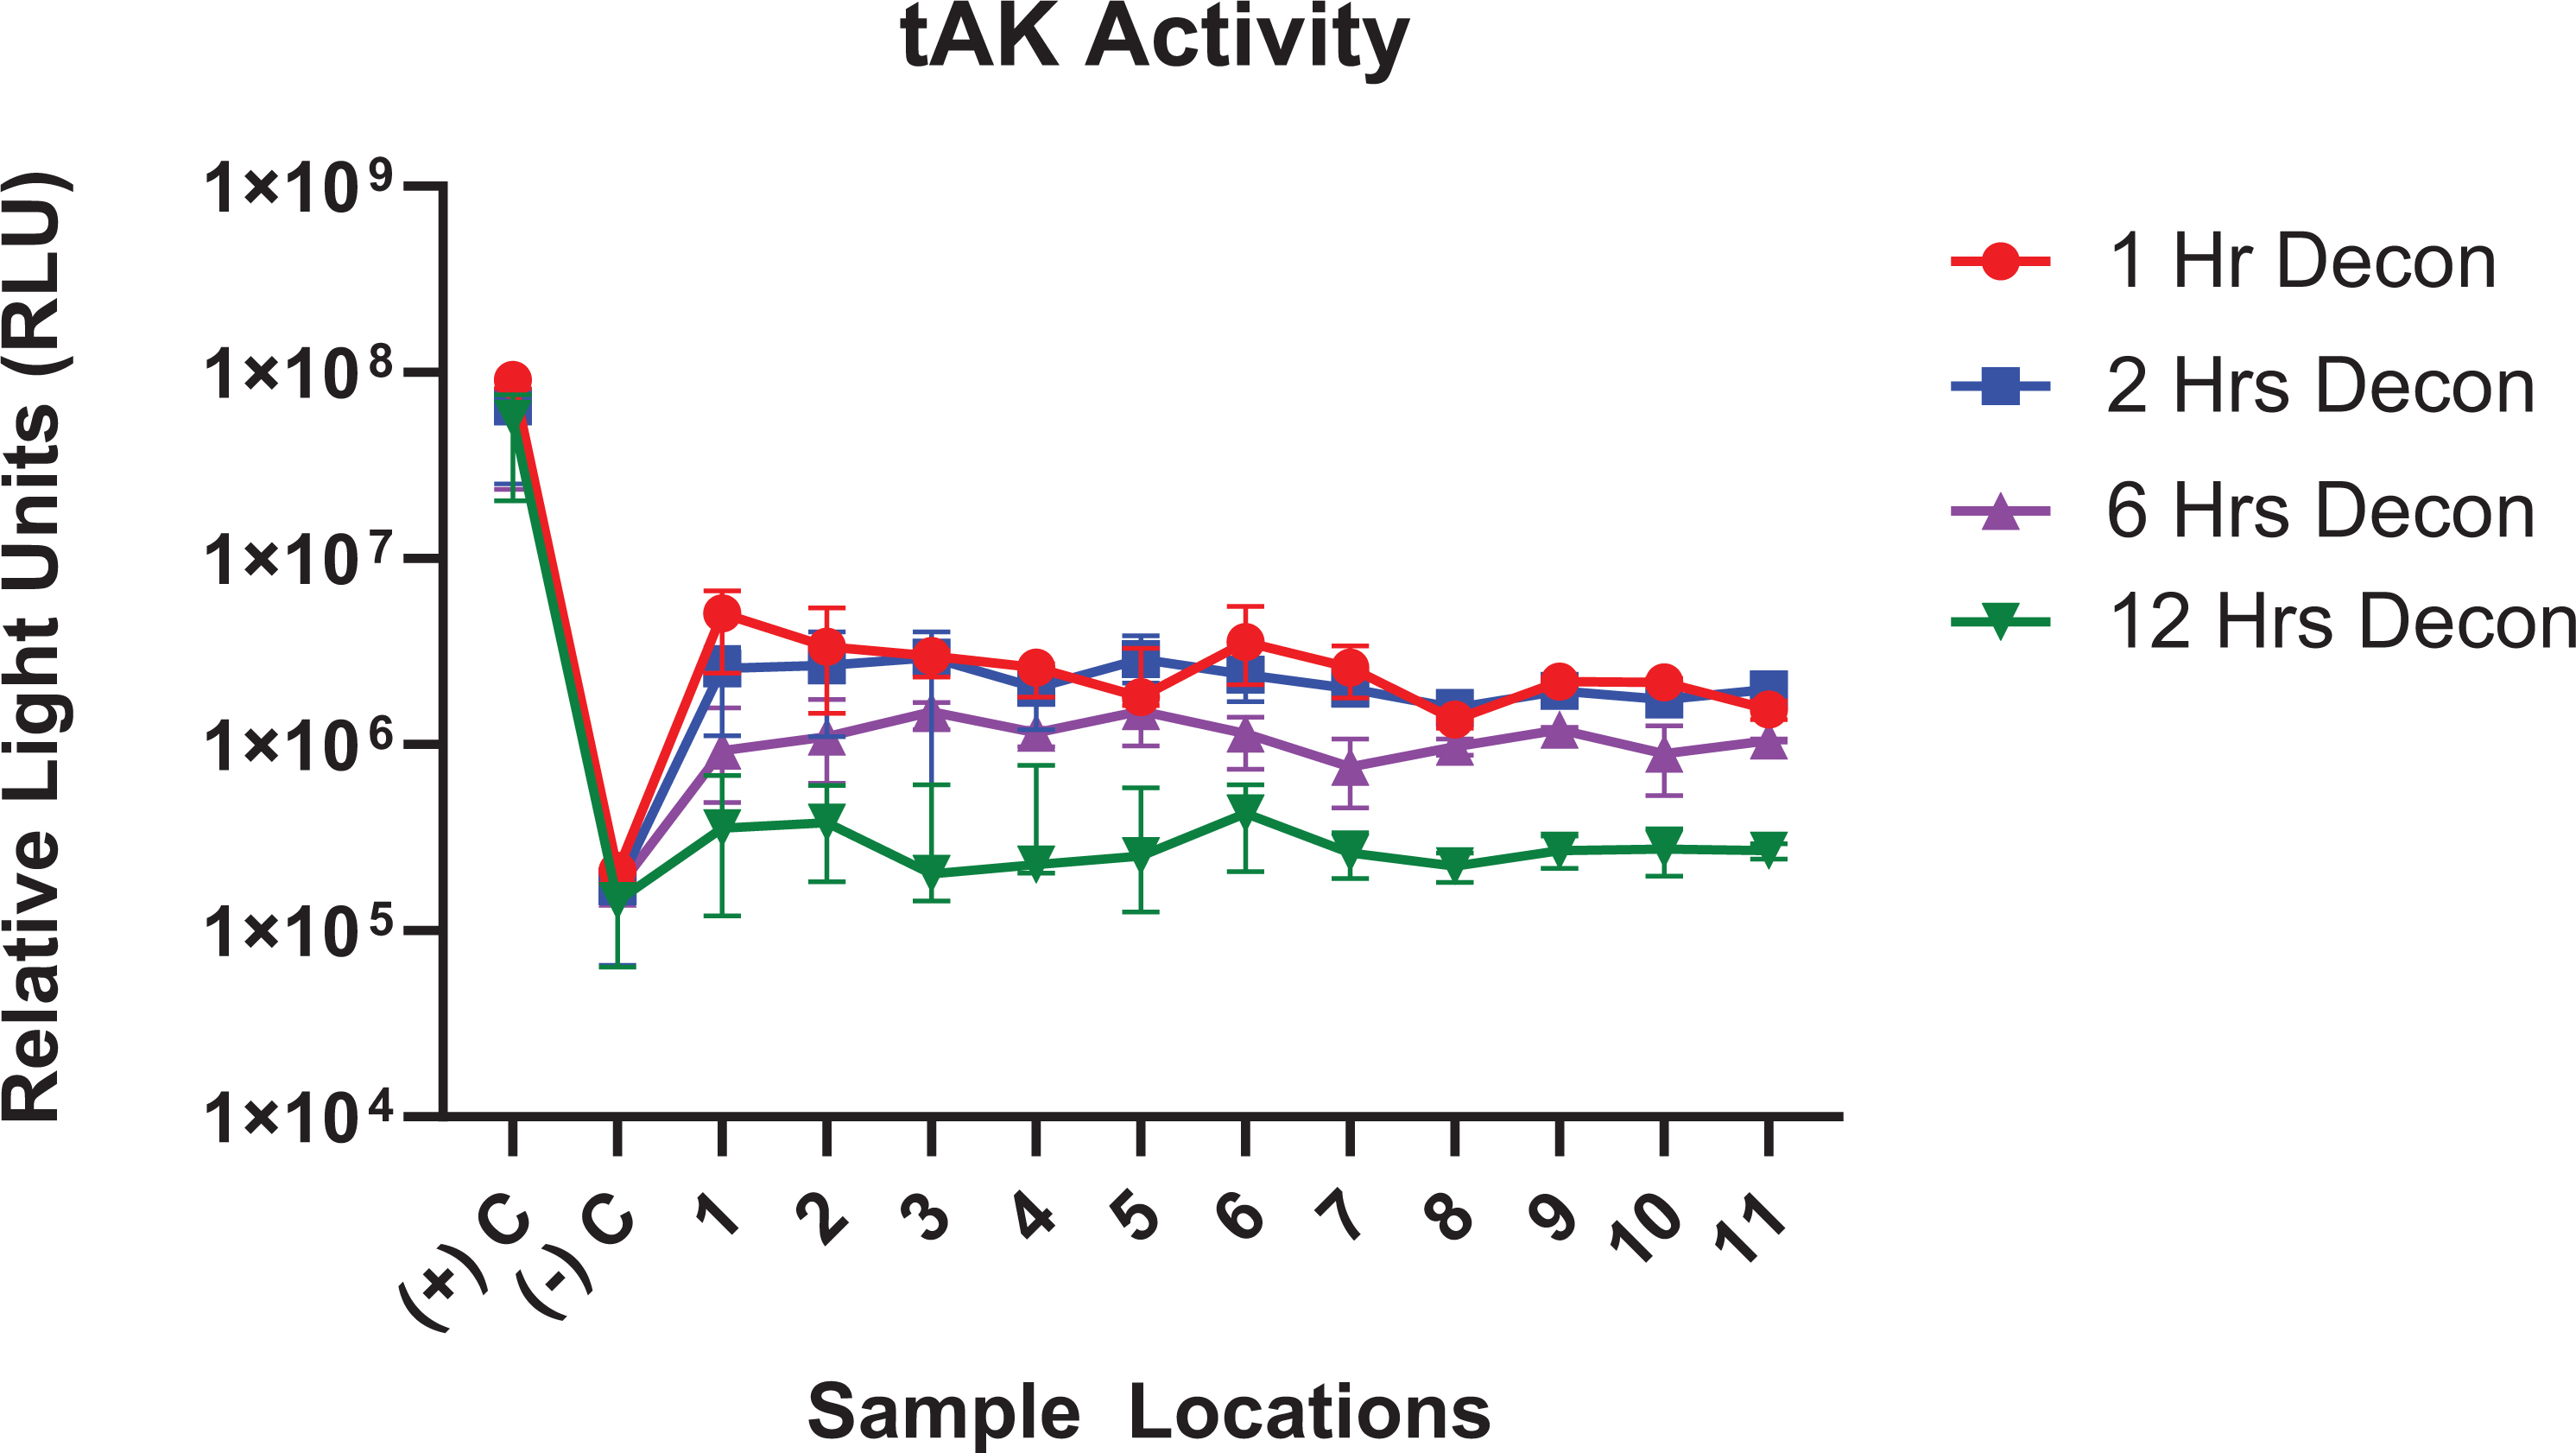
Remaining fluorescence thermostable adenylate kinase activity after the decontamination process. Data are presented as the median with interquartile range.
In addition to the review of the RLU inactivation, data were also analyzed comparing the positive control for each decontamination trial (N0) versus each sample (N) in the trial. The resulting calculation of N divided by N0 provided us with the relative inactivation of the enzyme compared to its control. The data results for each decontamination trial (1 hour, 2 hours, 6 hours, and 12 hours) are graphed in Figure 4.
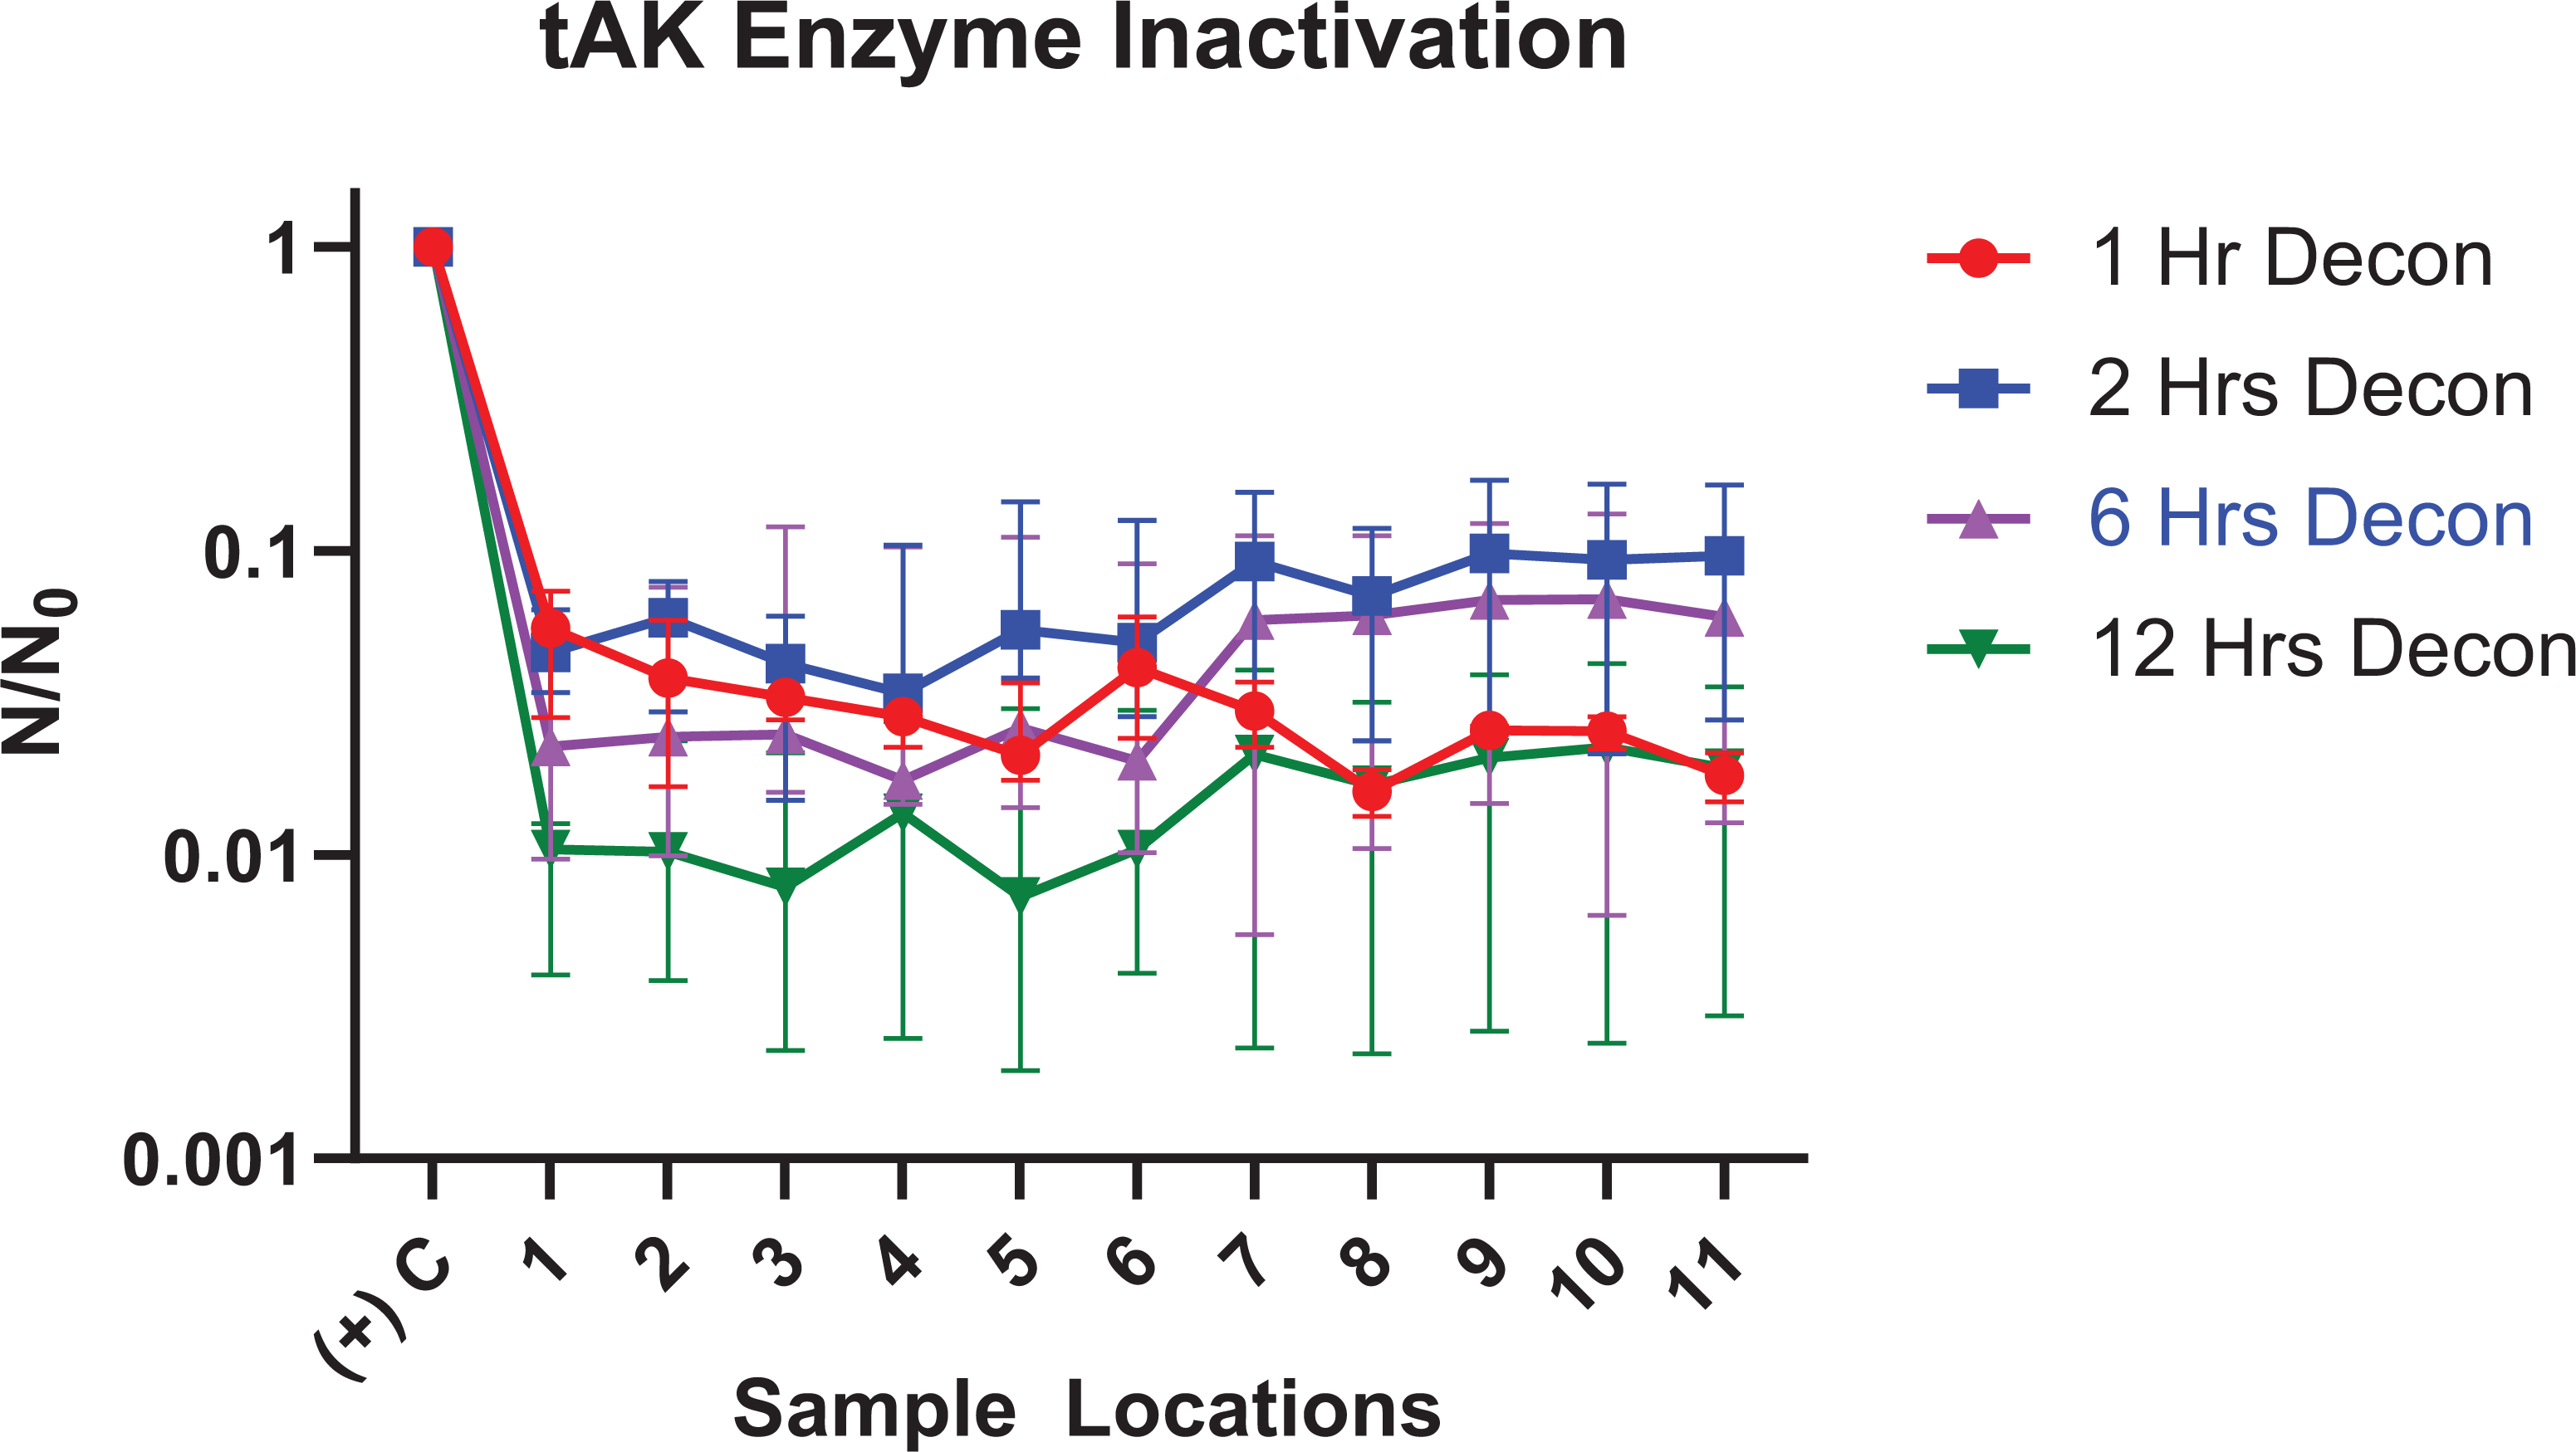
Thermostable adenylate kinase (tAK) inactivation (N / N0) after decontamination trials of 1 hour, 2 hours, 6 hours, and 12 hours. Data are presented as the median with interquartile range.
Discussion and Conclusion
To determine the quantitative measurements of the effects of the iHP decontamination process, we used both biological spore and enzyme indicators. Previous studies have demonstrated that spore and enzyme indicators have similar inactivation profiles. 12 Therefore, it was possible to use the enzyme indicators as a means to measure the inactivation of the luciferase/luciferin reaction of the enzyme in RLU providing us with a standardized reading in the room.
For the decontamination of 1 hour, 2 hours, 6 hours, and 12 hours, the biological indicators of B. atrophaeus in SS disk and Tyvek envelope had a rate of inactivation of 94%, 97%, 100%, and 100%, respectively. For G. stearothermophilus in SS disk and Tyvek envelope, it had an inactivation rate of 82%, 68%, 100%, and 100%, respectively, and for G. stearothermophilus in SS strips, it had an inactivation rate of 88%, 67%, 91%, and 100% (see Figure 2). We prefer to use biological or enzyme indicators that are inoculated on nonporous surfaces like stainless steel disks because paper base indicators have the potential for false-negative results that may limit the evaluation of a proper decontamination cycle to be achieved. 13
Studies using Bacillus subtilis spores with decontamination using formaldehyde gas and vaporized hydrogen peroxide have found that small, acid-soluble proteins protect the DNA from damage during decontamination and plays a role in the resistance of the spores. 14,15 This resistant capability could explain in part the repair or survival of spores if they are not completely damaged during the decontamination.
In a similar inactivation, in a study using formaldehyde gas, exposure of spores to 10 hours of contact time, and 1100 ppm of gas, the treatment inactivated ≥50% of spore strips with approximately the same spore count per indicator as to the samples used in our studies. 16
Although Pottage et al 17 did not find a difference between nonenveloped and enveloped biological indicators during their decontamination studies, we observed a difference between nonenveloped and Tyvek-enveloped G. sterothermophilus. However, we think that the variability of biological indicator inactivation in our G. sterothermophilus results could possibly be due to the difference in the d-value of the samples.
Our results from this study also suggest that G. stearothermophilus is more resistant to iHP than B. atrophaeus, which is similar to the findings from several other decontamination studies with hydrogen peroxide. 7,18,19
Traditionally, biological (spores) indicators have been used to validate decontamination processes with the final readout (pass/fail) of these indicators completed after 7 days of incubation. Unfortunately, biological spore indicators do not provide a quantitative way to determine their pass/fail limits. In contrast, enzyme indicators provide a measurement of residual enzyme (tAK) activity, which can be a tool for evaluation of diffusion, penetration, quantification, and 3D mapping of the fumigation process. Enzyme indicators have excellent potential to replace the use of biological indicators. But correlation studies need to be carried out to thoroughly assess the inactivation readout of the enzyme in comparison to the specific biological indicator of use.
In conclusion, our results show that iHP inactivates spores of B. atrophaeus and G. stearothermophilus and that the residual tAK activity indicates a gas-like fumigant diffusion due to the uniformity of the inactivation on different sample locations without the use of oscillating fans and a higher inactivation of the enzyme indicators as the contact time is extended.
Footnotes
Acknowledgments
The authors acknowledge the support provided on this project by Christopher Gibbs and Nicole Mendell from University of Texas Medical Branch.
Ethical Approval Statement
Not applicable to this study.
Statement of Human and Animal Rights
Not applicable to this study.
Statement of Informed Consent
Not applicable to this study.
Declaration of Conflicting Interests
The authors declared no potential conflicts of interest with respect to the research, authorship, and/or publication of this article.
Funding
The authors disclosed receipt of the following financial support for the research, authorship, and/or publication of this article: Authors would like to acknowledge the support of this study by the University of Texas Medical Branch (UTMB), National Institute of Allergy and Infectious Diseases (NIH NIAID), Universidade Federal de Viçosa, and the Coordenação de Aperfeiçoamento de Pessoal de Nível Superior (CAPES).