
Abstract
Introduction:
This effort investigated formaldehyde vapor characteristics under various environmental conditions by the analyses of air samples collected over a time-course. This knowledge will help responders achieve desired formaldehyde exposure parameters for decontamination of affected spaces after a biological contamination incident.
Methods:
Prescribed masses of paraformaldehyde and formalin were sublimated or evaporated, respectively, to generate formaldehyde vapor. Adsorbent cartridges were used to collect air samples from the test chamber at predetermined times. A validated method was used to extract the cartridges and analyze for formaldehyde via liquid chromatography. In addition, material demand for the formaldehyde was evaluated by inclusion of arrays of Plexiglas panels in the test chamber to determine the effect of varied surface areas within the test chamber. Temperature was controlled with a circulating water bath connected to a radiator and fan inside the chamber. Relative humidity was controlled with humidity fixed-point salt solutions and water vapor generated from evaporated water.
Results:
Low temperature trials (approximately 10°C) resulted in decreased formaldehyde air concentrations throughout the 48-hour time-course when compared with formaldehyde concentrations in the ambient temperature trials (approximately 22°C). The addition of clear Plexiglas panels to increase the surface area of the test chamber interior resulted in appreciable decreases of formaldehyde air concentration when compared to an empty test chamber.
Conclusion:
This work has shown that environmental variables and surface-to-volume ratios in the decontaminated space may affect the availability of formaldehyde in the air and, therefore, may affect decontamination effectiveness.
Introduction
The use of formaldehyde (H2CO; CAS No. 50-00-0) vapor as an effective sterilant and decontaminant for indoor enclosures, especially against persistent biological select agents and toxins (BSAT), has been documented for decades. 1 -4 Testing has shown that gas and vapor decontamination technologies are more likely to be affected by variations in temperature and humidity 5 compared to the other forms (eg, liquids, foams). Although there is a voluminous amount of data with respect to decontamination efficacy from H2CO vapor, 6,7 little information is available with respect to the effect of environmental conditions on H2CO air concentrations and corresponding efficacies. To conduct effective, full-scale response or remediation of malicious, accidental, or natural releases of BSAT, data are needed to better understand the effect of environmental conditions on H2CO decontamination efficacy; remediation actions may need to be rendered under less-than-ideal conditions.
To achieve the project goals, reliable methods were required to determine H2CO air concentrations. Some previous efforts have relied on theoretical H2CO air concentrations based on the mass of sublimated paraformaldehyde (PF) or heated (evaporated) formalin. 8 A systematic study to examine H2CO air concentrations, at specified time-points, will provide the data needed to develop H2CO profiles to understand the fate of the vapor over a prolonged duration. Also, controlling as many of the environmental parameters of the test chamber enclosure as possible will contribute to the reliability of the data generated, as well as consistency from trial to trial. These factors combined with the corresponding agent recovery data will give insight into the conditions appropriate to achieve desired decontamination efficacy levels.
A previous effort by Ngabo et al 8 demonstrated that lower H2CO air concentrations (752 parts per million [ppm] theoretical concentration) caused lower decontamination efficacies (less than 6-log reduction) when Bacillus atrophaeus spores inoculated onto nonporous stainless steel material coupons were exposed for 2 hours. When Ngabo et al extended the contact time to 6 hours in the same small test chamber (0.59 m3), a greater than 6-log reduction was achieved, but the confirmatory liquid broth assessments resulted in positive cultures, thereby showing that the B atrophaeus remained viable. Higher H2CO air concentrations (ie, higher formalin volumes; greater than or equal to 1521 ppm theoretical concentration) resulted in greater than or equal to 6-log reduction of B atrophaeus with negative growth in the liquid broth at relatively short exposure times (30 minutes, 1 hour). Beswick et al 9 demonstrated log reductions between 2.27 and 5.55 of Geobacillus stearothermophilus spores inoculated onto stainless steel discs after a 3-hour exposure of 600 ppm H2CO vapor (theoretically calculated; not actually measured) generated from formalin in a relatively large enclosure (35 m3). When H2CO vapor was generated in a larger enclosure (150 m3), a much higher H2CO concentration was used (1400 ppm theoretical concentration), and complete inactivation was achieved within the detectable limit (6-log reduction). 9 Taylor et al 10 described heating (ie, depolymerization) PF to generate a contaminant-free, dry H2CO gas, whereas the H2CO gas generated from formalin may have included methanol and formic acid. Rogers et al 7 described the effect when the vapor phase equilibrium of H2CO was exceeded inside a test chamber. Specifically, less H2CO is available in the air, so the concentration of H2CO remained below the vapor phase equilibrium to prevent condensation onto the surfaces inside of the test chamber. Ackland et al 11 determined that the H2CO vapor phase equilibrium was 1628 ppm (20°C-21°C testing temperature). When the vapor phase equilibrium is exceeded, H2CO condensation and subsequent deposition may occur on surfaces inside the test chamber, thereby reducing the H2CO vapor in the air. Formaldehyde deposition onto surfaces within a fumigated space has an unknown effect on decontamination efficacy against contaminants residing on those surfaces.
The purpose of the current study was to understand H2CO vapor profiles under different environmental conditions and their effect on decontamination efficacy against dried, surface-bound Bacillus spores. The results of this effort may be used to reduce the cost and time required to recover after biological contamination incidents by enhancing our understanding of method performance outside ideal conditions and potentially expanding the options for effective decontamination. Many studies have been conducted to assess the effectiveness of H2CO vapor as a decontaminant, but some questions remain about the influence of the environment on H2CO vapor and the consequences of H2CO vapor adsorption or absorption (ie, sorption) on the available surfaces that undergo decontamination. A better understanding of this fumigant is necessary for prescription of real-world decontamination approaches.
Materials and Methods
Test Organisms
Bacillus anthracis Ames spores (referred to hereafter as B.a.) were prepared by fermentation as previously described. 12 Lyophilized Bacillus atrophaeus (ATCC 9372; formerly B subtilis var. niger or B globigii) spores (referred to hereafter as B.g.) were prepared in sterile phosphate-buffered saline (HyClone Cat. No. SH30256.01) containing 0.1% Triton X-100 (Sigma Cat. No. T8787) surfactant (PBST). Bacillus thuringiensis var. kurstaki (DiPel, Tech Grade, strain ABTS-351) spores (referred to hereafter as B.t.) were prepared in sterile PBST. All 3 preparations were diluted to approximately 1 × 10⁹ colony-forming units (CFU)/mL in sterile-filtered water and stored at 5°C ± 3°C.
Test Materials
Two types of indoor surface were used for testing: cinder block concrete (Wellnitz Concrete Products) painted with water-based epoxy paint (Sherwin Williams Product Code K46W1151) and bare pine wood (wood; Lowe’s Home Improvement, general molding). Test material coupons (1.9 × 7.5 cm) were cut from larger pieces of stock material. Visual inspection of the physical integrity of the coupons was performed before and after testing to assess any damage or change to the coupons postexposure to H2CO vapor. The 2 material types were selected as surrogates for common indoor surface types, one porous (wood) and one nonporous (painted concrete), both of which may be challenging to decontaminate.
Sample Processing and Data Collection
Testing that involved only the B.t. and B.g. (ie, surrogates) was done under Biosafety Level (BSL)–2 conditions. All aspects of B.a. testing were performed under BSL-3 conditions, including whenever the virulent and surrogate strains of each organism were tested side-by-side. Coupons were laid flat in a Class II Biological Safety Cabinet (BSC) and inoculated with approximately 1 × 10⁸ CFU per coupon. A 100-µL aliquot of the test organism (approximately 1 × 10⁹ CFU/mL) was dispensed as 10 droplets (10 µL per droplet) across the surface of the test coupons. For each material type, 5 coupons were used at each of the 5 time-points (48 hours, 32 hours, 24 hours, 16 hours, and 8 hours H2CO vapor exposure) for Tests 1 to 4 to assess efficacy of the decontamination of the organism at each combination of environmental condition and H2CO vapor concentrations. (For Tests 5 to 8, three coupons were used at each of the same time-points.) Five additional coupons were used as controls (inoculated, exposed to ambient environmental conditions). All material coupons were dried for a minimum of 1 hour in the BSC under ambient conditions (approximately 22°C and 40% relative humidity [RH]) before testing. In addition, 3 coupons of each material were used as blanks (not inoculated) and were included for each time-point tested. The blank coupons served as controls for potential cross-contamination during testing, as well as the sterility state of the coupons.
Inoculated coupons were exposed to either ambient (approximately 22°C) or low temperature (approximately 10°C) and 70% to 75% RH for up to 48 hours as outlined in Table 1. At each of the 5 time-points tested, H2CO decontamination efficacy under different environmental conditions was determined. After inoculation and initial drying period, the coupons were placed into an airtight container (Lock and Lock, HPL838P). The container was placed into a BSC. Elevated RH conditions (70%-75%) were achieved either by adding a container of humidity fixed-point salt solution (ie, saturated salt solution) located at the bottom (ie, floor) of the test chamber (ASTM International, 2012) or by the vaporization of water on the same hot-plate used to generate H2CO vapor. A data-logger (Onset HOBO MX1101) was also placed on the floor of the test chamber and collected both temperature and RH readings every minute for the duration of a specific trial. At the end of the H2CO vapor exposure duration, samples were collected and extracted by placing each coupon in its corresponding conical tube that contained 10 mL PBST. All tubes were agitated on their sides at room temperature on an orbital shaker for 15 minutes at 200 revolutions per minute.
Test Matrix.a
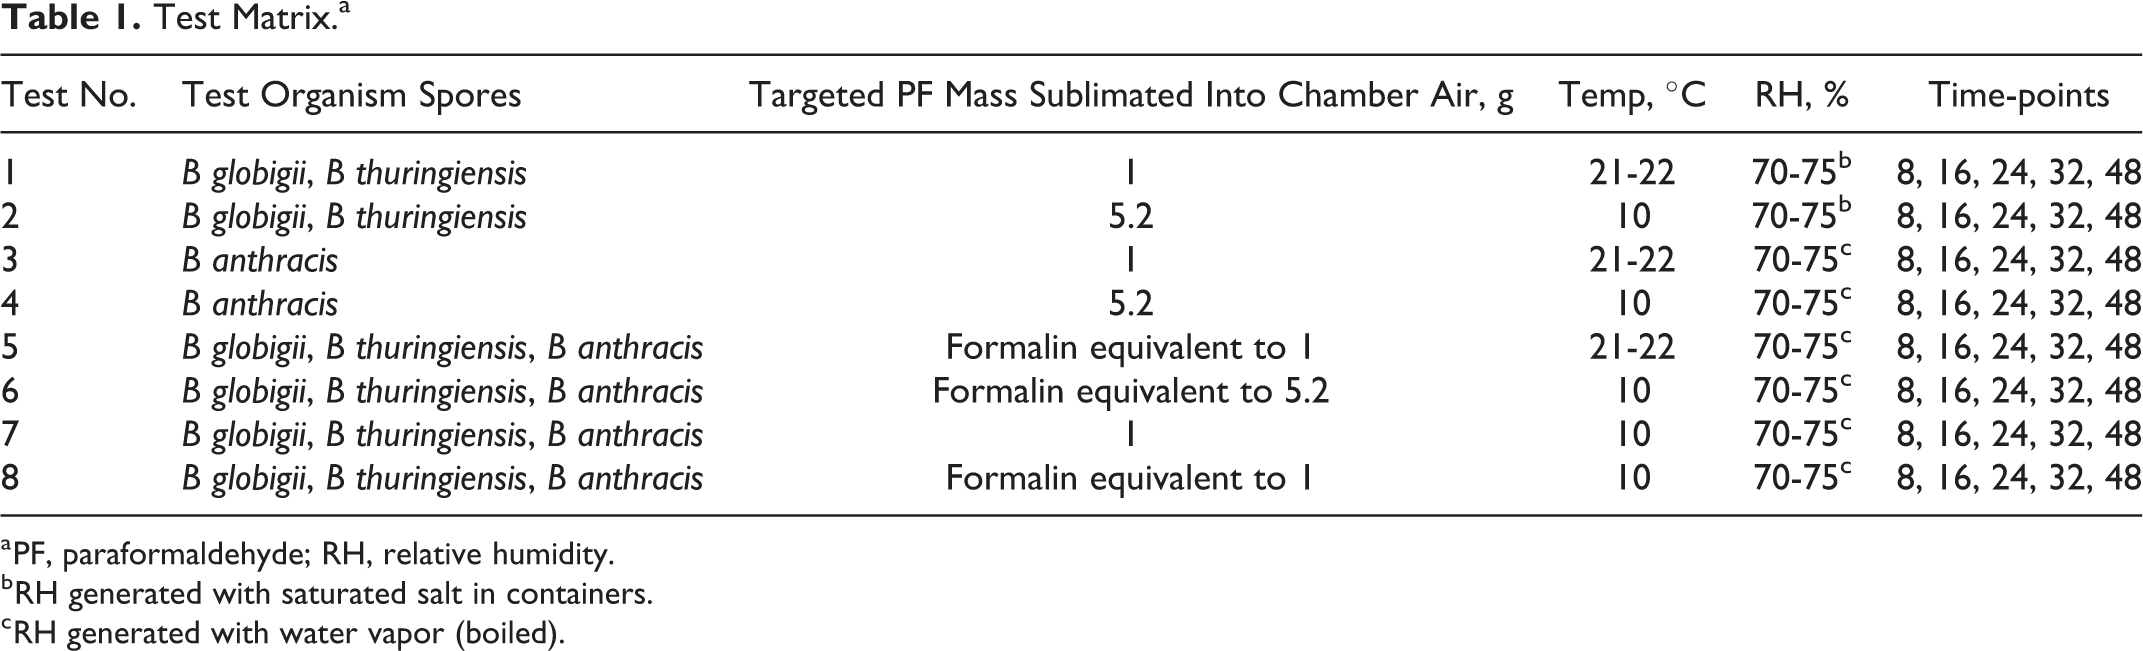
a PF, paraformaldehyde; RH, relative humidity.
b RH generated with saturated salt in containers.
c RH generated with water vapor (boiled).
To assess recovery from coupons inoculated with spores, resulting liquid extracts were removed and a series of 10-fold dilutions was prepared in sterile, cell culture–grade water (Sigma Cat. No. W3500). An aliquot (0.1 mL) of the selected dilutions and, when necessary, the undiluted extracts was plated onto tryptic soy agar (TSA; Hardy Diagnostics Cat. No. G60) in triplicate. The agar plates were incubated at 37°C ± 2°C for 16 to 24 hours. Colonies were observed for colony morphology to ensure physical appearance consistent with inoculated spores and enumerated to determine H2CO vapor decontamination efficacy after exposure.
Efficacy Calculations
Results from the decontamination tests are presented as total recovery from both control and decontaminated coupons and as decontamination efficacy. Recovery of viable test organism is expressed as the base-10 logarithm of total CFU recovered from the 5 control or test coupons for each material type and time-point tested. Efficacy of the decontamination process was determined by subtracting the base-10 logarithm of the number of viable test organisms extracted from the 5 test coupons from the mean of the base-10 logarithm of the control coupons and was expressed as log reduction (LR) using Equation 1:

where CFUc is the number of viable test organisms extracted from the control samples and CFUt is the number of viable test organisms extracted from the test samples. For decontaminated test samples where no viable organisms were detected, the efficacy was calculated as the log of the mean number of viable organisms recovered from the control coupons. Using the calculated LR for each test coupon, the mean (±standard deviation [SD]) log reduction was calculated.
Each of the LR results is reported with an associated 95% confidence interval (CI), calculated using Equation 2:

The term SE is the pooled standard error and was calculated using Equation 3:
where S is the standard deviation of the LR results for either the 5 positive controls (S pc) or the 5 test coupons (S t) for each combination of H2CO vapor concentration, environmental conditions, coupon, and spore tested.
Test Chamber
A 498-L static glovebox (Plas-Labs Model No. 830-ABB) was modified with high-efficiency particulate air (HEPA) filters to allow for the rapid evacuation of H2CO gas from the test chamber via ducts to the laboratory air-scrubbing system (Figure 1). Due to the ability to rapidly evacuate H2CO from the test chamber interior, neutralization of the H2CO with ammonium carbonate (Luftman, 2005) was not needed to reduce H2CO air concentration at the terminus of experimental trials. 25 Therefore, removal of the resulting hexamethylenetetramine residue on all surfaces, a byproduct of the ammonium carbonate neutralization reaction with H2CO, was not required. A heat exchanger-fan unit (Alphacool Model No. 14215) was mounted and operated inside the test chamber for efficient air mixing and heat exchange. A circulating water-bath (Thermo Scientific Model No. NESLAB RTE7), filled with automotive anti-freeze solution, was used to achieve low air temperature conditions when prescribed. The test chamber was leak-tested before each trial. A data logger (Onset Cat. No. HOBO MX1101) was placed in the sealed test chamber and collected both temperature and RH measurements every minute for the 48-hour duration of testing.
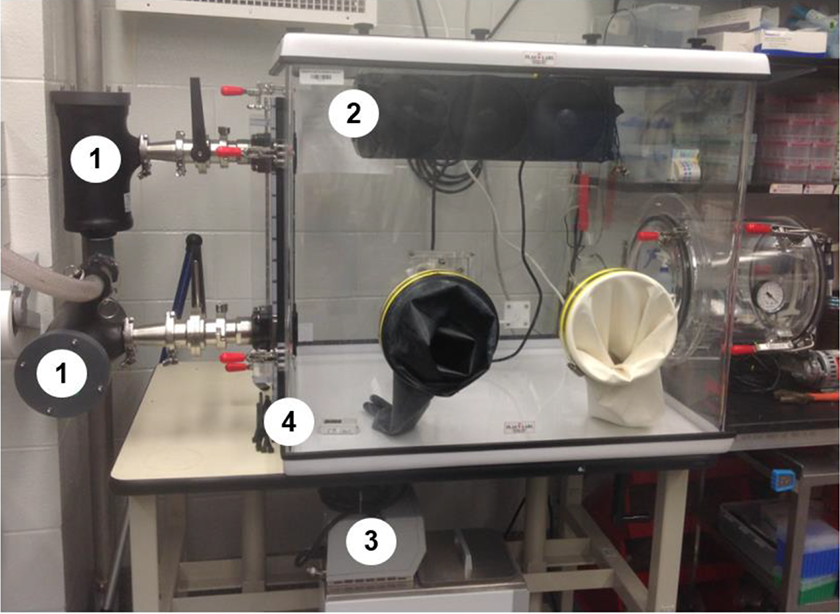
Test chamber configuration. (1) HEPA filters for rapid evacuation of H2CO, (2) heat exchanger-fan unit to circulate air and control test chamber temperature, (3) circulating water-bath to cool test chamber temperature, and (4) HOBO data-logger.
Paraformaldehyde and Formalin
Heating PF solid or prilled achieves depolymerization to produce H2CO vapor. 13 For each PF trial, a prescribed mass of PF solid (ie, prilled, Sigma Cat. No. 441244), which consisted of 95% H2CO, was placed on an aluminum pan (McMaster-Carr Cat. No. 17805T82) and heated to 170°C 11 using a hot-plate (Corning Model No. Scholar 170), to sublimate into vapor. The sublimation process was ≤40 minutes in duration, depending on PF mass. To simulate field-use conditions, the RH inside the test chamber was not adjusted once the hot-plate was heated, consistently resulting in the gradual decrease of RH over time as the temperature increased across the trials with PF. After no visible PF remained in the pan, the first air sample was collected to establish time-point 0-hour H2CO concentration.
For each formalin trial (Table 1), a PF-equivalent mass of formalin (Sigma Cat. No. F1635), which consisted of 37% H2CO (10%-15% methanol, water), was placed in an aluminum pan (McMaster-Carr Cat. No. 17805T82). As per the European standard (BS EN 12469:2000), an equivalent volume of water-to-formalin was added to the pan and mixed. The formalin-water mixture was then evaporated with a hot-plate (170°C) as described by Ackland et al 11 to generate H2CO vapor. After no formalin-water mixture remained in the pan (≤1 hour to achieve complete evaporation), the first air sample was collected to establish time-point 0 hour.
Air Sampling and Extraction Methods to Determine Formaldehyde Concentration
Air samples were collected at 6 time-points for all trials: 0 hour, +16 hours, +24 hours, +32 hours, +40 hours, and +48 hours after H2CO vapor generation. Air samples taken at the time-point 0 hour (immediately after generation) for each trial represented the time-point that the highest H2CO concentration was anticipated. Once collected, the air samples were further processed to remove the captured aldehyde compound from a coated silica bed inside the cartridge. The EPA’s Compendium Method TO-11A 14 was used as an active sampling methodology to determine H2CO air concentrations. Air samples were collected on 2,4-dinitrophenylhydrazine (DNPH)–impregnated silica cartridges (Supelco LpDNPH H300 cartridges, Sigma Cat. No. 505331). A calibrated digital flow controller (Sierra Model No. SmartTrak100) was used to precisely meter the volume of air through the DNPH cartridge at 0.5 L/min for 2 minutes (1 L total) per sample. The configuration allowed air to be pulled from the test chamber; through a flow controller, pump and cartridge; and then circulated back into the test chamber. During the collection of the air samples, the H2CO in the air was collected in a DNPH cartridge that had sufficient capacity to capture the available H2CO (ie, no H2CO was exhausted out of the cartridge). After the 2-minute collection, the DNPH cartridge was immediately capped and stored at 5°C ± 3°C until extracted. H2CO exposure values are represented here as concentration × time (CT), the time-integrated product of concentration (ppm) and time (hours), as determined by the “trapezoid rule” with GraphPad Prism software (version 7.03; release date March 7, 2017).
Cartridges were extracted with high-performance liquid chromatography (HPLC)–grade acetonitrile (100 mL, Fisher Scientific Cat. No. A998). An aliquot of the extract was analyzed with a Shimadzu Nexera Ultra High-Performance Liquid Chromatography system equipped with an ultraviolet detector at 360 nm. The dual C18 reverse phase columns (4.6 mm × 15 cm) were used with an isocratic mobile phase of 70% acetonitrile in water to separate the peaks. The calibration range was set between 0.03 and 15 µg/mL, and a calibration curve with a minimum of 6 points was used to calculate the H2CO in the extract.
Validated Sterility Check Method to Remove Acetonitrile Extracts
To remove the DNPH extracts to determine H2CO concentration, a validated sterility check method was developed in compliance with the Centers for Disease Control and Prevention since an HPLC was not available in the BSL-3 laboratories necessary for containment of virulent B anthracis. 15 Extracts were filtered-sterilized via 0.2 micron, acetonitrile-compatible filters (Millipore Cat. No. UFC30LG25). The filters were aseptically placed in liquid growth media for enrichment and then plated onto growth agar with incubation at 37°C for 3 days and 2 days, respectively. After confirmation of sterility, the extracts were removed from the BSL-3 laboratories for HPLC analysis to determine H2CO concentrations.
Sampling Interval
For the efficacy evaluations, material coupons were in airtight containers, and all coupons for each exposure point were co-located in one container. The airtight container was opened using the glove portals, at the beginning of each exposure period for each group of coupons. The start of the exposure periods was staggered such that all exposure durations were completed at the same point in time. For example, the airtight containers for coupons exposed 48 hours to H2CO vapor were opened first, the containers for 32-hour exposure durations were opened 16 hours later, and so forth. This approach allowed simultaneous analysis of all coupons and eliminated the potential effects of coupon storage.
Results
Average Inoculum and Recovery per Coupon by Spore Type Across All Tests.a
a Data are means ± standard deviation.
Recoveries were lower for wood compared to the painted concrete across all the tests conducted and spore types used (Table 3). Bacillus globigii recovered from the positive control on wood (average 4.66 × 10⁶ CFU/coupon) were a log lower than spores recovered from painted concrete (average 4.63 × 10⁷ CFU/coupon). Similarly, the recoveries of B.t. from wood (average 1.28 × 10⁷ CFU/coupon) were slightly less than the recoveries of those extracted from painted concrete (average 6.95 × 10⁷ CFU/coupon). Bacillus anthracis recovered from wood (average 2.60 × 10⁶ CFU/coupon) were also a log lower than the spores from the painted concrete (average 3.14 × 10⁷ CFU/coupon). The relatively high standard deviations for B.t. may be attributed to clumping of the DiPel powder when introduced to PBST despite the preparation being thoroughly mixed.
Positive Control Average Recoveries by Material Coupon Type, Spore Type, and Test Conducted.a
a Data are means ± standard deviation
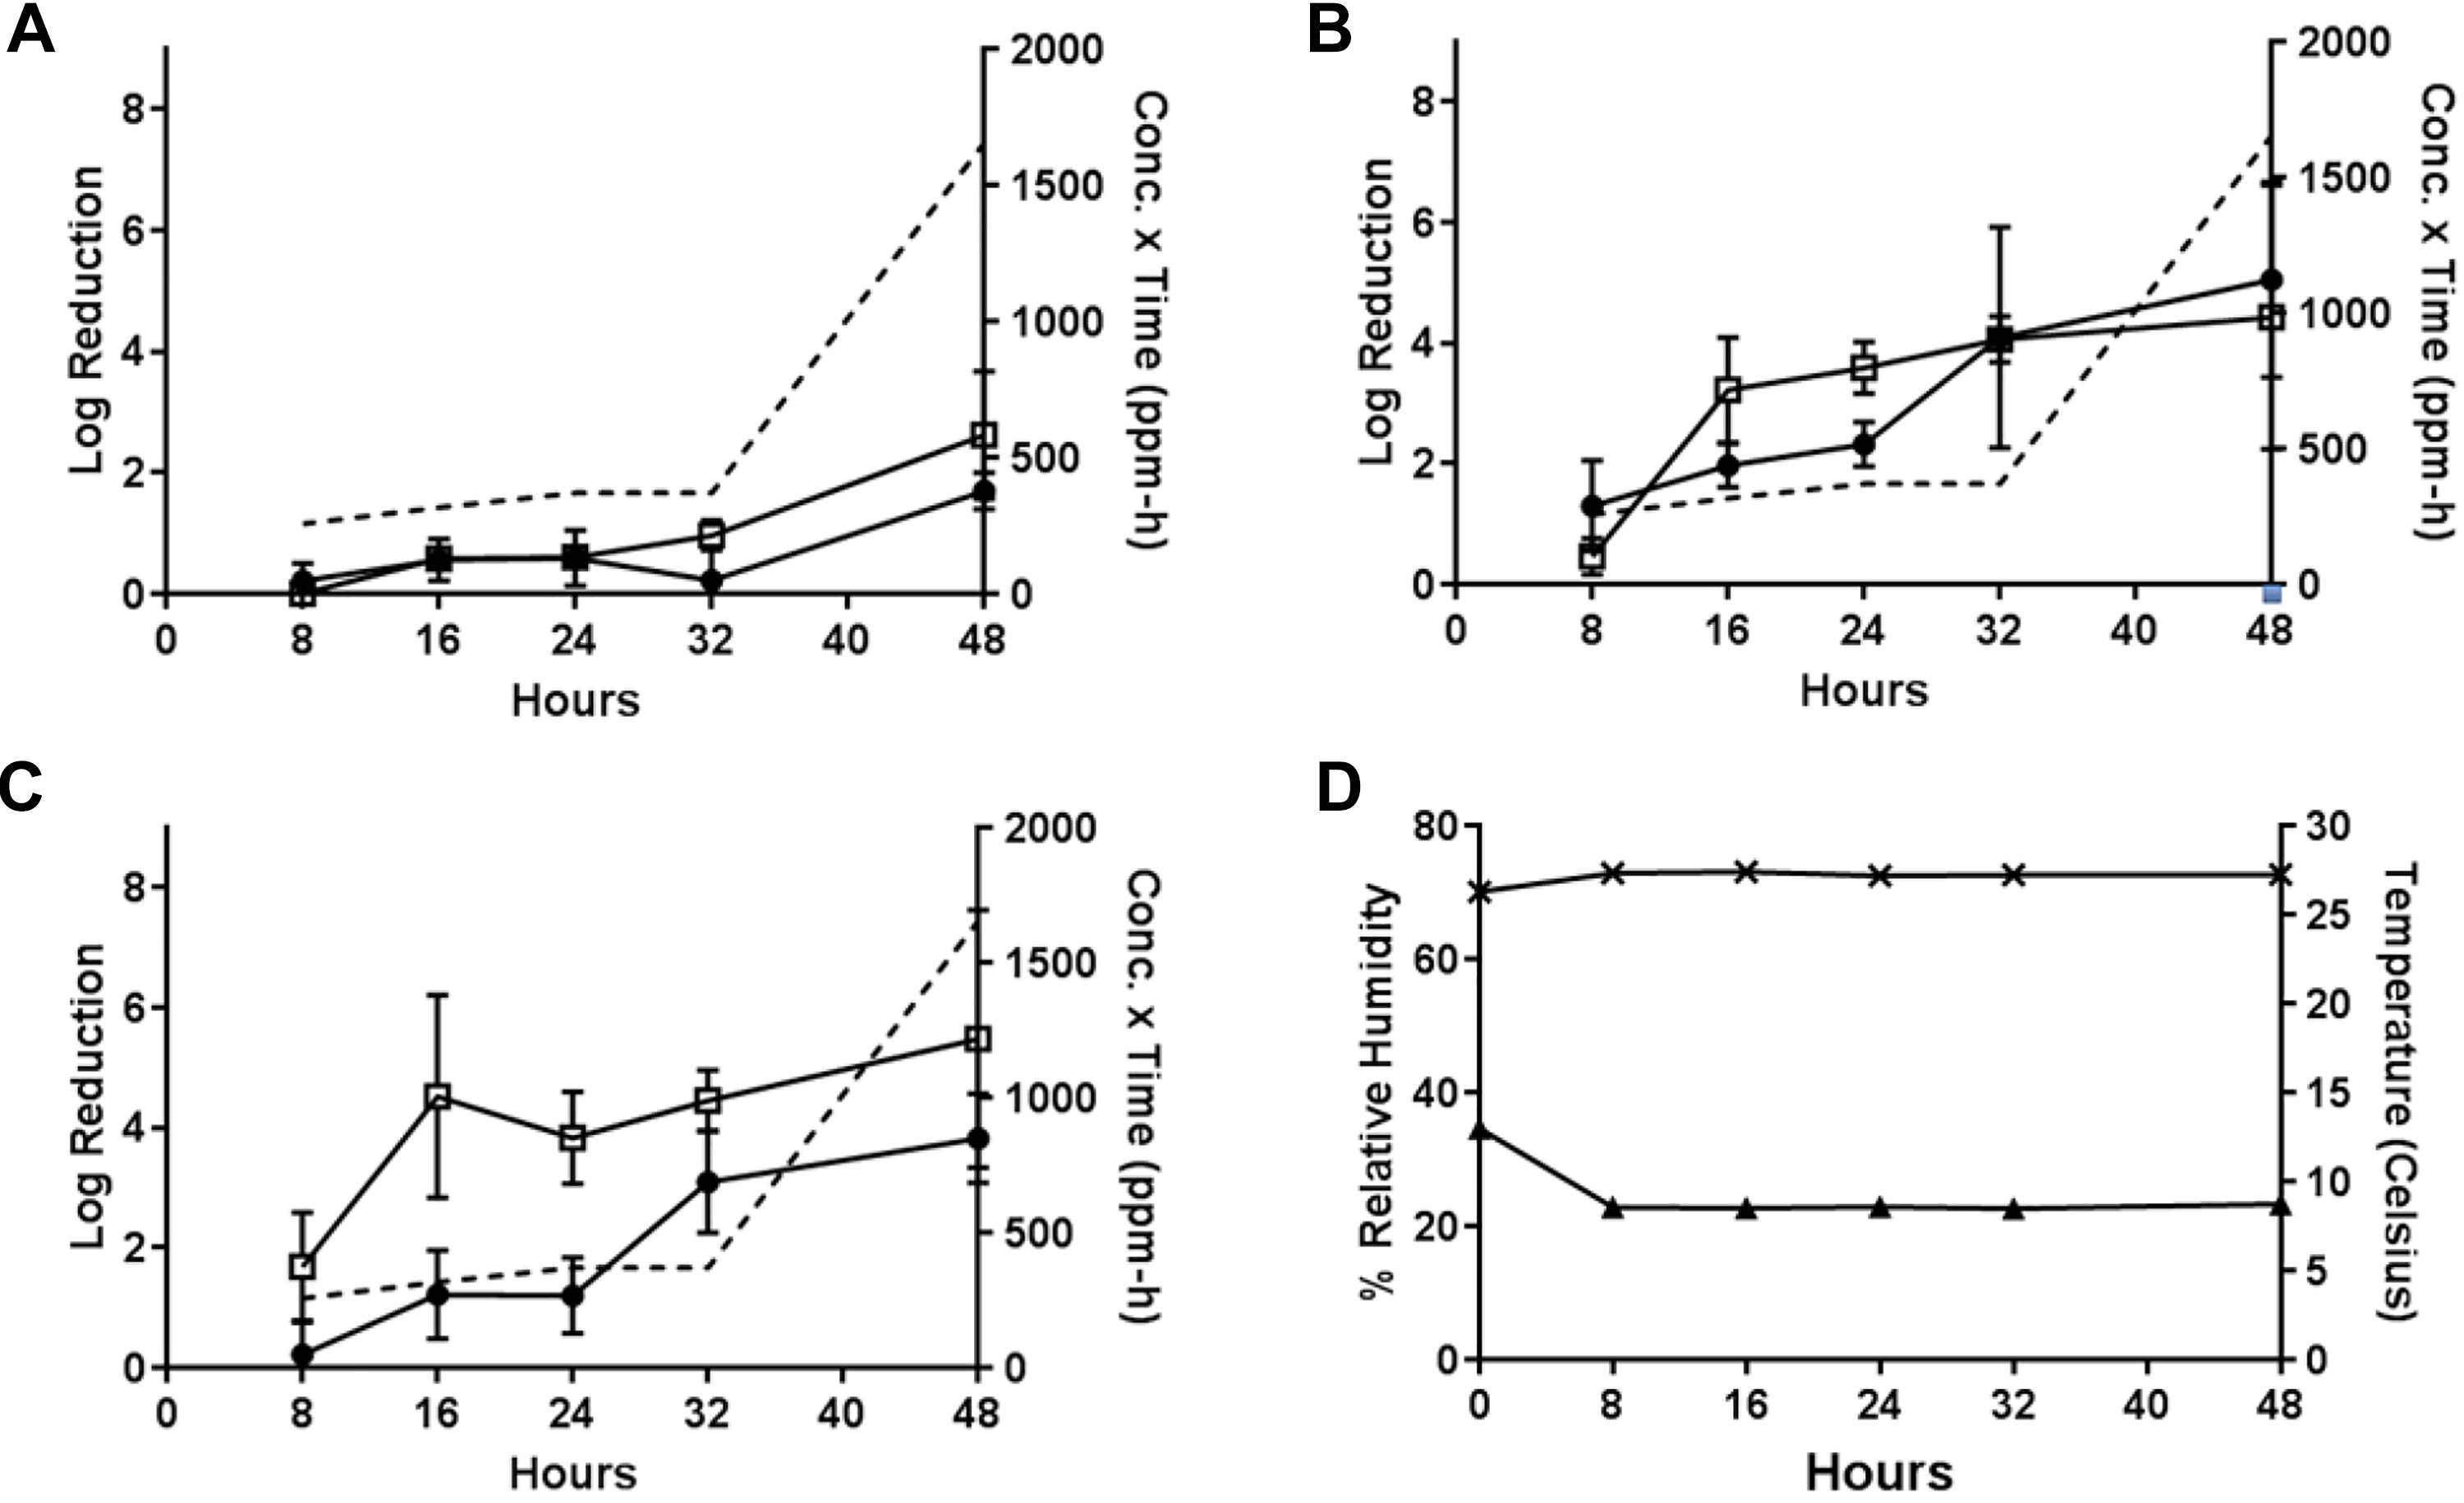
Test 1: efficacy determinations for vaporization of 1 g PF, room temperature, initial 70%-75% RH, 48-hour exposure duration. (A) Decontamination efficacies determined at 5 time-points for B globigii on wood (•) and painted concrete (□), and concentration × time (ppm-hours) of H2CO vapor calculated at each time-point (- - -). (B) Decontamination efficacies determined at 5 time-points for B thuringiensis on wood (•) and painted concrete (□), and concentration × time (ppm-hours) of H2CO vapor calculated at each time-point (- - -). (C) Test conducted at room temperature (▴) with initial 70%-75% RH (×) environmental conditions. B globigii and B thuringiensis were concurrently tested but represented on separate graphs for clarity.
An initial test that involved the sublimation of 1 g PF at room temperature with a starting RH of 70% to 75% (Test 1, Table 1) resulted in LRs of 3.69 ± 0.10 from wood and 7.80 ± 0.09 from painted concrete for B.g. and 7.70 ± 0.07 from wood and 7.66 ± 0.30 from painted concrete for B.t. after the maximum 48 hour H2CO vapor exposure (H2CO concentration × time = 1826 ppm-hours). Time-points 8, 16, 24, and 32 hours resulted in < 5 log reduction (Figure 2a).
In Test 2, 5.2 g of PF was sublimated at approximately 10°C with a starting RH of 70% to 75% (Test 2, Table 1), and these conditions resulted in efficacies of 2.59 ± 0.73 from wood and 3.56 ± 0.49 from painted concrete for B globigii and 7.13 ± 0.95 from wood and 6.70 ± 0.11 from painted concrete for B thuringiensis after the maximum 48-hour H2CO vapor exposure (H2CO concentration × time = 1815 ppm-hours). High decontamination efficacies were observed for painted concrete at the 24- and 32-hour time-points (5.79 and 6.36 log reductions, respectively) for B globigii, as well as 16- and 24-hour time-points (6.70 and 5.73 log reductions, respectively) for B thuringiensis. The resulting H2CO concentration × time values for 16-, 24-, and 32-hour time-points were 711, 714, and 735 ppm-hours, respectively. Other time-points resulted in < 5 log reduction (Figure 3).
Test 2: efficacy determinations for vaporization of 5.2 g PF, approximately 10°C, initial 70%-75% RH, 48-hour exposure duration. (A) Decontamination efficacies determined at 5 time-points for B globigii on wood (•) and painted concrete (□), and concentration x time (ppm-hours) of H2CO vapor calculated at each time-point (- - -). (B) Decontamination efficacies determined at 5 time-points for B thuringiensis on wood (•) and painted concrete (□), and concentration x time (ppm-hours) of H2CO vapor calculated at each time-point (- - -). (C) Low temperature (▴) with starting 70%-75% RH (×) environmental conditions over a 48-hour exposure duration. B globigii and B thuringiensis were concurrently tested but represented on separate graphs for clarity.
A subset of tests was conducted with B.a. to confirm the decontamination efficacy data obtained with B globigii and B thuringiensis. In Test 3 (compared to Test 1), the sublimation of 1 g PF at room temperature with a starting RH of 70% to 75% (Table 1) resulted in B. anthracis decontamination efficacies of 6.84 ± 0.12 from wood and 7.65 ± 0.02 from painted concrete after the maximum 48-hour H2CO vapor exposure (H2CO concentration × time = 14,526 ppm-hours) (Figure 4). High decontamination efficacies were observed for painted concrete at the 24- and 32-hour time-points (5.85 and 6.99 log reductions, respectively). The resulting H2CO concentration × time values for the 24- and 32-hour time-points were 2269 and 3235 ppm-hours, respectively. Other time-points resulted in <4 log reduction (Figure 4).
Test 3: efficacy determinations for vaporization of 1 g PF, room temperature, initial 70%-75% RH, 48-hour exposure duration. (A) Decontamination efficacies determined at 5 time-points for B anthracis on wood (•) and painted concrete (□), and concentration x time (ppm-hours) of H2CO vapor calculated at each time-point (- - -). (B) Room temperature (▴) with starting 70%-75% RH (×) environmental conditions over a 48-hour exposure duration.
In Test 4 (compared to Test 2), the sublimation of 5.2 g PF at approximately 10°C with a starting RH of 70% to 75% (Table 1) resulted in B anthracis efficacies of 2.86 ± 0.72 from wood and 7.65 ± 0.07 from painted concrete after the maximum 48-hour H2CO vapor exposure (H2CO concentration × time = 5499 ppm-hours). High decontamination efficacies were observed for painted concrete at the 16-, 24-, and 32-hour time-points (6.34, 7.65, and 7.65 log reductions, respectively). The resulting H2CO concentration × time values for the 16- and 32-hour time-points were 2182 and 2290 ppm-hours, respectively (the H2CO reading for time-point 24 hours was not collected). Other time-points resulted in < 3 log reduction (Figure 5).
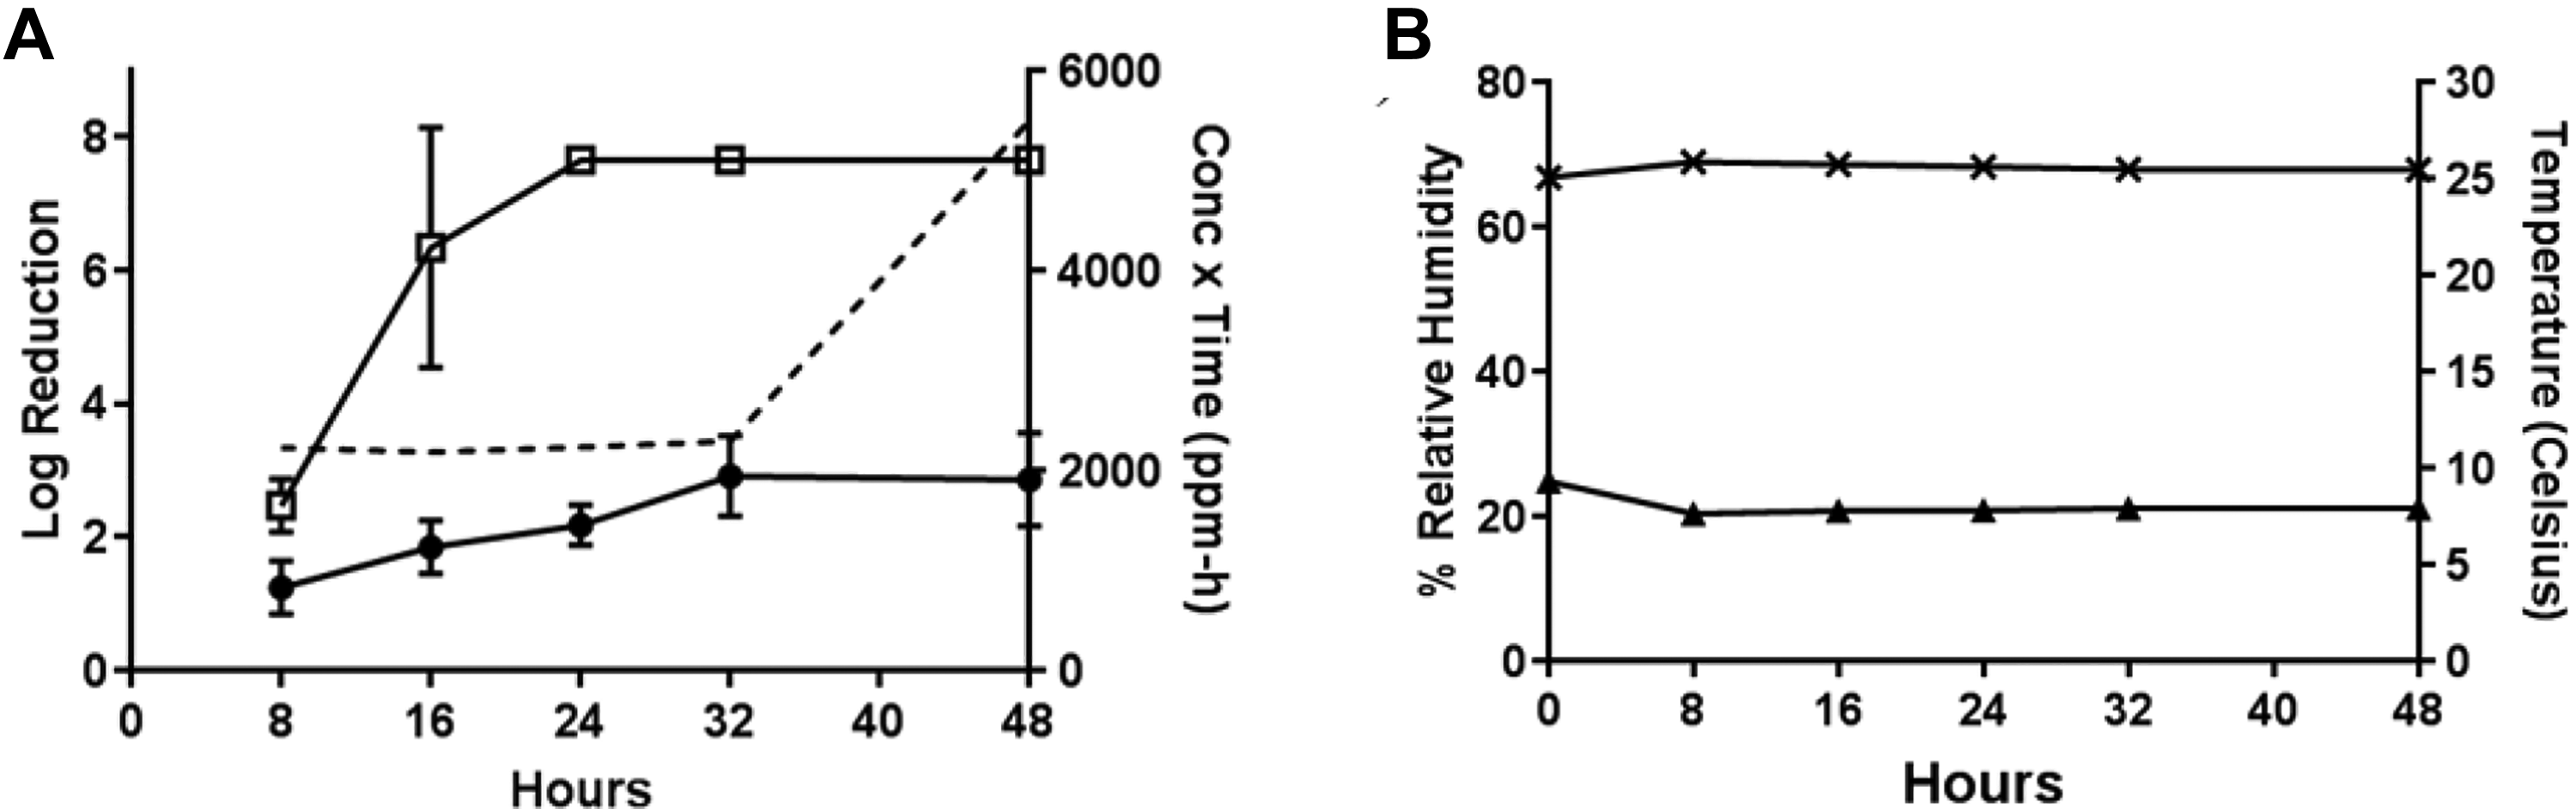
Test 4: efficacy determinations for vaporization of 5.2 g PF, approximately 10°C, initial 70%-75% RH, 48-hour exposure duration. (A) Decontamination efficacies determined at 5 time-points for B anthracis on wood (•) and painted concrete (□), and concentration x time (ppm-hours) of H2CO vapor calculated at each time-point (- - -). (B) Low temperature (▴) with starting 70%-75% RH (×) environmental conditions over a 48-hour exposure duration.
During Test 5, the PF-equivalent mass of formalin for 1 g PF was vaporized at room temperature with a starting RH of 70% to 75% (Test 5, Table 1). These conditions resulted in efficacies of 6.26 ± 0.38 from wood and 7.64 ± 0.16 from painted concrete for B.g., 6.65 ± 0.68 from wood and 7.47 ± 0.44 from painted concrete for B.t., and 6.62 ± 0.09 from wood and 7.43 ± 0.21 from painted concrete for B.a. after the maximum 48-hour H2CO vapor exposure (H2CO concentration × time = 7222 ppm-hours). High decontamination efficacies were observed for painted concrete at the 32-hour time-point (5.04 log reductions) for B thuringiensis, as well as 24- and 32-hour time-points (6.61 and 6.92 log reductions, respectively) for B anthracis. The resulting H2CO concentration × time values for 24- and 32-hour time-points were 1115 and 1622 ppm-hours, respectively. Other time-points resulted in < 5 log reduction (Figure 6).
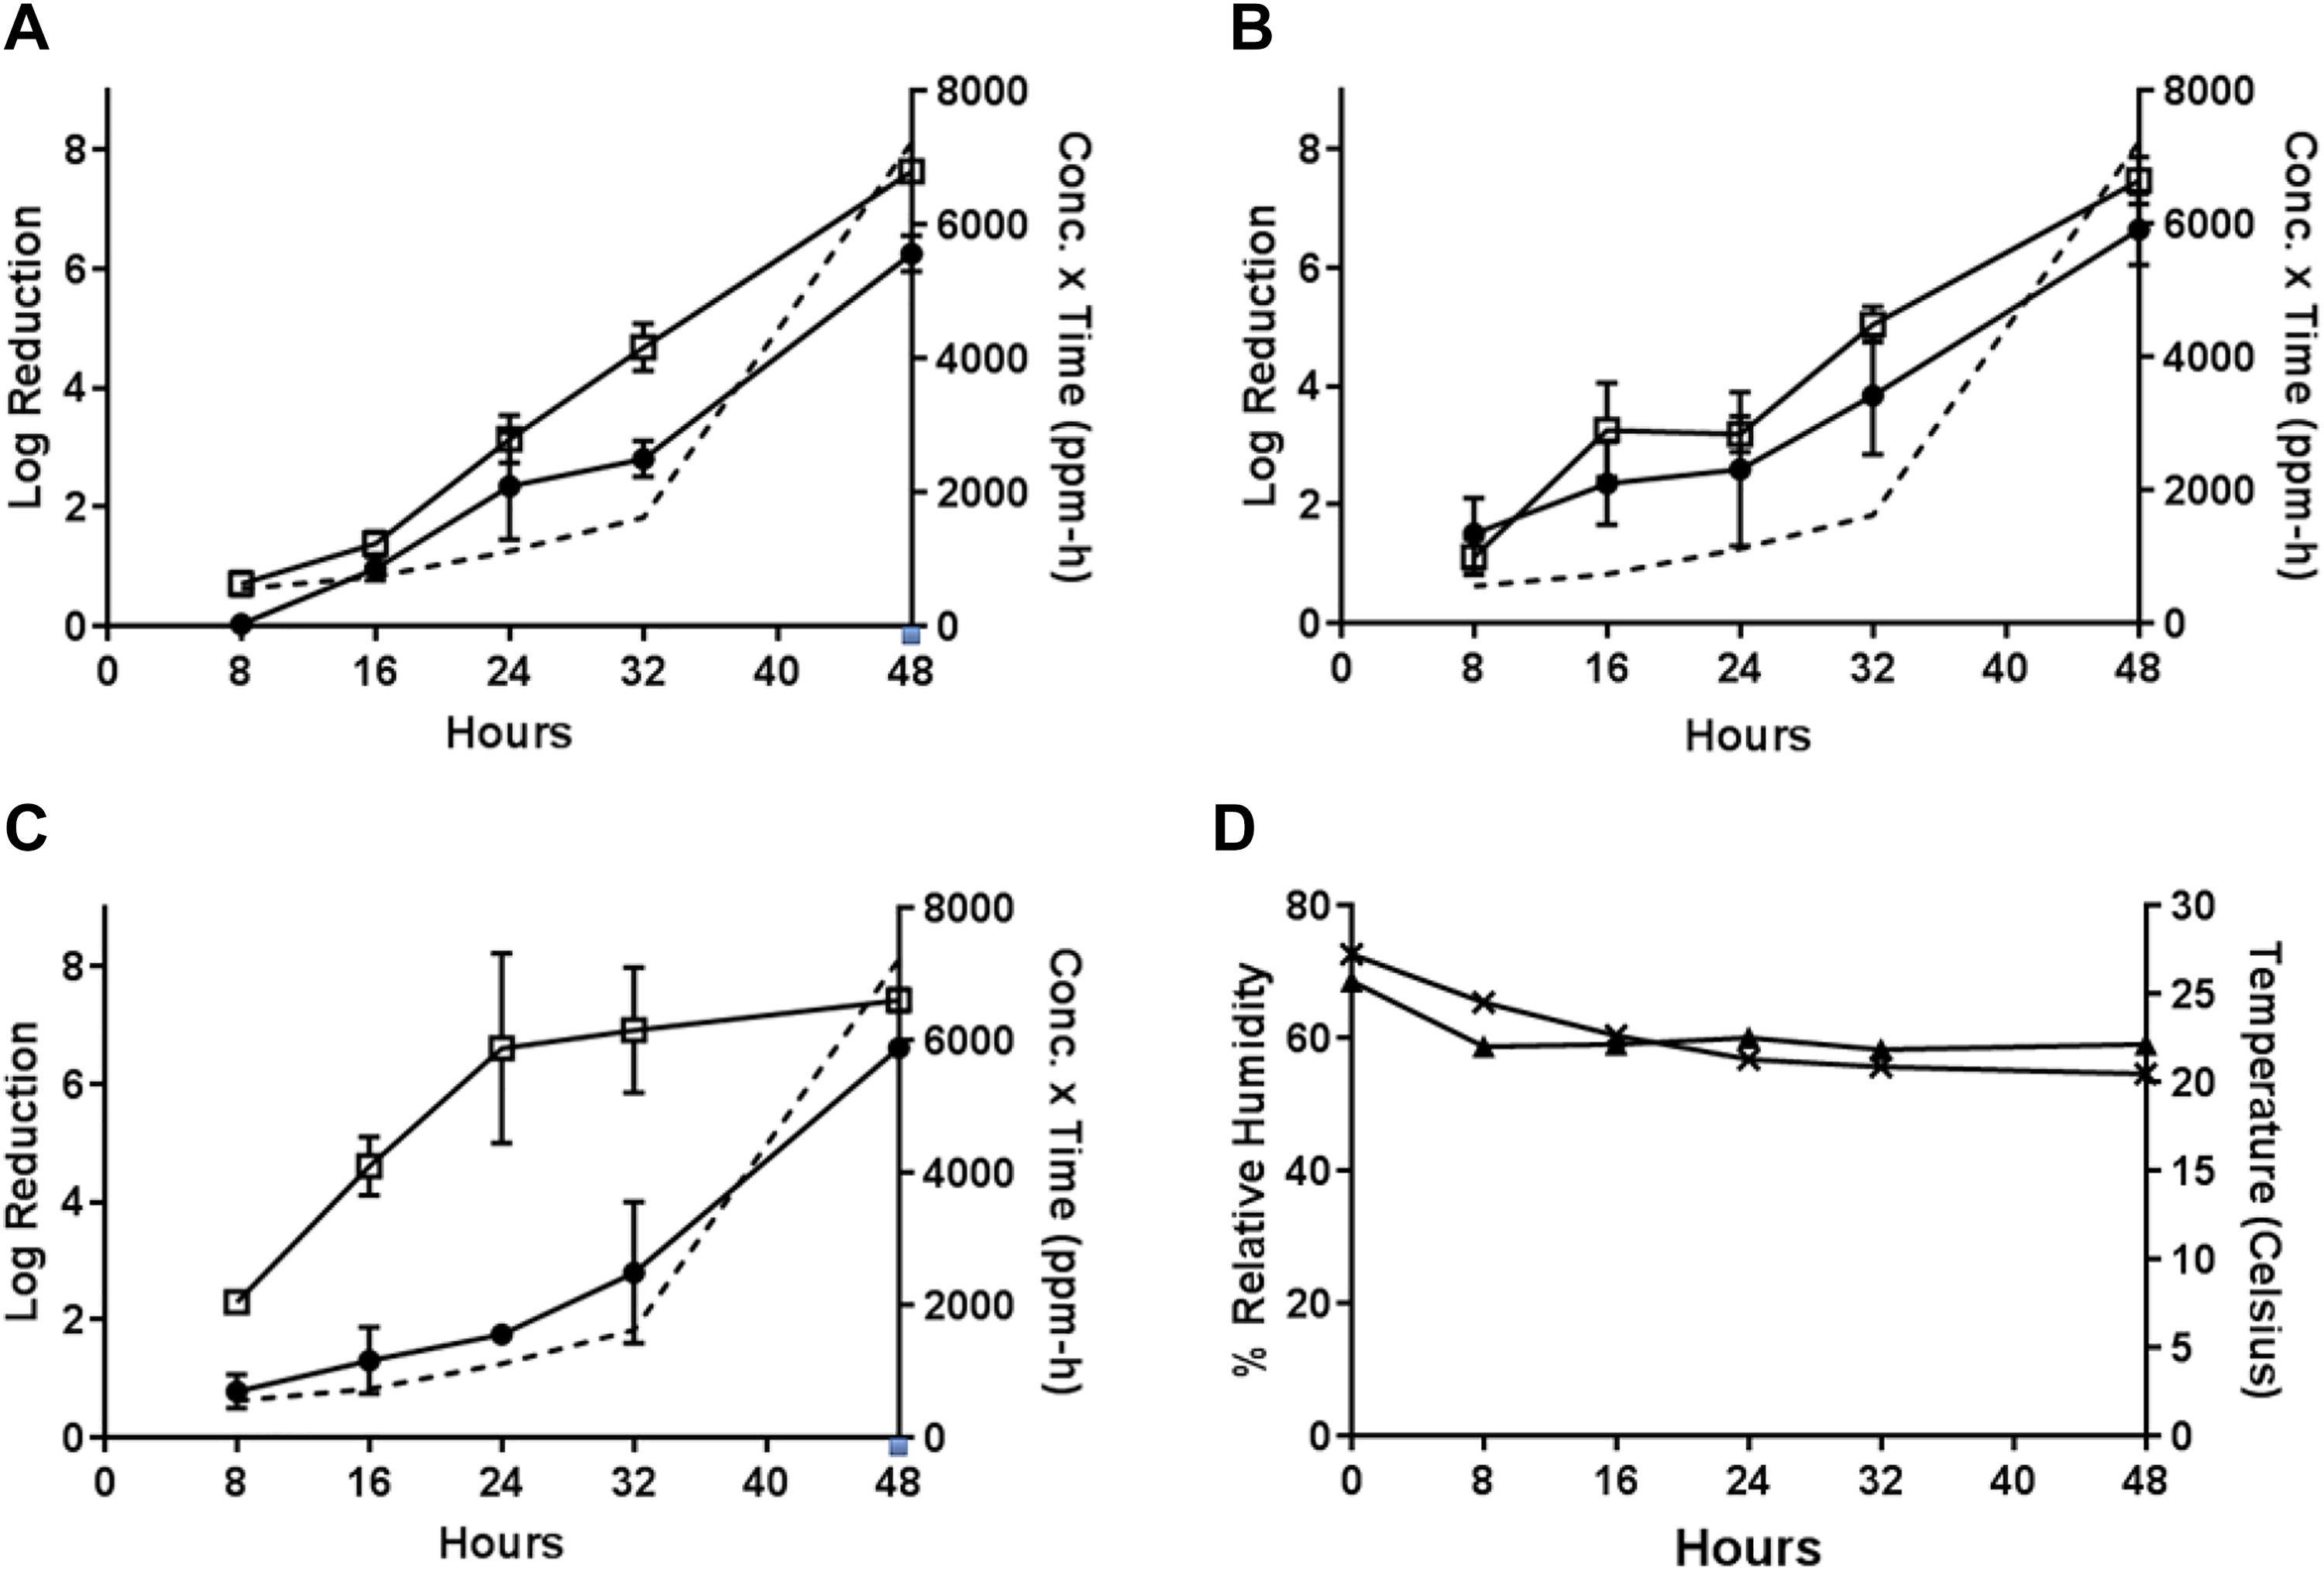
Test 5: efficacy determinations for vaporization of 1 g PF-equivalent mass of formalin, room temperature, initial 70%-75% RH, 48-hour exposure duration. (A) Decontamination efficacies determined at 5 time-points for B globigii on wood (•) and painted concrete (□), and concentration x time (ppm-hours) of H2CO vapor calculated at each time-point (- - -). (B) Decontamination efficacies determined at 5 time-points for B thuringiensis on wood (•) and painted concrete (□), and concentration x time (ppm-hours) of H2CO vapor calculated at each time-point (- - -). (C) Decontamination efficacies determined at 5 time-points for B anthracis on wood (•) and painted concrete (□), and concentration x time (ppm-hours) of H2CO vapor calculated at each time-point (- - -). (D) Room temperature (▴) with starting 70-%75% RH (×) environmental conditions over a 48-hour exposure duration. B globigii, B thuringiensis, and B anthracis were concurrently tested but represented on separate graphs for clarity.
For Test 6, the PF-equivalent mass of formalin for 5.2 g PF was vaporized at approximately 10°C with a starting RH of 70% to 75% (Test 6, Table 1). These conditions resulted in efficacies of 6.70 ± 0.20 from wood and 7.68 ± 0.08 from painted concrete for B.g., 6.13 ± 0.29 from wood and 7.44 ± 1.41 from painted concrete for B.t., and 6.37 ± 0.31 from wood and 7.49 ± 0.08 from painted concrete for B.a. after the maximum 48 hour H2CO vapor exposure (H2CO concentration × time = 6414 ppm-hours). High decontamination efficacies were observed for wood at the 24- and 32-hour time-points (6.13 and 6.13 log reductions, respectively) for B thuringiensis as well as 16-, 24-, and 32-hour time-points (6.37, 6.37, and 5.86 log reductions, respectively) for B anthracis. The resulting H2CO concentration × time values for the 16-, 24-, and 32-hour time-points were 1602, 1723, and 1901 ppm-hours, respectively. Other time-points resulted in <5 log reduction (Figure 7).
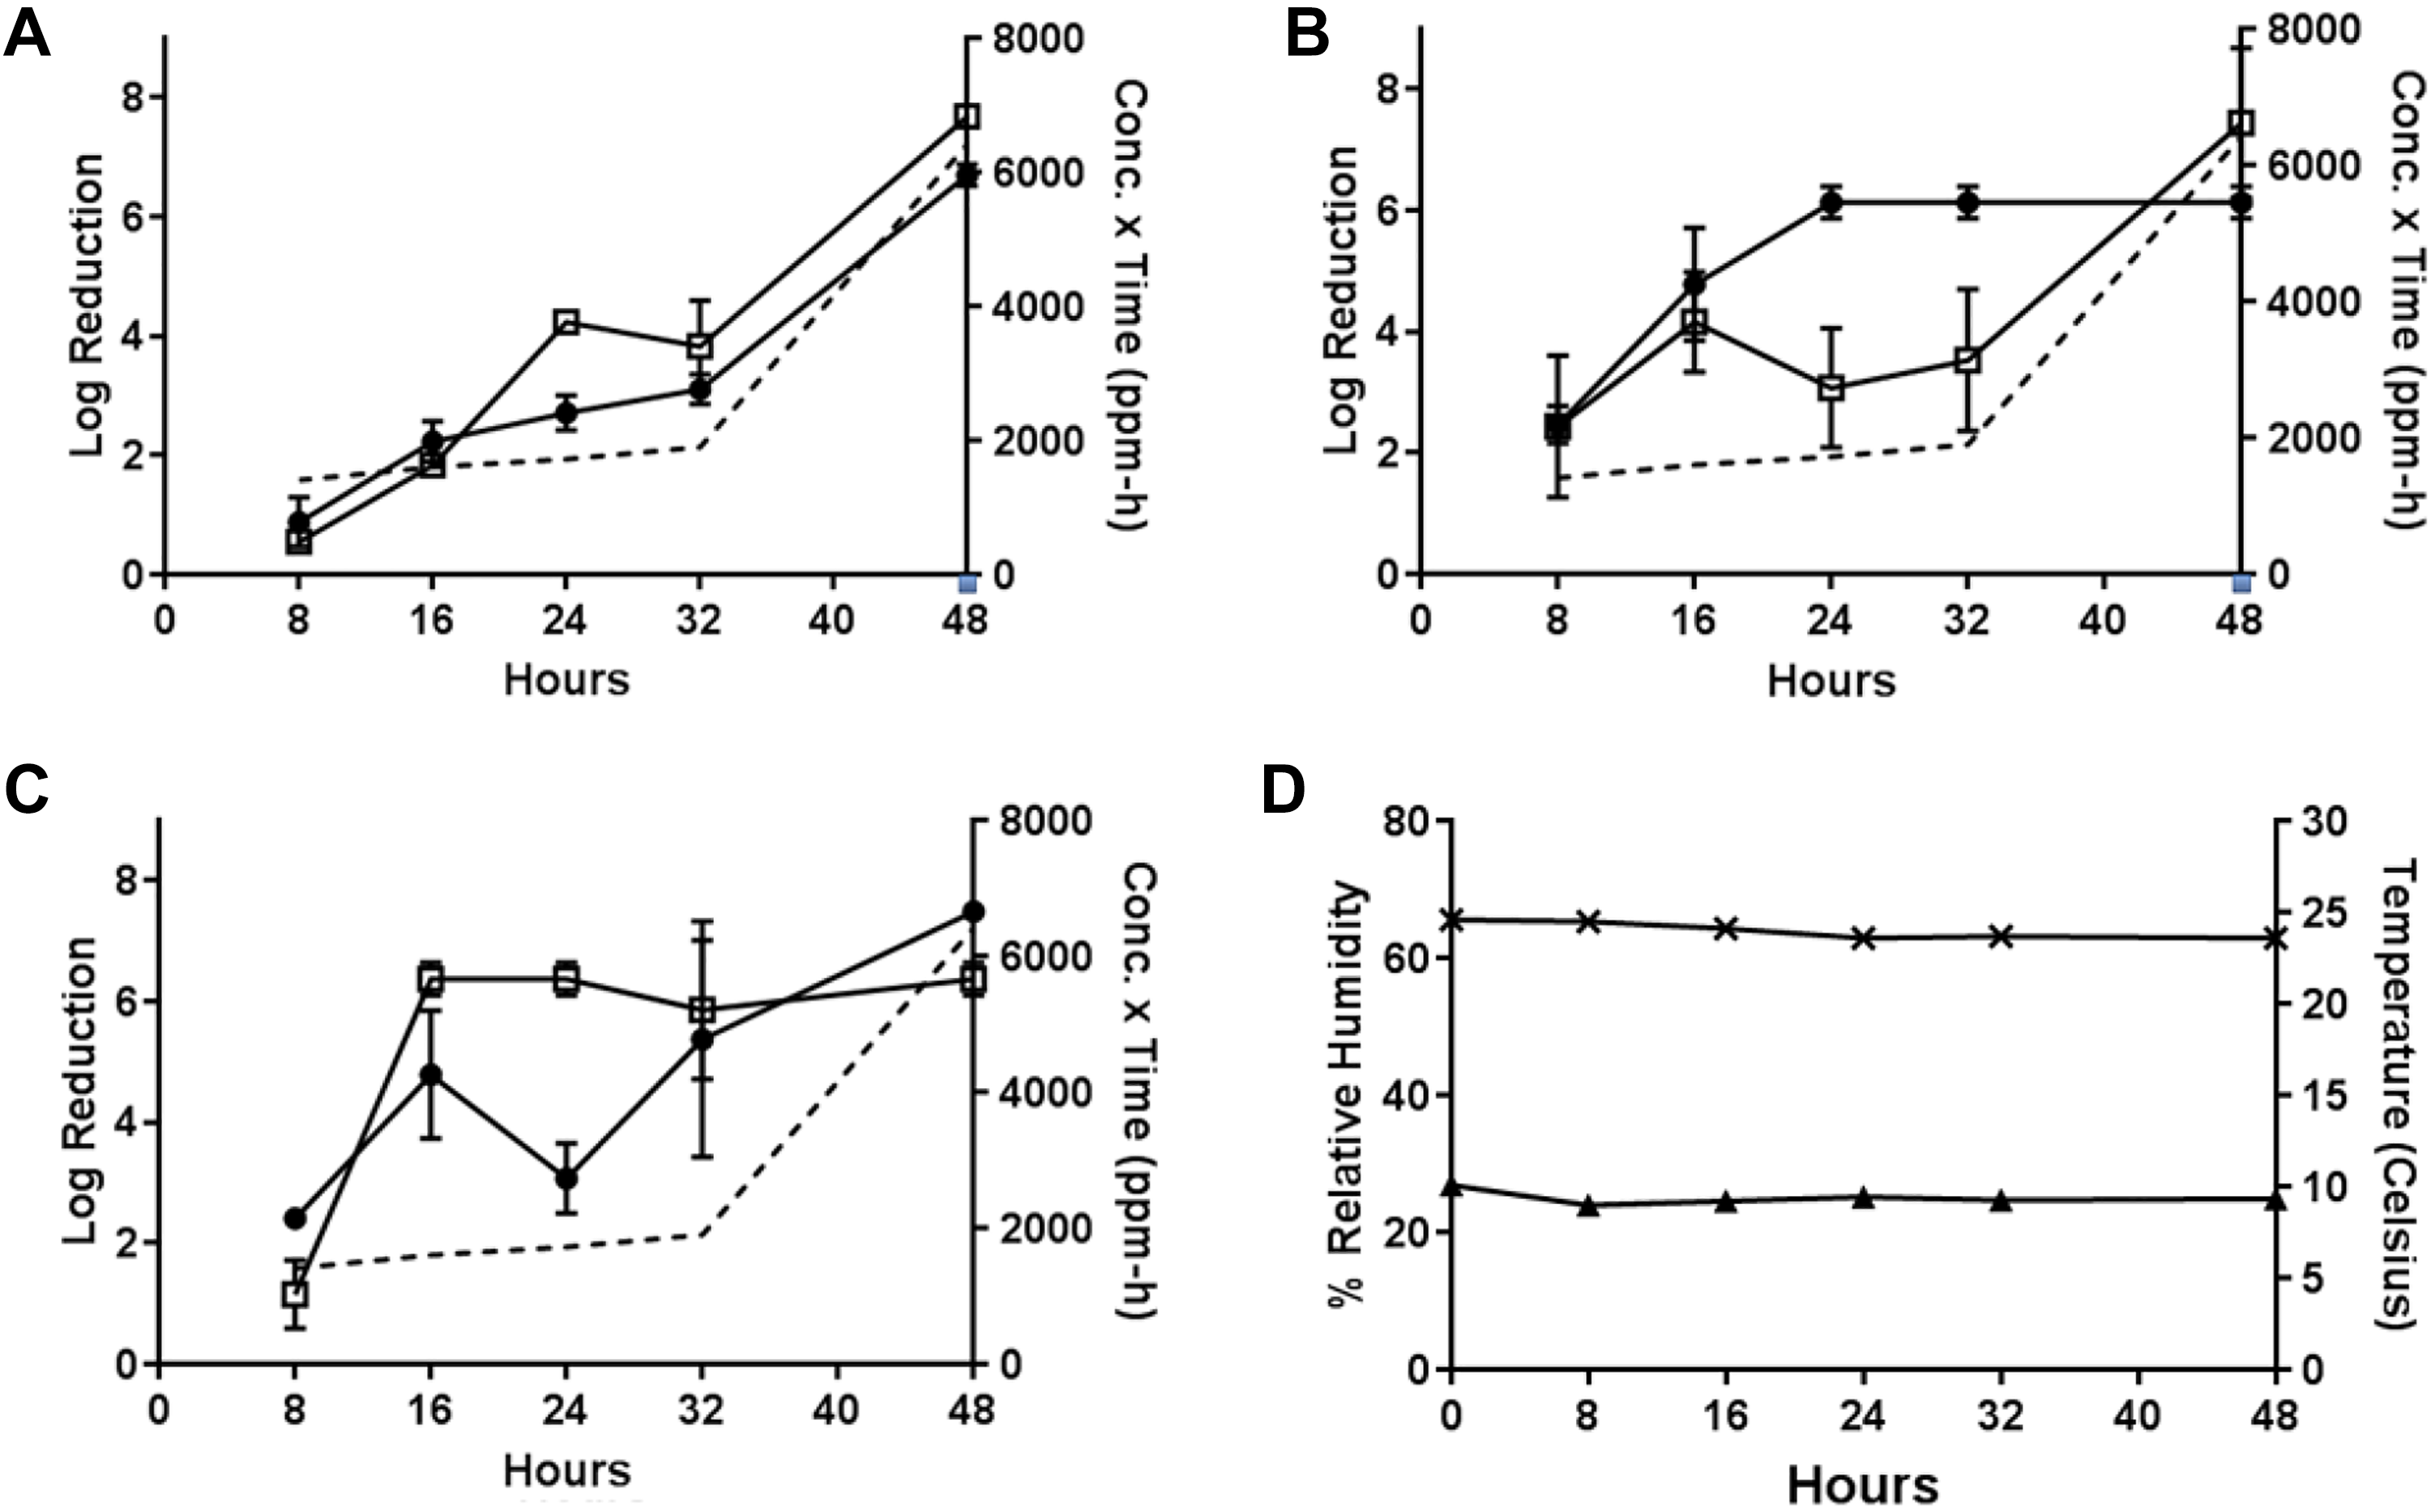
Test 6: efficacy determinations for vaporization of 5.2 g PF-equivalent mass of formalin, approximately 10°C, initial 70%-75% RH, 48-hour exposure duration. (A) Decontamination efficacies determined at 5 time-points for B globigii on wood (•) and painted concrete (□), and concentration x time (ppm-hours) of H2CO vapor calculated at each time-point (- - -). (B) Decontamination efficacies determined at 5 time-points for B thuringiensis on wood (•) and painted concrete (□), and concentration x time (ppm-hours) of H2CO vapor calculated at each time-point (- - -). (C) Decontamination efficacies determined at 5 time-points for B anthracis on wood (•) and painted concrete (□), and concentration x time (ppm-hours) of H2CO vapor calculated at each time-point (- - -). (D) Low temperature (▴) with starting 70%-75% RH (×) environmental conditions over a 48-hour exposure duration. B globigii, B thuringiensis, and B anthracis were concurrently tested but represented on separate graphs for clarity.
In Test 7, the sublimation of 1 g PF at approximately 10°C with a starting RH of 70% to 75% (Table 1) resulted in efficacies of 6.49 ± 1.95 from painted concrete for B.g., 6.21 ± 0.68 from wood and 6.72 ± 0.087 from painted concrete for B.t., and 6.84 ± 1.59 from painted concrete for B.a. after the maximum 48-hour H2CO vapor exposure (H2CO concentration × time = 6614 ppm-hours). High decontamination efficacies were observed for painted concrete at the 32-hour time-point (6.22 log reduction) for B thuringiensis. At the 48-hour time-point for B.a. on wood, the highest log reduction was 5.05 ± 1.19. The resulting H2CO concentration × time values for the 32- and 48-hour time-points were 2419 and 6614 ppm-hours, respectively. Other time-points resulted in <4 log reduction (Figure 8).
Test 7: decontamination efficacy of 1 g PF, approximately 10°C, initial 70%-75% RH, 48-hour exposure duration. (A) Decontamination efficacies determined at 5 time-points for B globigii on wood (•) and painted concrete (□), and concentration x time (ppm-hours) of H2CO vapor calculated at each time-point (- - -). (B) Decontamination efficacies determined at 5 time-points for B thuringiensis on wood (•) and painted concrete (□), and concentration x time (ppm-hours) of H2CO vapor calculated at each time-point (- - -). (C) Decontamination efficacies determined at 5 time-points for B anthracis on wood (•) and painted concrete (□), and concentration x time (ppm-hours) of H2CO vapor calculated at each time-point (- - -). (D) Low temperature (▴) with starting 70%-75% RH (×) environmental conditions over a 48-hour exposure duration. B globigii, B thuringiensis, and B anthracis were concurrently tested but represented on separate graphs for clarity.
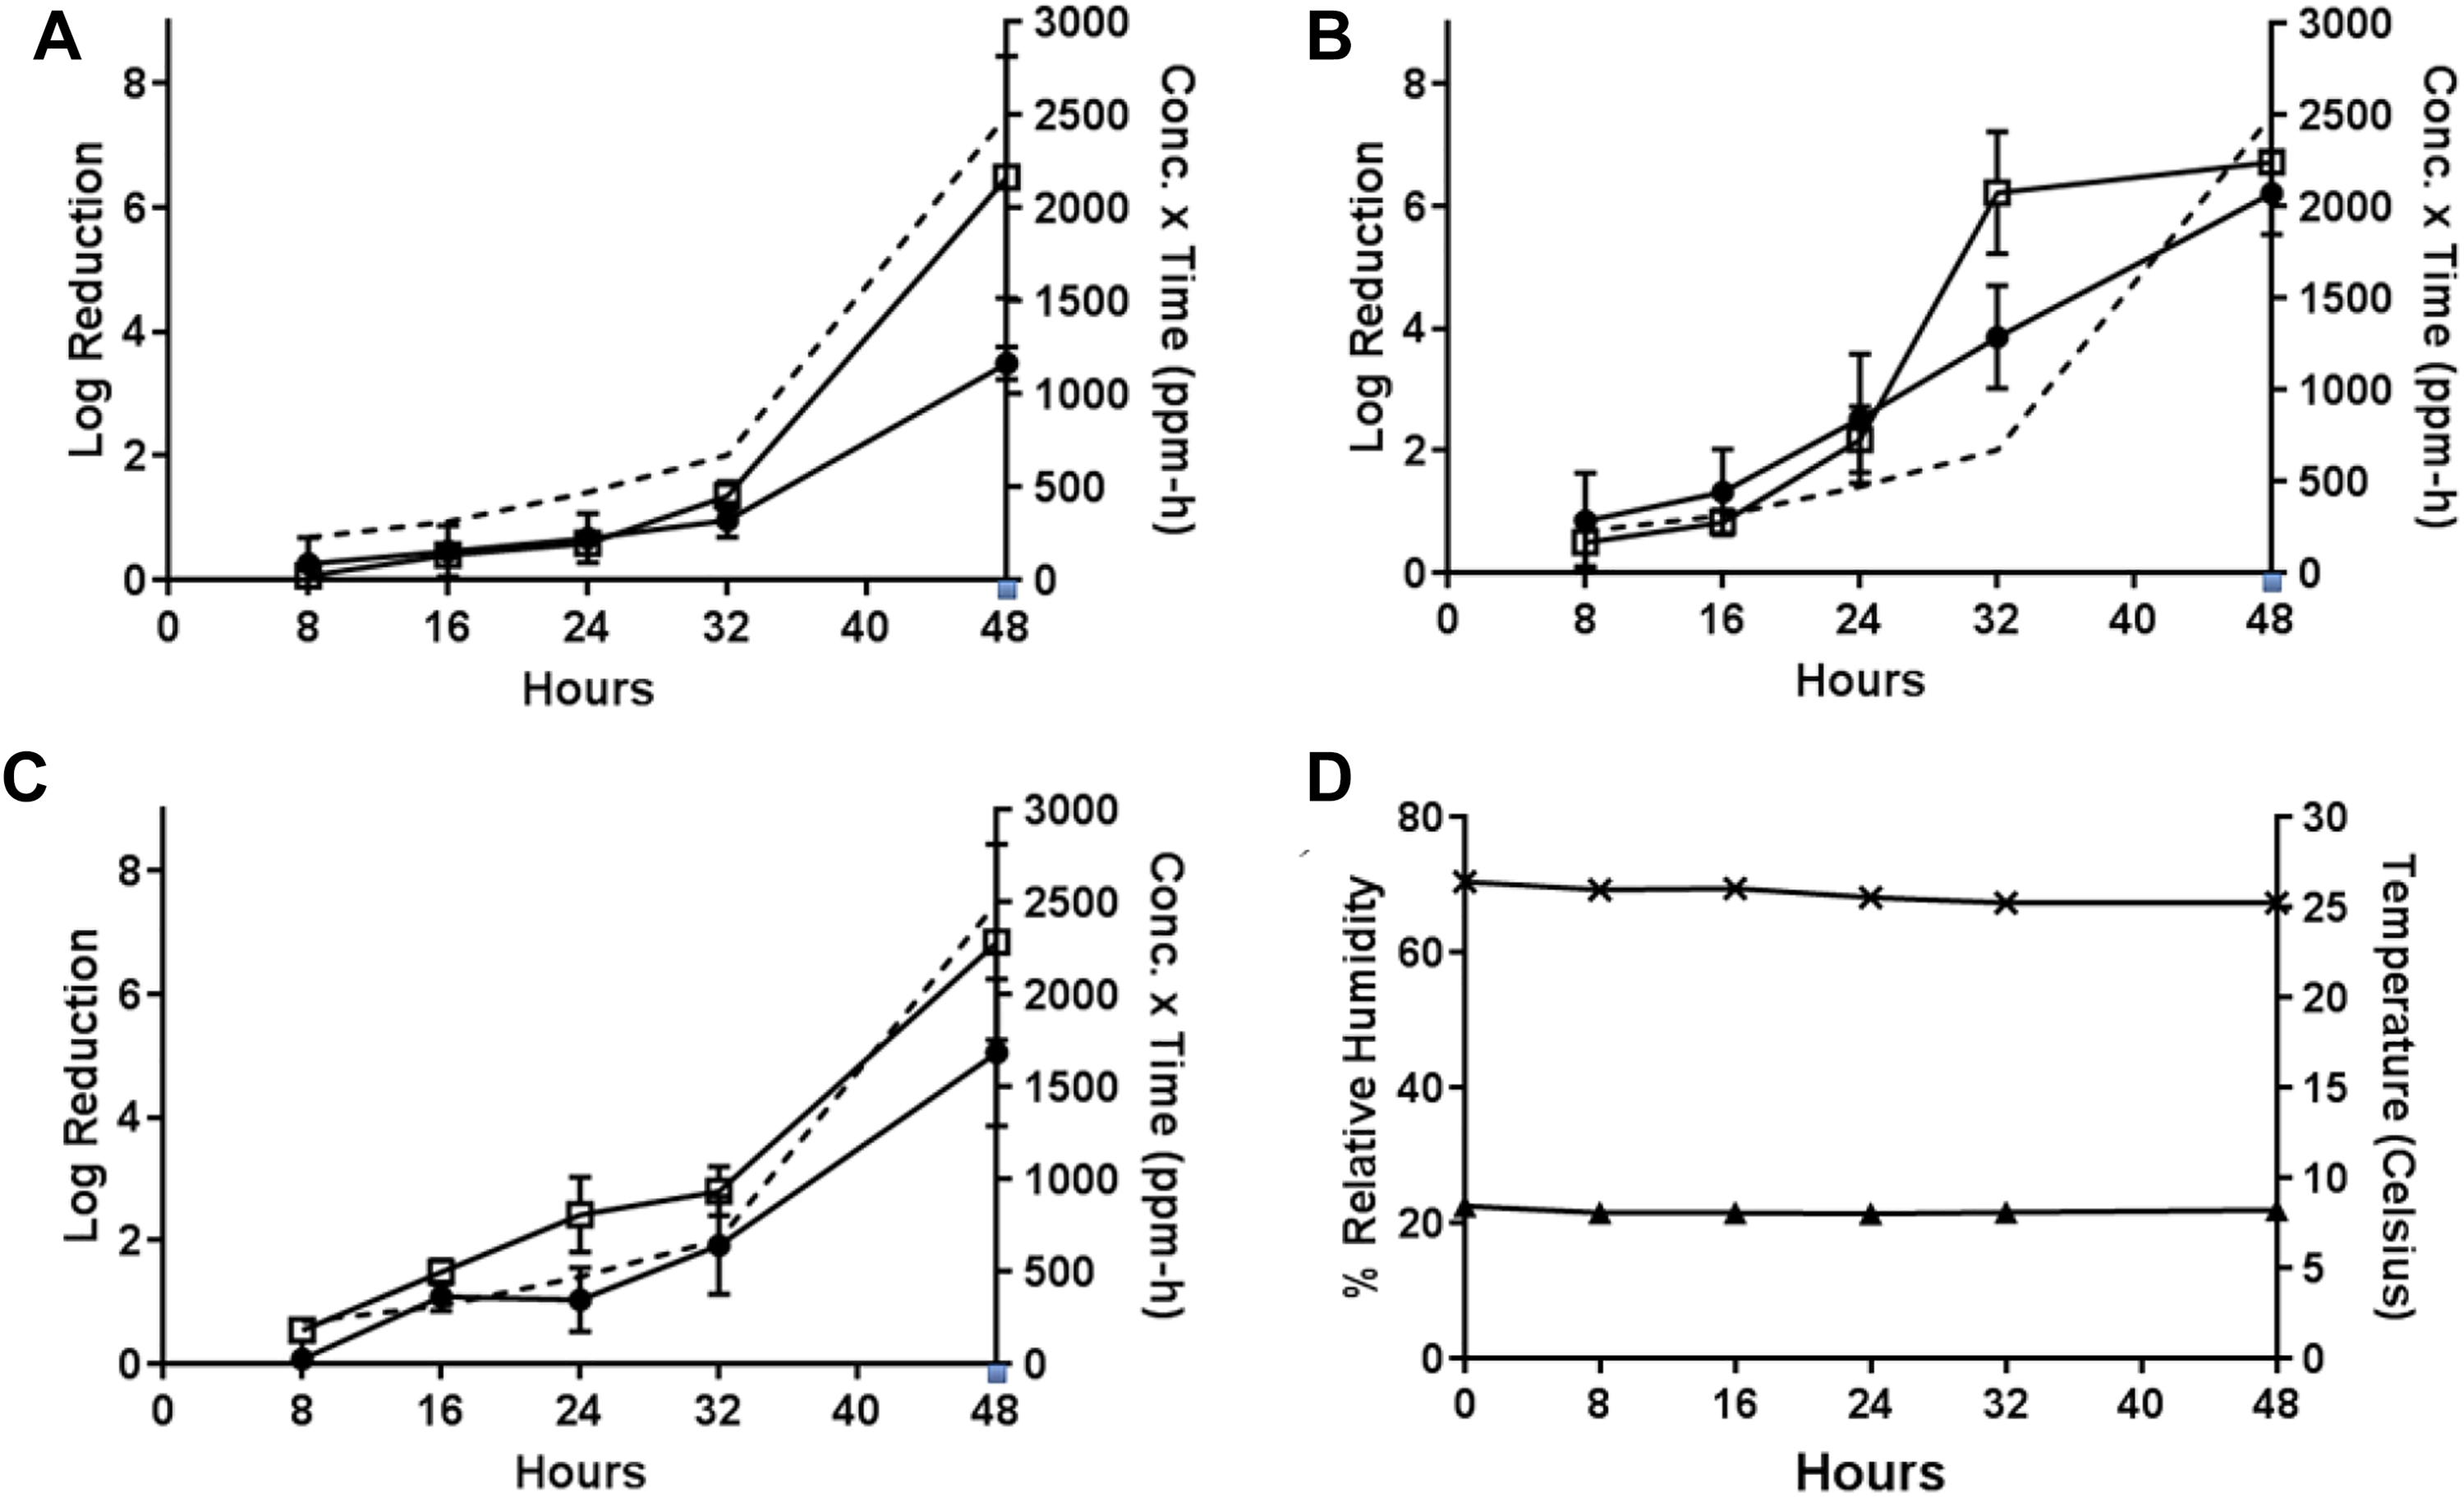
During Test 8, the PF-equivalent mass of formalin for 1 g PF was vaporized at approximately 10°C with a starting RH of 70% to 75% (Test 8, Table 1). These conditions resulted in lower efficacies than previous tests. (This test was the first test that involved the cold temperature with less than saturation H2CO vapor present in the test chamber.) At the 48-hour time-point, low efficacies of 1.70 ± 0.31 from wood and 2.62 ± 1.048 from painted concrete for B.g., higher efficacies of 5.05 ± 1.62 from wood and 4.43 ± 2.19 from painted concrete for B.t., and 3.82 ± 0.74 from wood and 5.48 ± 2.15 from painted concrete for B.a. after the maximum 48-hour H2CO vapor exposure (H2CO concentration × time = 1654 ppm-hours) were observed, as shown in Figure 9.
Test 8: decontamination efficacy of 1 g PF-equivalent mass of formalin, approximately 10°C, initial 70%-75% RH, 48-hour exposure duration. (A) Decontamination efficacies determined at 5 time-points for B globigii on wood (•) and painted concrete (□), and concentration x time (ppm-hours) of H2CO vapor calculated at each time-point (- - -). (B) Decontamination efficacies determined at 5 time-points for B thuringiensis on wood (•) and painted concrete (□), and concentration x time (ppm-hours) of H2CO vapor calculated at each time-point (- - -). (C) Decontamination efficacies determined at 5 time-points for B anthracis on wood (•) and painted concrete (□), and concentration x time (ppm-hours) of H2CO vapor calculated at each time-point (- - -). (D) Low temperature (▴) with starting 70%-75% RH (×) environmental conditions over a 48-hour exposure duration. B globigii, B thuringiensis, and B anthracis were concurrently tested but represented on separate graphs for clarity.
Discussion
Except for prions, bacterial spores exhibit higher resistance to chemical and physical inactivation than all other microorganisms. 16 For this reason, the foremost interest was with B.a. since any effective decontamination approach against the B.a. spores will likely be efficacious against non–spore-forming bacteria. Also, Bacillus spores were tested in this study due to the historical data available in the decontamination arena. 4
A possible leak from the test chamber could explain a disparity of H2CO vapor concentrations between Tests 1 and 3 (Table 1). Both tests involved similar parameters (coupon types, environmental conditions, and time-points), with the only difference being spore type. Test 1 was one of the first tests conducted in this study, and there was a clear difference between individual H2CO vapor concentrations per time-point, which translated into disproportional concentration × time ppm-hour values between the 2 trials. Practices to prevent H2CO vapor leakage as well as safety modifications and a different exhausting technique were employed as described by Coldiron et al 17 upon reviewing the data from Tests 1 and 3.
Munro et al 6 showed that the optimal formaldehyde gas decontamination parameters for B.a. spores were 66% RH, a minimum temperature of 28°C, and 10.5 g PF/m3. Since the test chamber used for this effort was 0.5 m3, the maximum mass of PF used was 5.25 g (10.5 g PF/m3; Trial Nos. 2, 4, and 6, Table 1). In other trials, 1 g of PF (Trial Nos. 1, 3, 7, and 8, Table 1) was used to achieve less-than-saturation H2CO conditions in the test chamber. Rogers et al7 showed consistent H2CO air measurements out to 10 hours after vapor generation. The decrease in H2CO concentration, due to sorption to all test chamber interior components, may have occurred between the 10-hour and 16-hour time-points since the generation methods between the work described in Rogers et al7 and this effort were similar (ie, both generation methods used PF heated in a container). An indicator that H2CO sorption readily occurred inside the test chamber was that it took several days (up to 6 days in some cases) to clear the test chamber of H2CO (as measured with a low-level sensor, Draeger Gas Detection Tubes, Cole-Parmer Cat. No. EW-86514-34) for safe reentry after H2CO evacuation (0.75 ppm permissible exposure limit measured as an 8-hour time-weighted average, 29 CFR 1910.1048) in preparation for the next trial. 18
There was an appreciable amount of surface area inside the test chamber due to the heat exchanger-fan unit (ie, presence of heat-conductive aluminum tubing throughout the unit) being present. The circulating water-bath that was connected to the heat exchanger-fan unit was set at approximately 3°C to attain a test chamber air temperature of 10°C ± 2°C for the low-temperature tests. Since the dew point with the low-temperature test chamber configuration was calculated at 4.8°C, any temperature less than 4.8°C would have produced a condensate on the heat exchanger-fan’s aluminum tubing due to the elevated RH, thereby removing moisture from the air. Air measurements taken immediately after sublimation of 5.2 g PF resulted in concentrations between 128 and 532 ppm, much lower than those measured at room temperature. H2CO readily solubilizes in water. 19 Therefore, the condensate formed on the aluminum tubing may have scavenged H2CO from the air, thereby reducing the air concentrations. Abraham et al 20 described having to pay close attention to RH levels during the winter months when decontaminating filter canisters mounted in laboratories. The cold supply-air (introduced from the outside) was heated once inside the laboratory facility (from 10°C to 21°C), thereby decreasing the RH in the air. In the study Abraham et al, which involved 604 separate, large-scale tests with the introduction of more water vapor to increase RH to the prescribed levels during winter, did not result in noticeably higher spore strip failure. Also, Spiner and Hoffmann 2 clearly showed the relationship between RH, H2CO vapor concentration, nature of the material surface, and even lot-to-lot variability with microorganism preparations can greatly affect decontamination efficacy rates. In addition, high RH environmental conditions (≥65%) were responsible for the highest H2CO vapor decontamination efficacies against Bacillus spores as described in comprehensive testing by Abraham et al, 20 as well as in a review of available building decontamination data by the EPA. 21
In this study, H2CO vapor generated from formalin resulted in lower decontamination efficacies than H2CO vapor generated from PF, at the low-temperature condition. Decontamination efficacies (log reduction) of 2.62, 4.43, and 5.48 were achieved with formalin, after 48-hour exposure at ∼10°C, while efficacies of 6.49, 6.72, and 6.84 were achieved with PF, for B.g., B.t., and B.a. spores on concrete coupons, respectively (Figure 9). Efficacy of H2CO vapor generated from formalin was 1.70, 5.05, and 3.82 log reduction for B.g., B.t., and B.a. spores on pine wood coupons, respectively, after a 48-hour exposure at ∼10°C. Comparatively, efficacies of PF-generated H2CO vapor were 3.49, 6.21, and 5.05, respectively, for B.g., B.t., and B.a. spores on pine wood.
Decontamination efficacies from PF were relatively consistent throughout the 5 tests, with low variability at each time-point (Figure 10), compared to higher variability in efficacies from similar conditions in tests using formalin (Figure 11). For both PF- and formalin-generated H2CO vapor, however, decontamination efficacy varied directly with exposure duration (Figures 10 and 11).
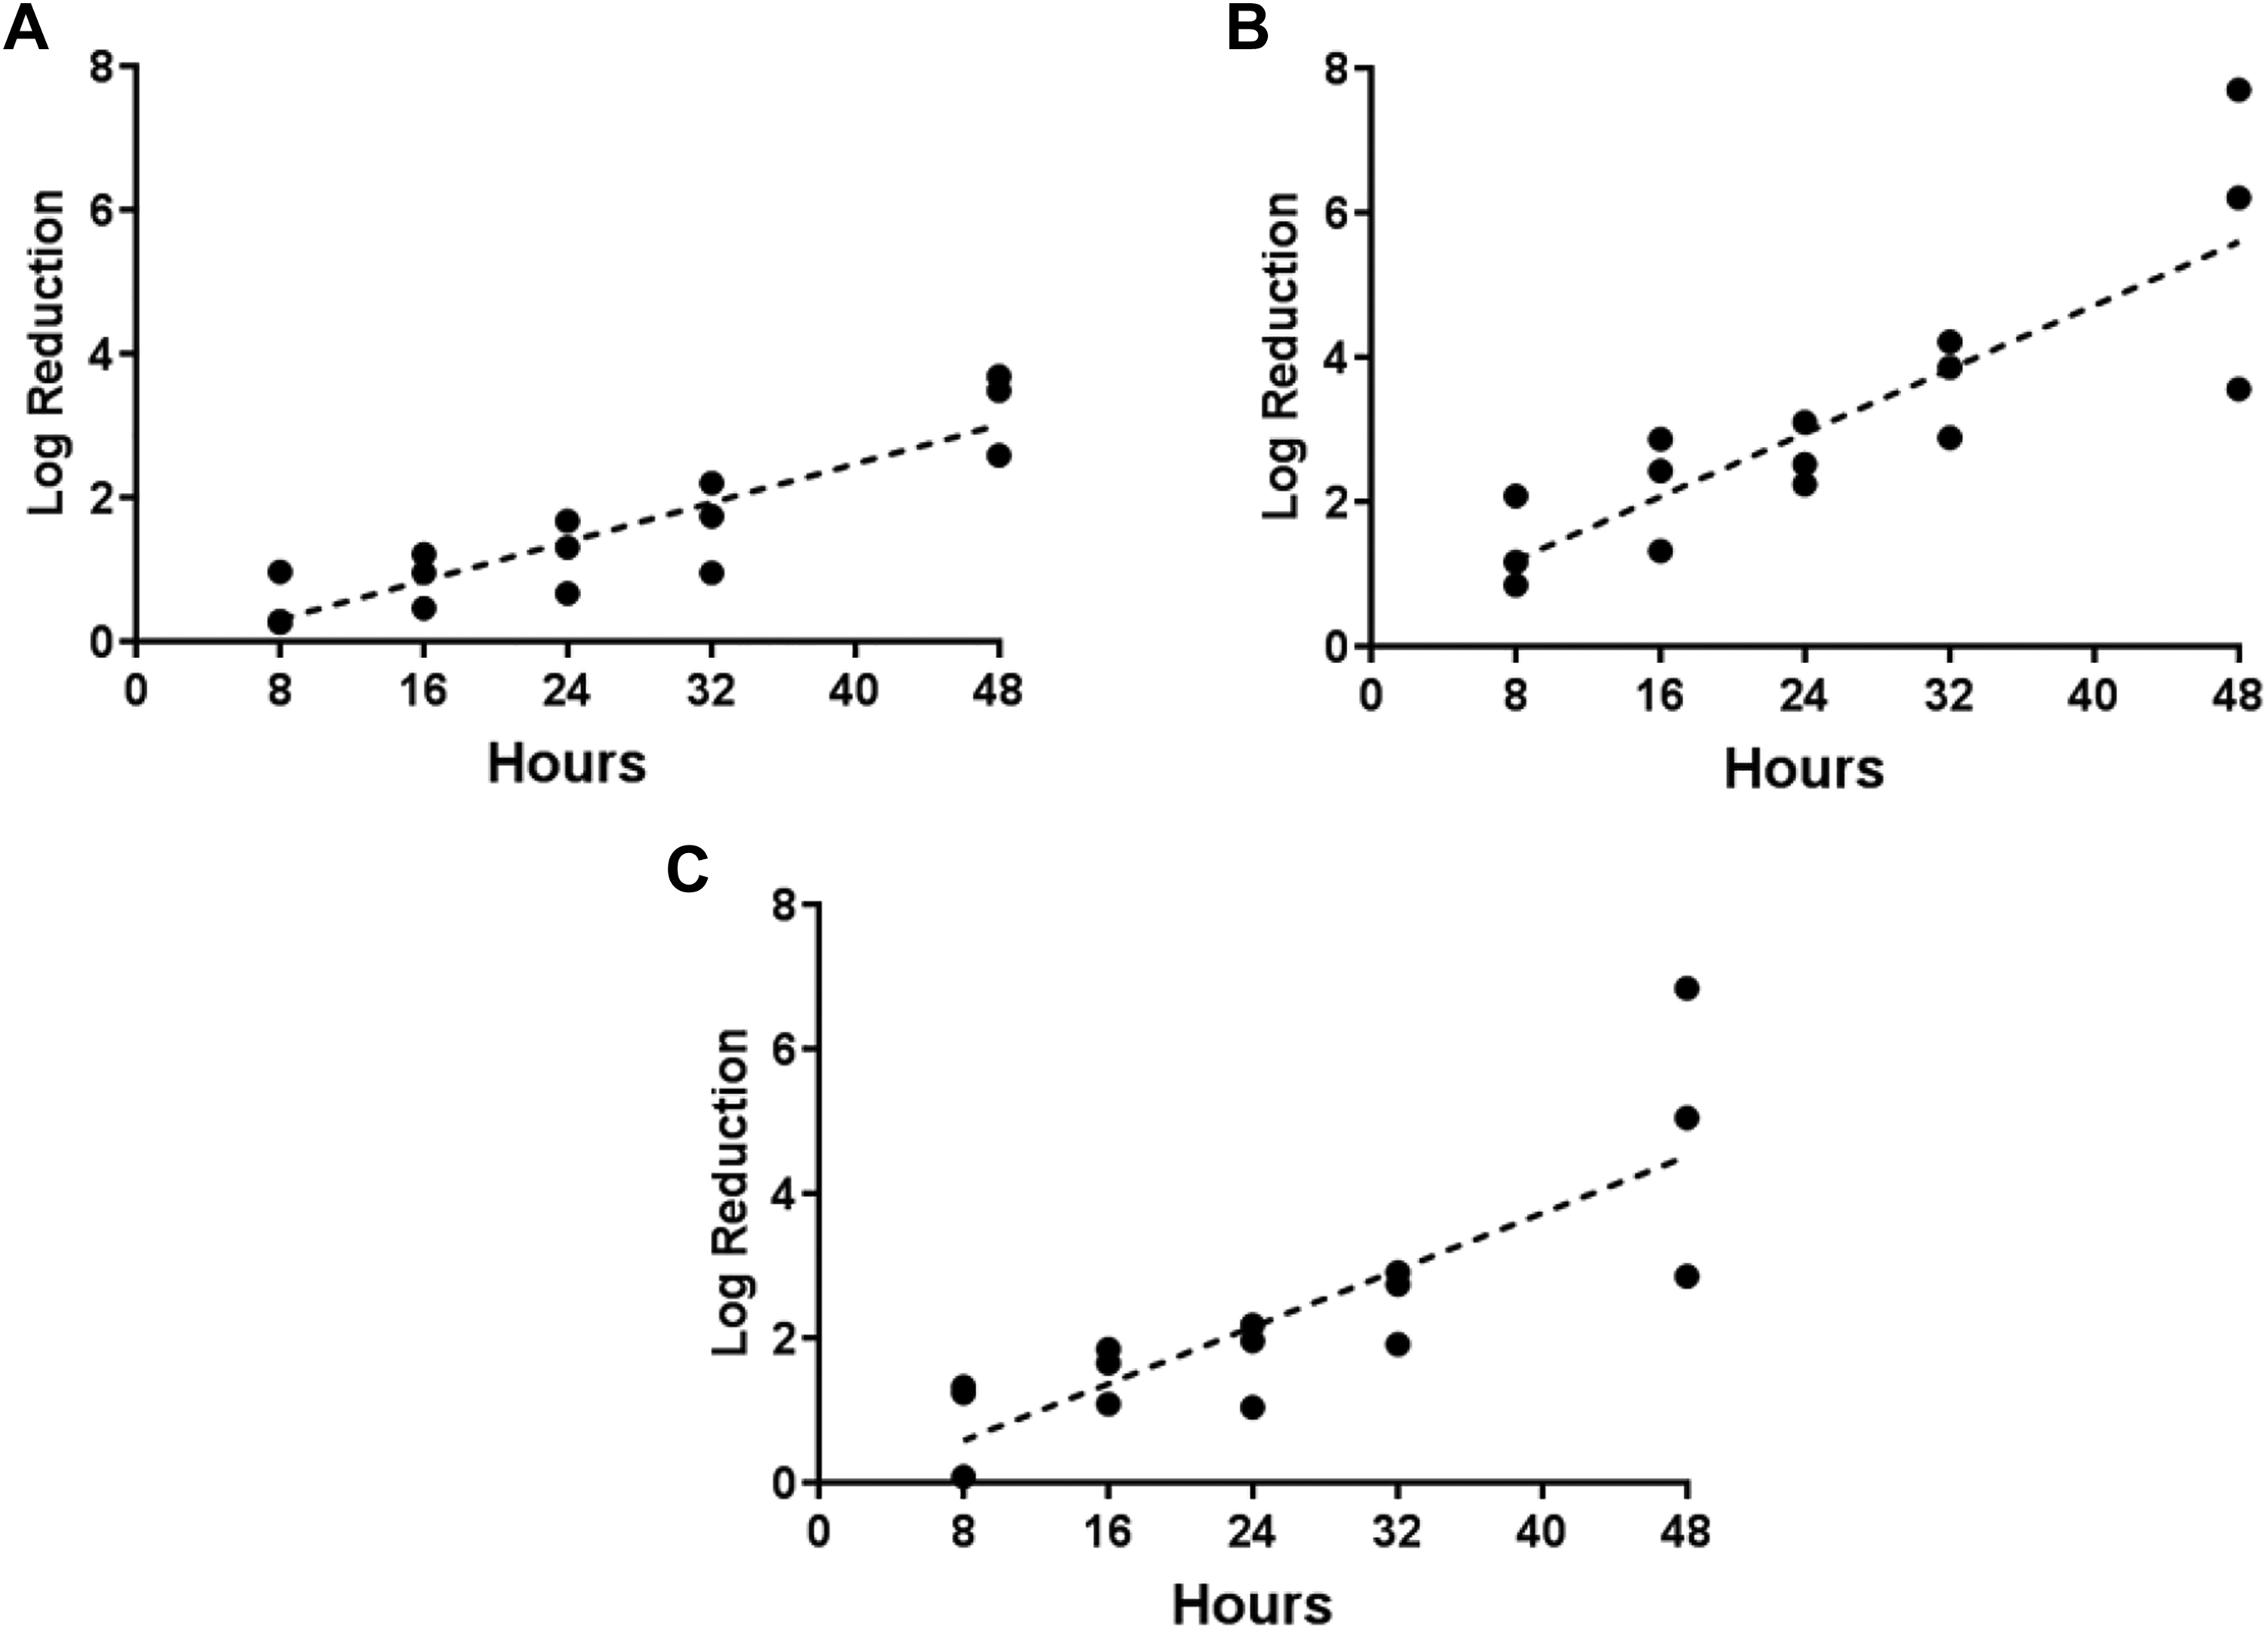
Regression analysis of exposure duration and decontamination efficacy for 3 spore types inoculated on wood from 5 separate tests that used PF to generate H2CO vapor. (A) B globigii on wood, (B) B thuringiensis on wood, (C) B anthracis on wood.
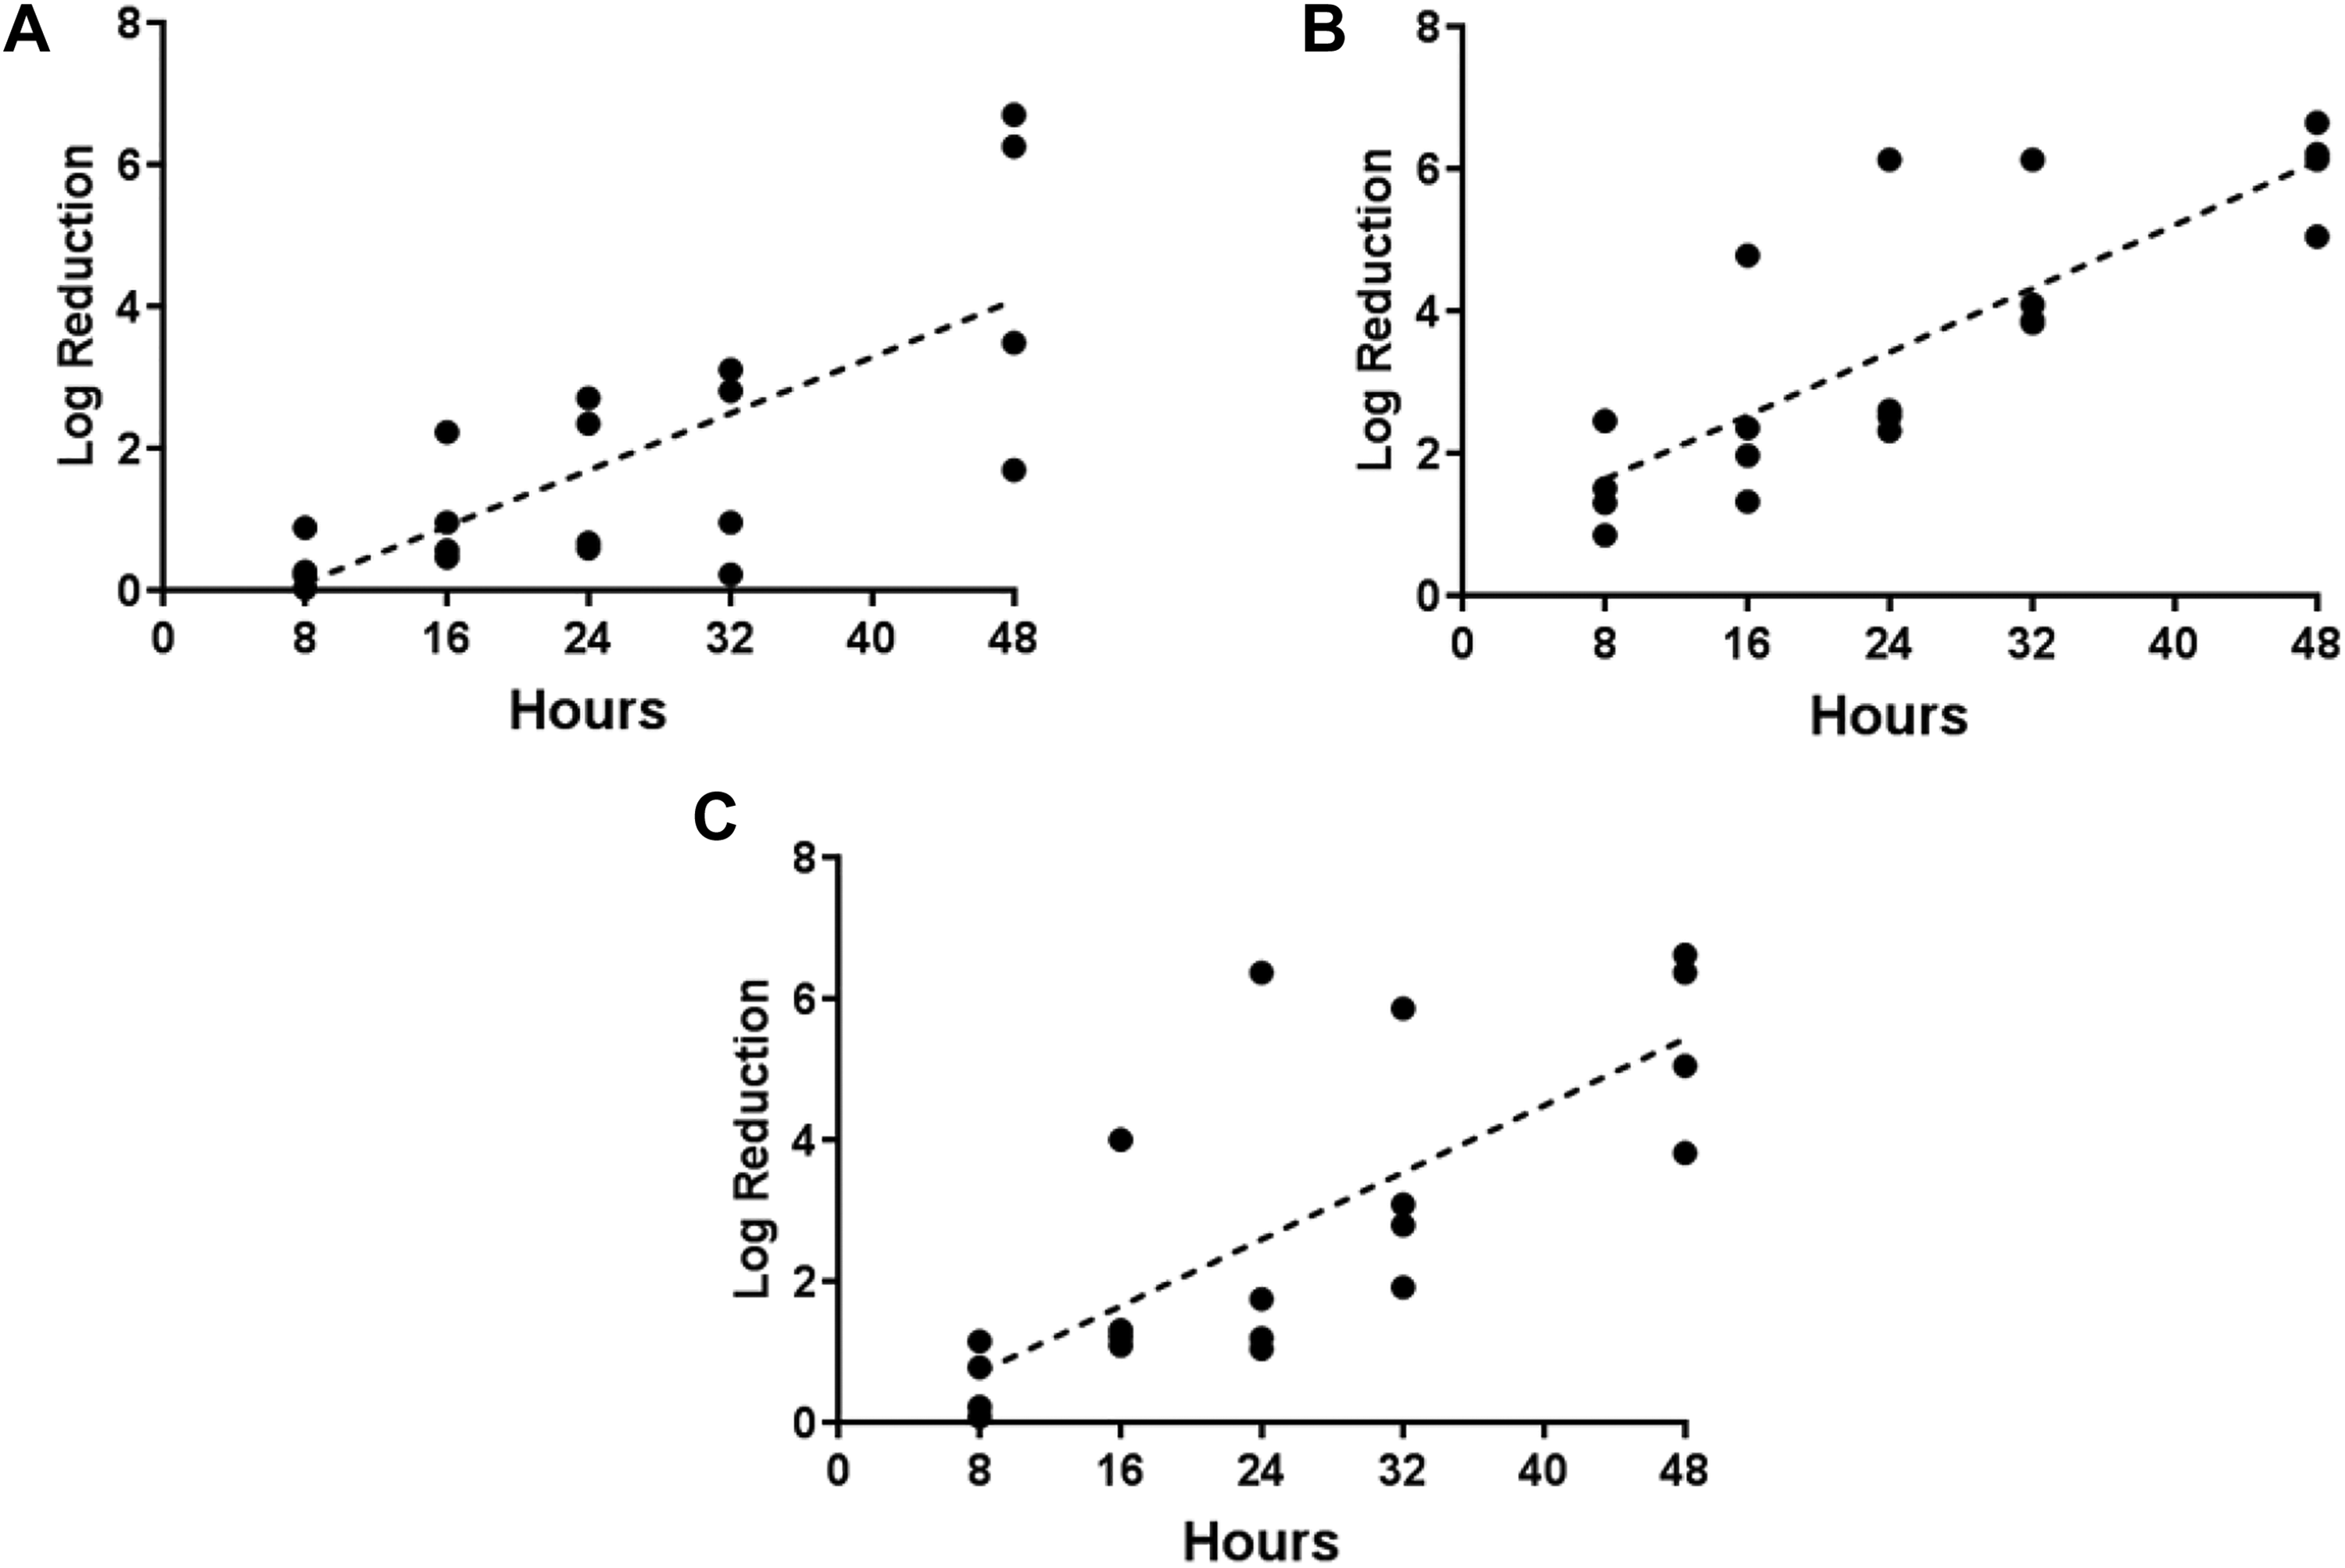
Regression analysis of exposure duration and decontamination efficacy for 3 spore types inoculated on wood from 3 separate tests that used formalin to generate H2CO vapor. (A) B globigii on wood, (B) B thuringiensis on wood, (C) B anthracis on wood.
Another aspect that must be considered was that the Bacillus spores from suspension were dried onto the coupon surface before their exposure to H2CO vapor for this study. The benefit of using a relatively small test chamber was that variables were closely controlled, including the mixture of the air with the heat exchanger and fan to distribute the H2CO vapor throughout the interior. A release that involves dry, aerosolized spores is plausible, 22,23 and the use of a fan to distribute a decontaminant such as H2CO vapor may redistribute contaminants and increase the size of the area contaminated. It is unknown how aerosol-deposited dry spores would respond to H2CO vapor treatments. Further work should be conducted to determine efficacy of H2CO when used to treat surfaces contaminated by dry spore deposition. Each contamination incident may warrant a unique remediation approach.
Conclusions
In most tests, wood was more difficult to decontaminate (lower comparative efficacies) than painted concrete. The only exception occurred when a PF-equivalent mass of formalin for 5.2 g PF was vaporized at approximately 10°C (Test 6, Table 1). Trials conducted with approximately 10°C internal air temperatures (Test Nos. 2, 4, 6, 7, and 8, Table 1) resulted in a precipitous drop in H2CO air concentrations. Regardless of the environmental conditions, a decrease in concentration consistently occurred from time-point 0 hour to 16 hours. At 16 to 48 hours, the concentrations remained relatively consistent for all environmental conditions when using 5.2 g PF, which suggests that an equilibrium was reached at some point before 16 hours for this test chamber configuration.
Variable and unpredictable environmental conditions are expected in the field. Responders who plan on deploying H2CO vapor in a field setting will prescribe a process and predict results based on the data generated in a laboratory at the bench-scale. 24 The bench-scale data presented here demonstrate that environmental conditions can affect H2CO air concentrations and H2CO decontamination efficacies. Careful planning of the decontamination operation, to eliminate potential cold surfaces and prevent condensation-based H2CO loss, is warranted. The surface area-to-volume ratio of the decontamination space should also be minimized to the extent possible, to achieve proper mixing and reduce H2CO loss to surfaces.
Supplemental Material
Supplementary_Tables - Decontamination of Bacillus Spores with Formaldehyde Vapor Under Varied Environmental Conditions
Supplementary_Tables for Decontamination of Bacillus Spores with Formaldehyde Vapor Under Varied Environmental Conditions by Young W. Choi, Michelle M. Sunderman, Martha W. McCauley, William R. Richter, Zachary J. Willenberg, Joseph Wood, Shannon Serre, Leroy Mickelsen, Stuart Willison, Rich Rupert, Jorge G. Muñiz Ortiz, Sara Casey and M. Worth Calfee in Applied Biosafety
Footnotes
Acknowledgments
The authors would like to thank Morgan Q.S. Wendling for her review of this effort, as well as Brian J. O’Shea and Addie E. Moore for their meaningful input on safety practices.
Declaration of Conflicting Interests
The authors declared no potential conflicts of interest with respect to the research, authorship, and/or publication of this article.
Ethical Approval Statement
Not applicable to this study.
Statement of Human and Animal Rights
Not applicable to this study.
Statement of Informed Consent
Not applicable to this study.
Disclaimer
The US Environmental Protection Agency through its Office of Research and Development funded and directed the research described herein under EP-C-16-014 with Battelle Memorial Institute. It has been subject to an administrative review but does not necessarily reflect the views of the Agency. No official endorsement should be inferred. EPA does not endorse the purchase or sale of any commercial products or services.
Funding
The authors received no financial support for the research, authorship, and/or publication of this article.
Supplemental Material
Supplemental material for this article is available online.
References
Supplementary Material
Please find the following supplemental material available below.
For Open Access articles published under a Creative Commons License, all supplemental material carries the same license as the article it is associated with.
For non-Open Access articles published, all supplemental material carries a non-exclusive license, and permission requests for re-use of supplemental material or any part of supplemental material shall be sent directly to the copyright owner as specified in the copyright notice associated with the article.