
Abstract
We present a pipeline in which machine learning techniques are used to automatically identify and evaluate subtypes of hospital patients admitted between 2017 and 2021 in a large UK teaching hospital. Patient clusters are determined using routinely collected hospital data, such as those used in the UK’s National Early Warning Score 2 (NEWS2). An iterative, hierarchical clustering process was used to identify the minimum set of relevant features for cluster separation. With the use of state-of-the-art explainability techniques, the identified subtypes are interpreted and assigned clinical meaning, illustrating their robustness. In parallel, clinicians assessed intracluster similarities and intercluster differences of the identified patient subtypes within the context of their clinical knowledge. For each cluster, outcome prediction models were trained and their forecasting ability was illustrated against the NEWS2 of the unclustered patient cohort. These preliminary results suggest that subtype models can outperform the established NEWS2 method, providing improved prediction of patient deterioration. By considering both the computational outputs and clinician-based explanations in patient subtyping, we aim to highlight the mutual benefit of combining machine learning techniques with clinical expertise.
Keywords
Impact Statement
With the introduction of electronic health records, hospitals are increasingly using automatic processing of real-time patient data to flag potential issues to clinicians. While the National Early Warning Score 2 (NEWS2) is effective at identifying patients with high clinical acuity, it is less reliable at predicting the clinical outcomes of patients with diverse presentations. We argue that including patient subtypes in such scores would be beneficial to increase their accuracy. We demonstrate a pipeline to hierarchically subtype patients in an explainable way, resulting in improved outcome predictions for many of the identified subtypes. Using routinely collected data, this work could be widely applied following further validation across multiple hospital sites. Evaluation is conducted using automatic techniques as well as evaluation by clinicians, furthering the field by increasing trust in the assigned subtypes and utilizing the mutually beneficial relationship between clinicians and machine learning techniques.
Introduction
Admission to hospital can result in vastly different outcomes depending on the level of illness severity, morbidities and response to treatments. 1 Therefore, selecting the right treatment is challenging even when patients are initially diagnosed with the same conditions. Physicians utilize a huge amount of data to determine diagnosis and treatment options, including but not limited to a patient’s medical history and physicians’ expertise and intuition. 1 The introduction of electronic health records (EHRs) mean that more information is available to physicians than ever before and it is accessed with ease. The transition phase from paper records to EHR leads to challenges when analyzing the data and attempting to learn from the heterogeneous population of hospital admissions. 2 As intensive care units (ICUs) are the most data-rich hospital department and the importance of having quick responses to patient deterioration is large, machine learning approaches have mostly focused on these environments.1,3–5 Recent progress has also been made for general wards.6–9
Two areas of high clinical importance which could benefit from developments with EHRs are outcome prediction and risk scoring. Several risk scoring methods have been developed and deployed, for example, Rothman index, 10 MEWS, 11 APACHE IV, 12 and SOFA. 13 These scoring systems typically aim to quantify patient risk in relation to outcomes such as in-hospital mortality, admission to ICU, or cardiac arrest. 14 Supervised machine learning has been applied to directly predict these outcomes15,16 in addition to emergency admissions 17 and readiness for discharge. 5 The NEWS2 18 is a score manually designed by the Royal College of Physicians that assigns weights to clinical observations to detect patient deterioration. NEWS2 is increasingly used in UK hospitals 19 and has good predictive ability in patients with infections and sepsis. 20 However, for respiratory diseases like COVID-19, the results are conflicting.6,21,22 This indicates that to improve the generalization of scores, patients’ similarities must be considered which raises the question: could risk prediction be improved by subtyping patients?
We argue that the predictive ability of scoring systems could be further improved by incorporating patient subtyping that physicians can understand and provide feedback on. Historically, patients were grouped based on their level of sickness, that is, the creation of ICUs. The reorganization presented an innovation, as expertise in caring for the critically ill could be focused on a single location. 23 Instead of focusing on severity of sickness, patients could be further grouped based on their clinical needs. 3 While the categorization of patients into risk levels, like the ICU, and diagnosis groups is useful, there could be subtypes of patients shared between these categories that share characteristics, something which physicians would benefit from knowing.
In a pilot study, non-ICU patients were physically grouped based on similar patient characteristics rather than diagnoses, leading to a reduced admittance of low-risk patients to ICU from 42% to 22%. In addition, the average ICU length of stay was reduced from 4.6 to 4.1 days. 24
Automatic patient subtyping aims to assign patients to clinically meaningful groups using factors such as their disease progression, medical history, EHR, and ultimately paves the path to precision or personalized medicine by tailoring diagnostic and therapeutic strategies to the patient’s needs.2,25 Subtyping can be framed as an unsupervised machine learning task, using clustering methods to identify distinct high-density regions separated by sparse regions within a data set. 26 These clusters represent patients who are in some sense similar according to the data, where the similarity is not always immediately obvious to the practitioner. Clustering algorithms such as k-means and hierarchical clustering have recently been applied to identify clusters in a general ICU population, 3 cardiovascular clusters in sepsis patients, 27 and corticosteroid response in patients with severe asthma. 28
However, clustering alone is insufficient to provide practical support to determine treatment options. The interpretation of the resulting clusters must be validated, by physicians and the cluster assignments predictive abilities.
Before these models can be widely deployed in hospitals, the final users must “trust” the models. This requires an in-depth understanding of the models’ behavior and confidence in individual predictions. 29 Model-agnostic explainability approaches such as LIME and variants 29 can be used for explaining the predictions of clustered data. 30 From these methods, we can gain an understanding into which patient features contribute to each cluster assignment. Utilizing the assigned subtypes must also be validated, as our hypothesis is that patients within a cluster will present similar hospitals stays, that is, length of stay and patient outcome. As such, evaluating the predictive power of the cluster assignments is a must. Building upon the proof-of-concept explainable subtyping process in Werner et al., 31 this article presents a pipeline from subtyping to outcome prediction in which we:
Demonstrate the use of unsupervised machine learning techniques to identify patient subtypes on admission for a data set of hospital patients from a large UK teaching hospital.
Implement a combination of explainability techniques and statistical properties of the clusters to evaluate and assign clinical meaning to the identified subtypes.
In parallel and independently, hospital clinicians derive the main clinical properties of the identified subtypes using additional records, a key and necessary step in developing human in-the-loop machine learning systems in medical settings.
Assess the predictive power of the identified patient subtypes for in-hospital mortality and admission to high-dependency hospital units, in comparison to the unclustered existing NEWS2 scoring system.
Materials and methods
In what follows, subjects are patients who were admitted to the Bristol Royal Infirmary, a large teaching hospital covering most medical and surgical specialties. The clinical characteristics of this historical data source are summarized in Table 1. Only patients were considered for which all considered features were available, that is, six vitals (temperature, systolic blood pressure, heart rate, hemoglobin saturation with oxygen [SATS], respiratory rate, level of consciousness), age at hospital admission, gender and number of attributed Tenth Revision of International Classification of Diseases (ICD-10) codes at hospital admission. Only patients with vitals taken within the first 24 h after hospital admission were considered, and only their first set of vitals was utilized in this study. Patient visits lasting less than 2 h were considered as routine appointments and omitted. Some patients were admitted several times and each admission is considered as an independent event. Patients with restricted or limited level of consciousness are described as “unconscious.”
Clinical characterization of the full data set.
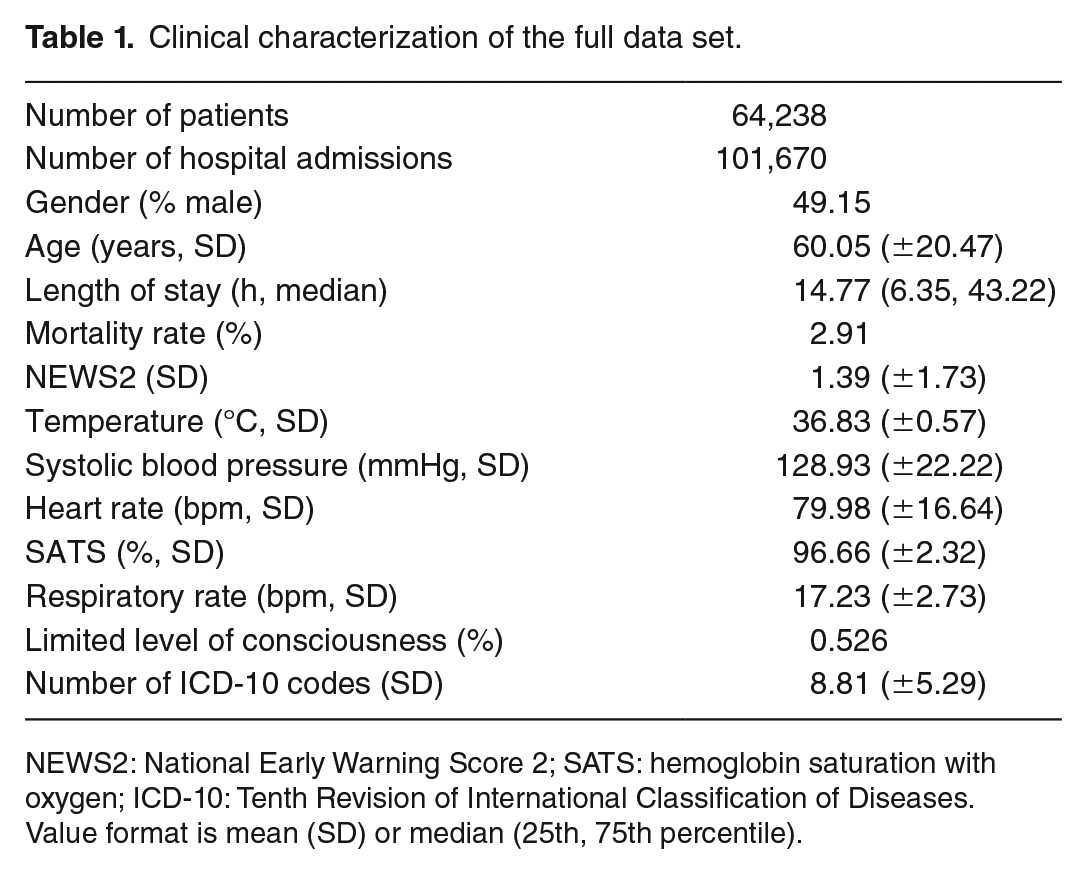
NEWS2: National Early Warning Score 2; SATS: hemoglobin saturation with oxygen; ICD-10: Tenth Revision of International Classification of Diseases.
Value format is mean (SD) or median (25th, 75th percentile).
Clustering process
Cluster identification and feature selection followed an iterative and hierarchical process. First, the entire population was analyzed, characterized, features selected and explained, and then the same processing steps were repeated for the identified clusters (where number of patients ⩾ 1000) individually.
Therefore, each stage followed the same subsequent steps. To simplify the analysis and aid interpretability, dimensionality reduction was performed using Uniform Manifold Approximation and Projection (UMAP) 32 based on the six vitals (temperature, systolic blood pressure, heart rate, SATS, respiratory rate, and level of consciousness), age at hospital admission, gender, and number of ICD-10 codes at hospital admission. The first three vitals were scaled, the latter features were transformed with the logit function. After dimensionality reduction, HDBScan 33 was applied to the embedding to identify clusters. The hyperparameters min_samples (range = 10–100 in steps of 1) and min_cluster_size (range = 20 in 100 steps of 10) for HDBScan were selected based on the fast approximation of the density-based cluster validity (DBSV) score 34 which in return also indicated the optimal number of clusters. Next, surrogate explanations were used to identify the features that did not contribute to the cluster separation and could therefore be excluded in the next iteration. This process was repeated until only contributing features remained. This pipeline is visualized in Figure 1.
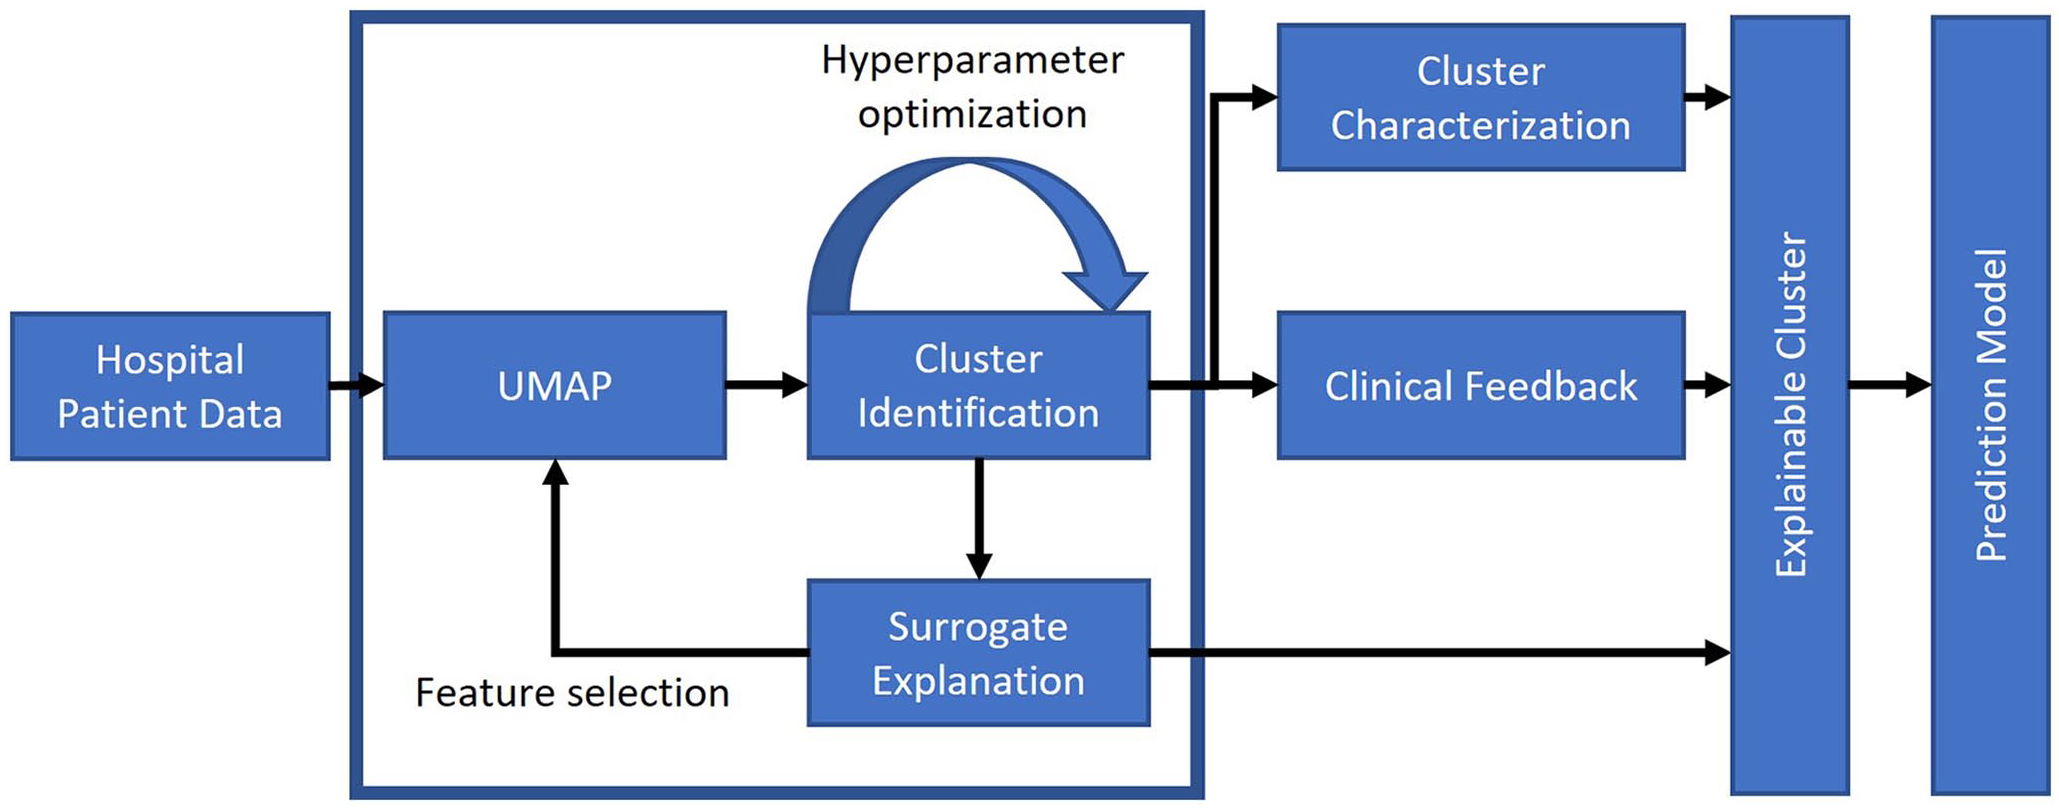
Pipeline overview, from data set import to generation of explainable clusters and clinical outcome predictions. The blue box denotes the iterative clustering process.
Subclustering results are only presented for the clusters containing the lowest and highest numbers of subclusters.
Clustering explanations
Understanding how and why patients were clustered is a fundamental requirement to establish clinical trust and ultimately reduce the risk of unintended harm. Each feature’s contribution for the cluster assignment of each patient was determined using a surrogate explainer to estimate the local decision boundary between the assigned cluster and the rest of the data. A total of 25,000 samples were generated around a query point and using the TabularBlimeyTree decision tree explainer 35 within FAT Forensics (v0.1.1): an open source toolbox, 36 a surrogate model was fit in order to predict the cluster assignment of the samples. Once fitted, feature importance can be determined from the weights within the surrogate model. Input features were the scaled features. The probabilistic argument was set to false. Default arguments and settings were otherwise used. All generated samples were visualized in the embedding space to ensure that they approximately followed the distribution of the underlying data.
Outcome prediction
Clustering identifies patient subtypes that are more homogeneous and could result in improved outcome predictions. In this preliminary analysis, the same nine features employed for initial clustering were applied for outcome prediction and with the same feature scaling regime. Gender was one-hot encoded. Predictions were made using logistic regression classification models for two targets: in-hospital mortality and admission to higher care units within the hospital stay, comprising general ICU, cardiac ICU, and the critical care unit. Data were split 80:20 for training and testing with stratified sampling for the two targets. Class_weight was “balanced,” all other hyperparameters were as default, and hence, no validation set was required. All outcome prediction analysis was in Python 3.9.11, with models and performance metrics implemented using scikit-learn 1.0.2.
For comparison purposes, the predictive power of NEWS2 was assessed. For cases during the study window for which NEWS2 was recorded (n = 77,731), values were normalized by dividing by the maximum NEWS2 score. The optimum threshold for binarizing the prediction for each target was computed by maximizing the F1 score in the training set for all patient stays and this threshold was used to compute performance in the test set.
Clinical evaluation
Clinical validation was conducted by providing two intensive care clinicians with the cluster characterization and occurrence of ICD-10 codes for each cluster (Figures 3 to 5). The clinicians assessed and evaluated intracluster similarities and intercluster differences according to both the data and their clinical knowledge (Figure 1). Blinded to the surrogate clustering explanations, clinicians independently assigned a clinically meaningful name and description to each cluster, highlighting which input features resulted in each cluster’s unique characteristics. Thereafter, the features described by the clinicians were compared against those computed automatically.
Results
Cluster characterization
The data extracted between November 2017 and March 2021 comprised 116,004 cases (70,452 patients). Of these, 101,670 cases (64,238 patients) had all vitals taken within the first 24 h of their ⩾ 2 h hospital stay and were included in the study.
Dimensionality reduction and clustering of the entire population revealed eight clusters and a group of unclusterable patients (Figure 2, summarized in Tables 2 and 3). Clusters 0 and 1 are separated from the other clusters, while clusters 2–7 are closer together, joined via patients our clustering algorithm deemed as unclusterable patients. Subclustering was performed on all clusters except for clusters 4 and 6 as both contained less than 1000 patients (Table 3).
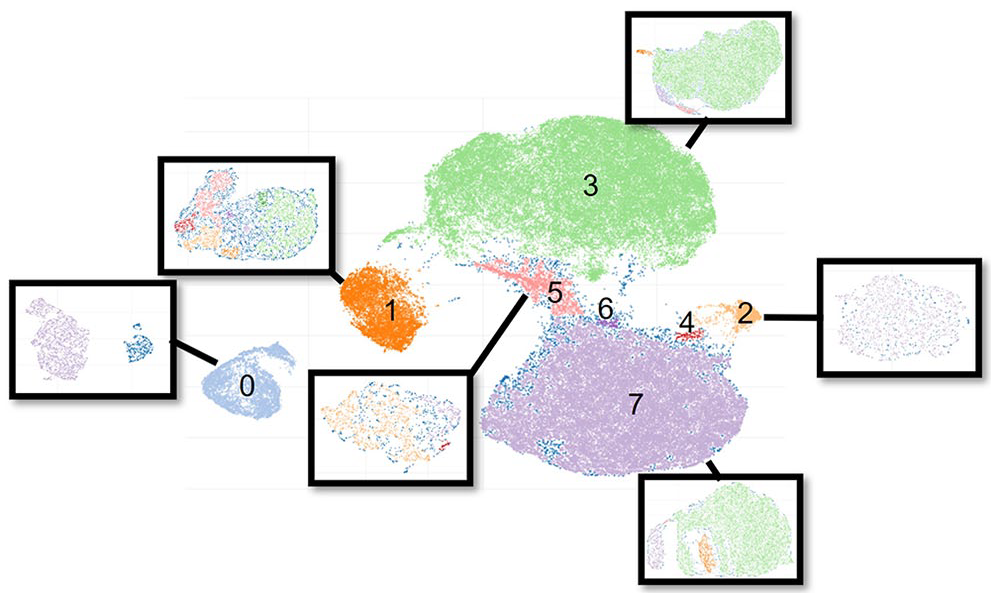
Patients mapped onto the two-dimensional embedding space after dimensionality reduction and clustering. Clusters inside black boxes depict the subclustering results. Subclustering was not performed for clusters 4 and 6 as both contained less than 1000 patients. Unclusterable patients are shown in dark blue, often at the edges of clusters.
NEWS and features of identified clusters of the full data set.
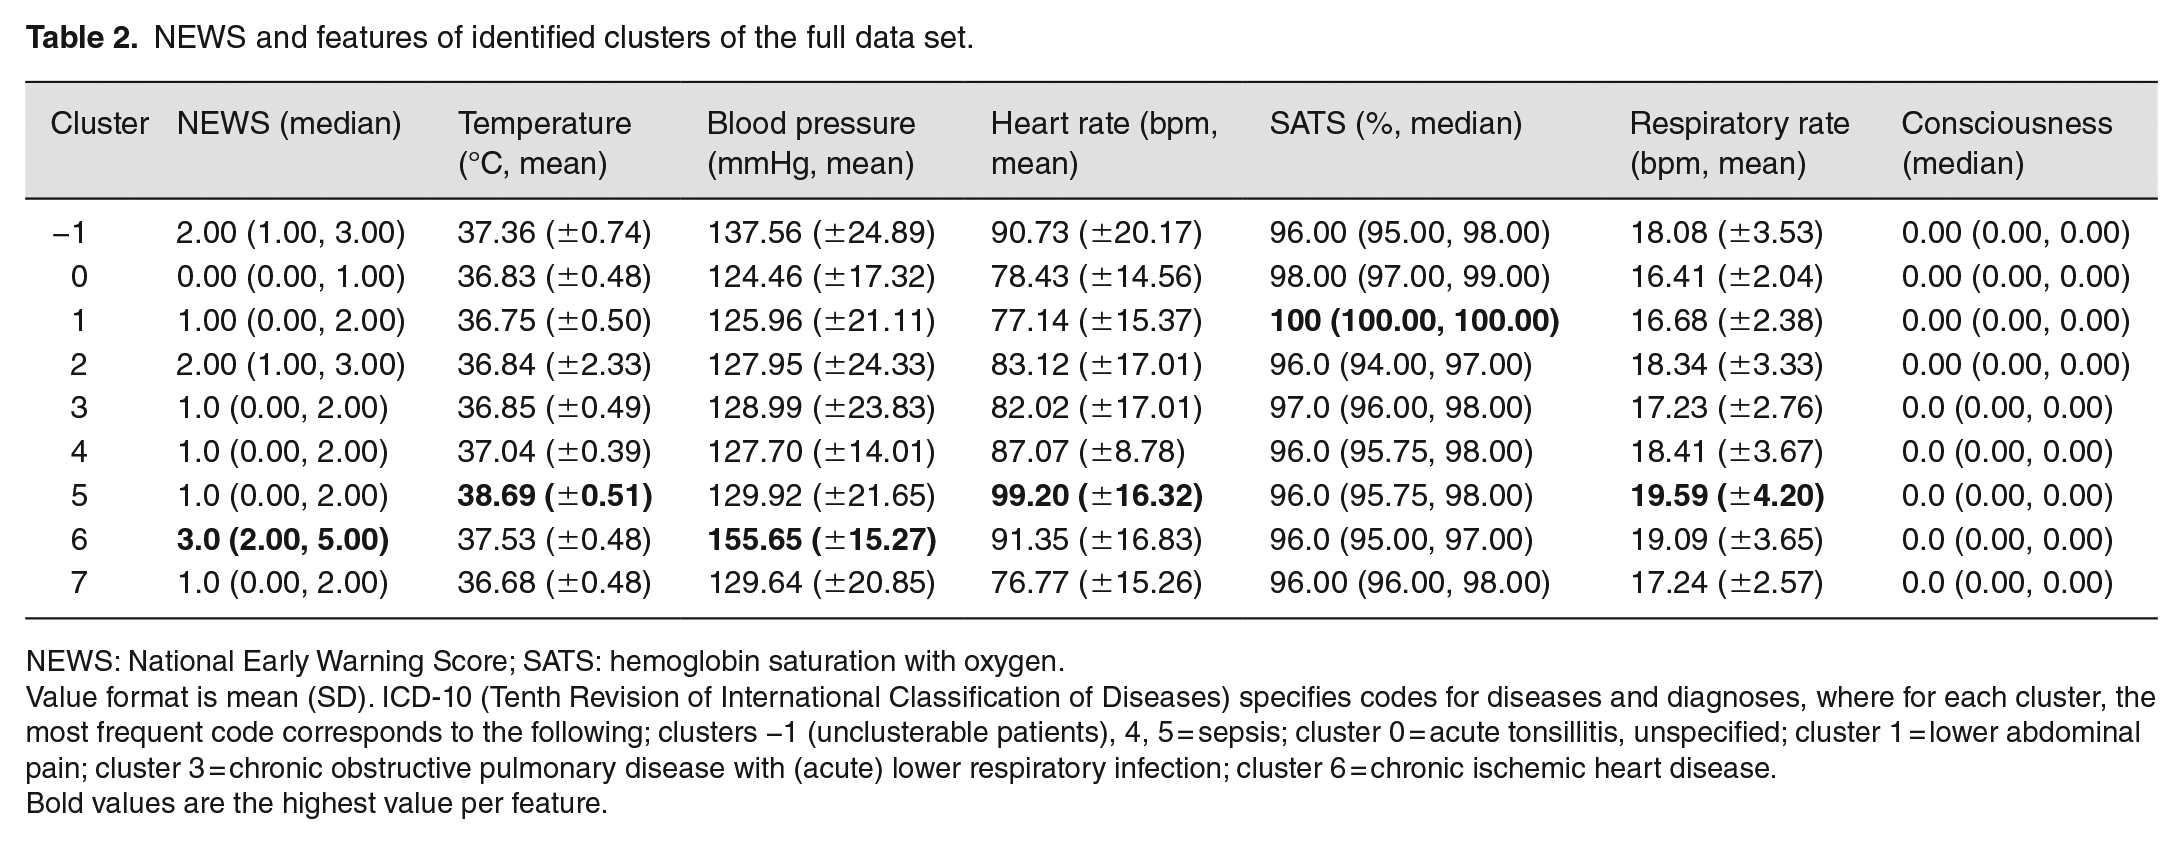
NEWS: National Early Warning Score; SATS: hemoglobin saturation with oxygen.
Value format is mean (SD). ICD-10 (Tenth Revision of International Classification of Diseases) specifies codes for diseases and diagnoses, where for each cluster, the most frequent code corresponds to the following; clusters −1 (unclusterable patients), 4, 5 = sepsis; cluster 0 = acute tonsillitis, unspecified; cluster 1 = lower abdominal pain; cluster 3 = chronic obstructive pulmonary disease with (acute) lower respiratory infection; cluster 6 = chronic ischemic heart disease.
Bold values are the highest value per feature.
Cluster characterization of the full data set.
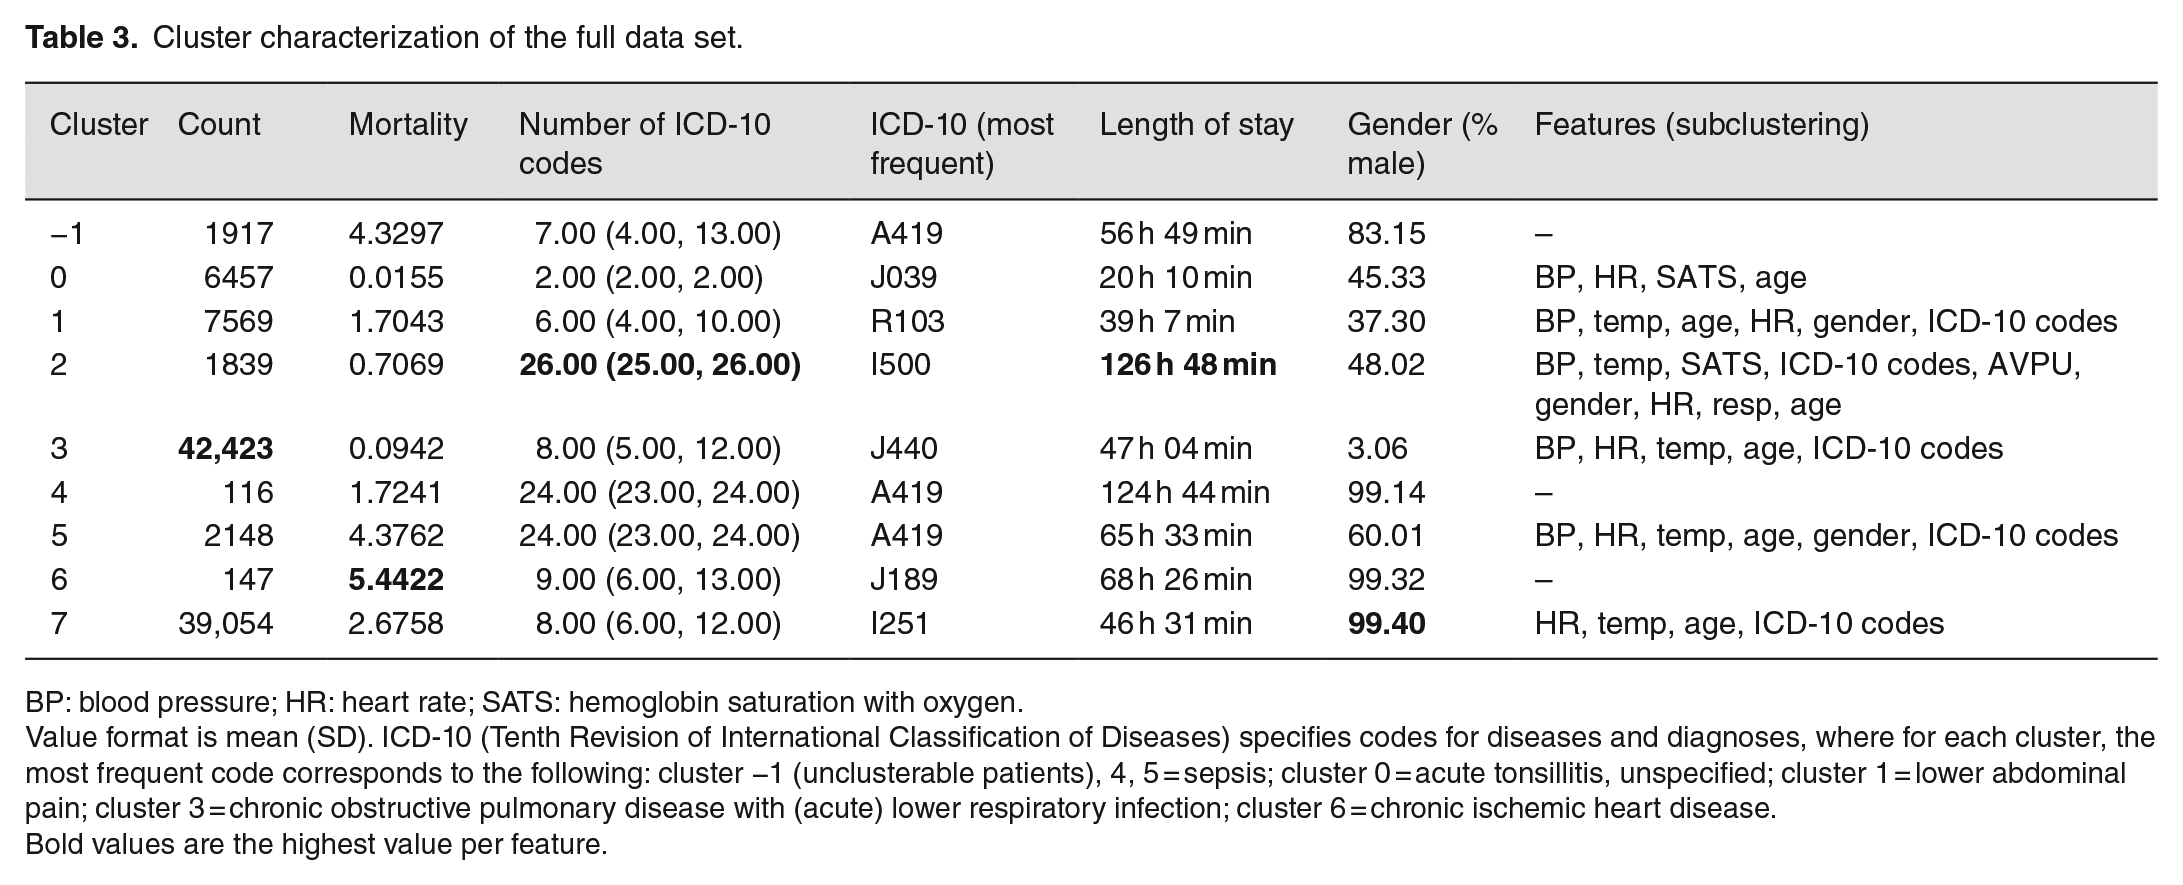
BP: blood pressure; HR: heart rate; SATS: hemoglobin saturation with oxygen.
Value format is mean (SD). ICD-10 (Tenth Revision of International Classification of Diseases) specifies codes for diseases and diagnoses, where for each cluster, the most frequent code corresponds to the following: cluster −1 (unclusterable patients), 4, 5 = sepsis; cluster 0 = acute tonsillitis, unspecified; cluster 1 = lower abdominal pain; cluster 3 = chronic obstructive pulmonary disease with (acute) lower respiratory infection; cluster 6 = chronic ischemic heart disease.
Bold values are the highest value per feature.
Using surrogate explanations, features contributing to cluster separation were identified and irrelevant features excluded. Within three iterations of this process, the final set of features was established (Figure 9). When repeating this process for subclusters, subclusters 1C and 1E required only one and two iterations, respectively.
Subclustering disclosed multiple clusters, ranging from two new clusters (Figure 2, cluster 0) to eight new clusters (Figure 2, cluster 1). Subclustering of cluster 2, however, did not reveal any new clusters and only distinguished clustered patients from unclusterable patients. The degree of unclusterable patients varied from 0% in cluster 0 to 38.6% in cluster 1. The variations in the degree of unclusterable patients are also reflected in the DBSV score. While clustering the entire population revealed a DBSV = 0.5442, subclustering affected the DBSV score positively (0 = 0.8742, 3 = 0.7895, 5 = 0.6976) and negatively (1 = 0.4310, 2 = 0.4165, 4 = 0.4248). Below, clusters 0 and 1 were chosen as examples as they represent the extremes of the lowest and highest number of unclustered patients and subclusters.
Cluster visualization and vitals
A goal of analyzing the individual clusters is to identify their unique characteristics relative to each other and the overall population. Figure 3 shows the difference in measurements for each cluster relative to the overall population. Figures 4 and 5 show the same but for the identified subclusters of clusters 0 and 1, respectively.
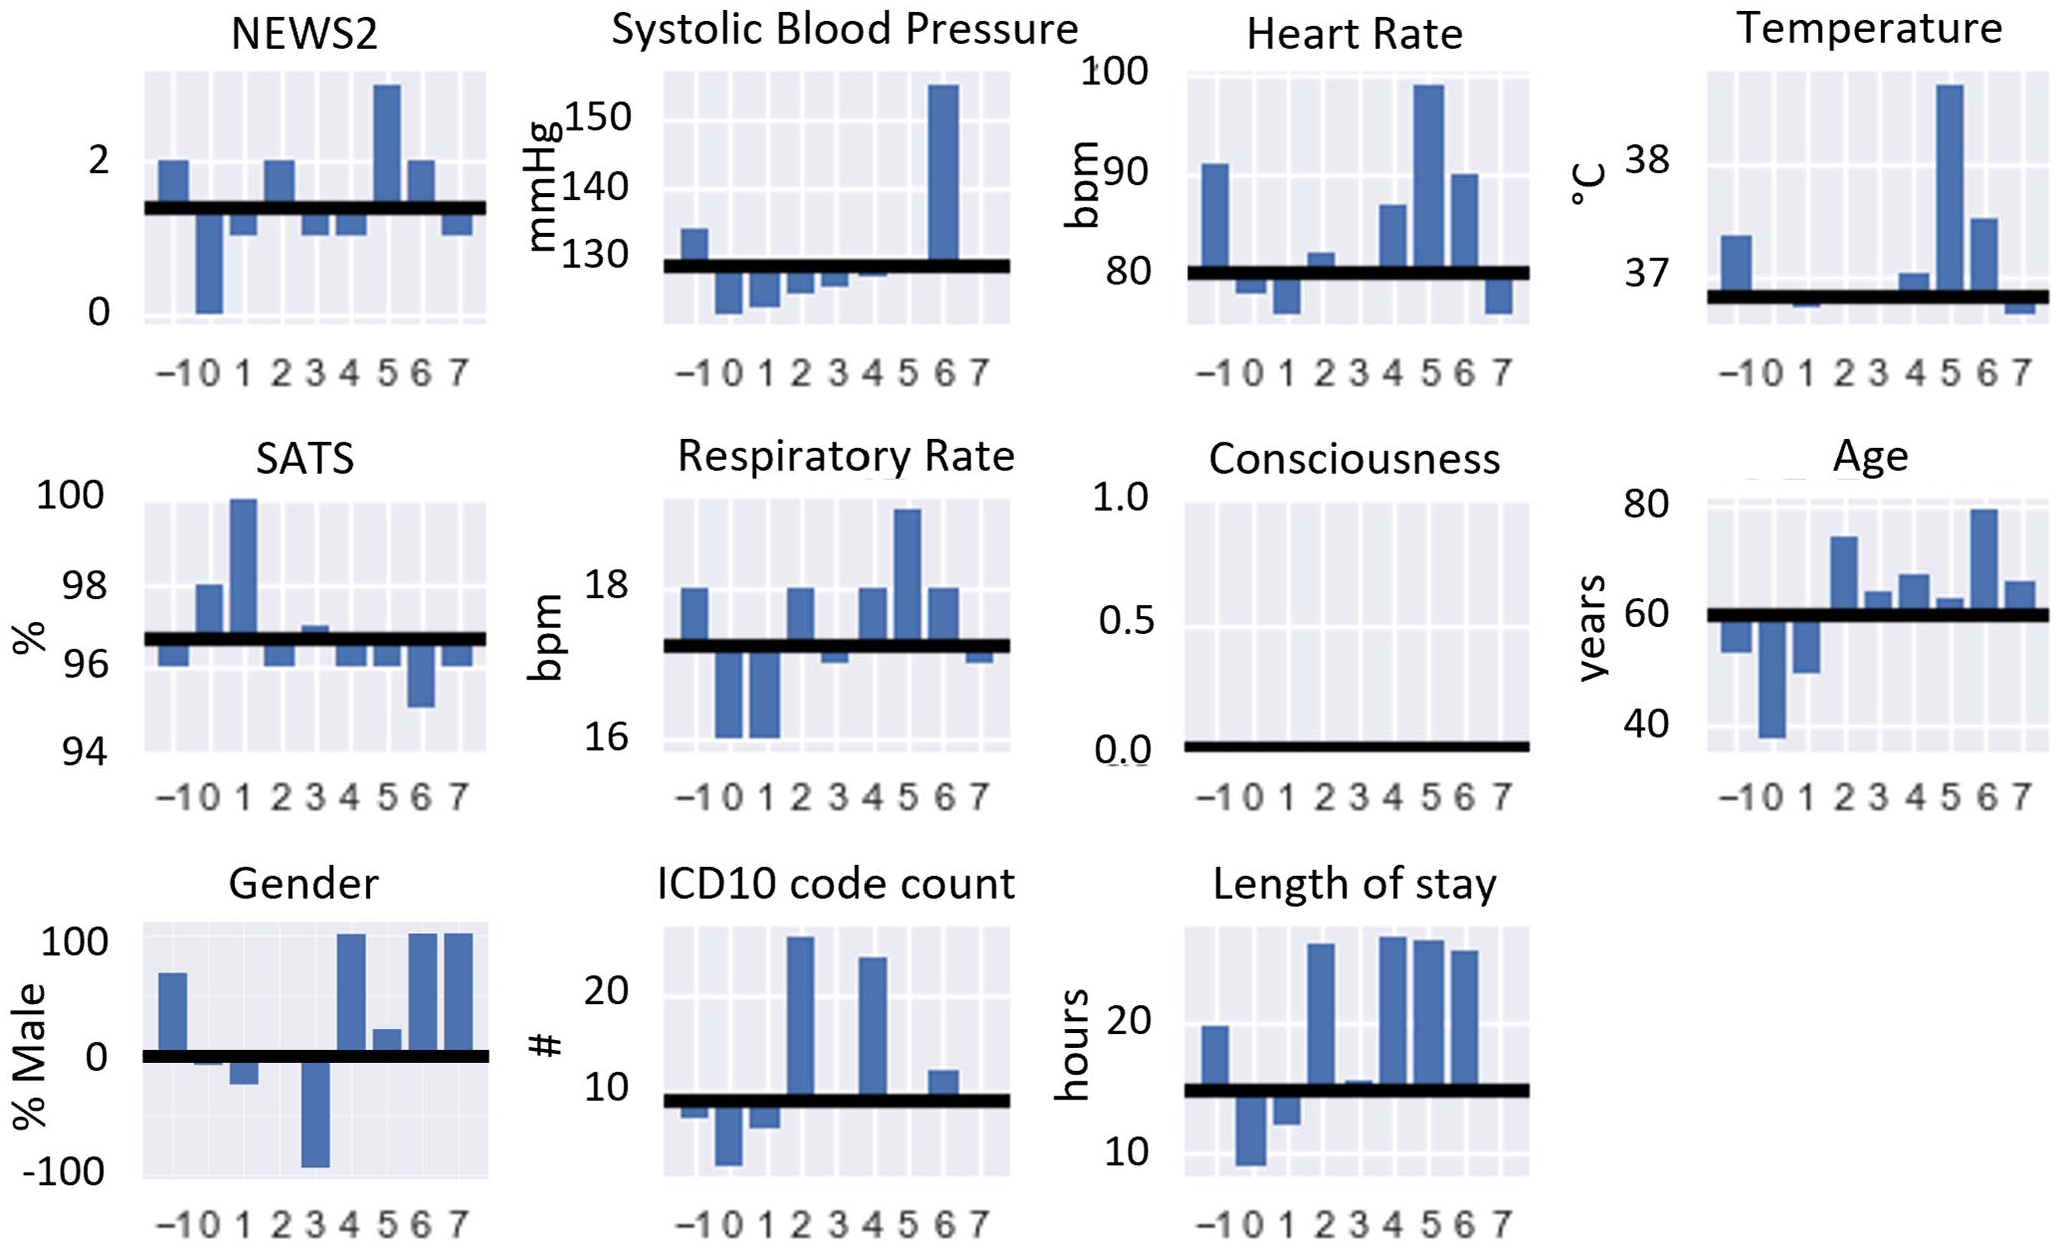
NEWS, vitals, age, gender, ICD-10 code count, and length of stay for individual clusters from clustering the entire population. The mean value of each cluster is compared to the mean or median value depending on the feature (black line) of the whole population.
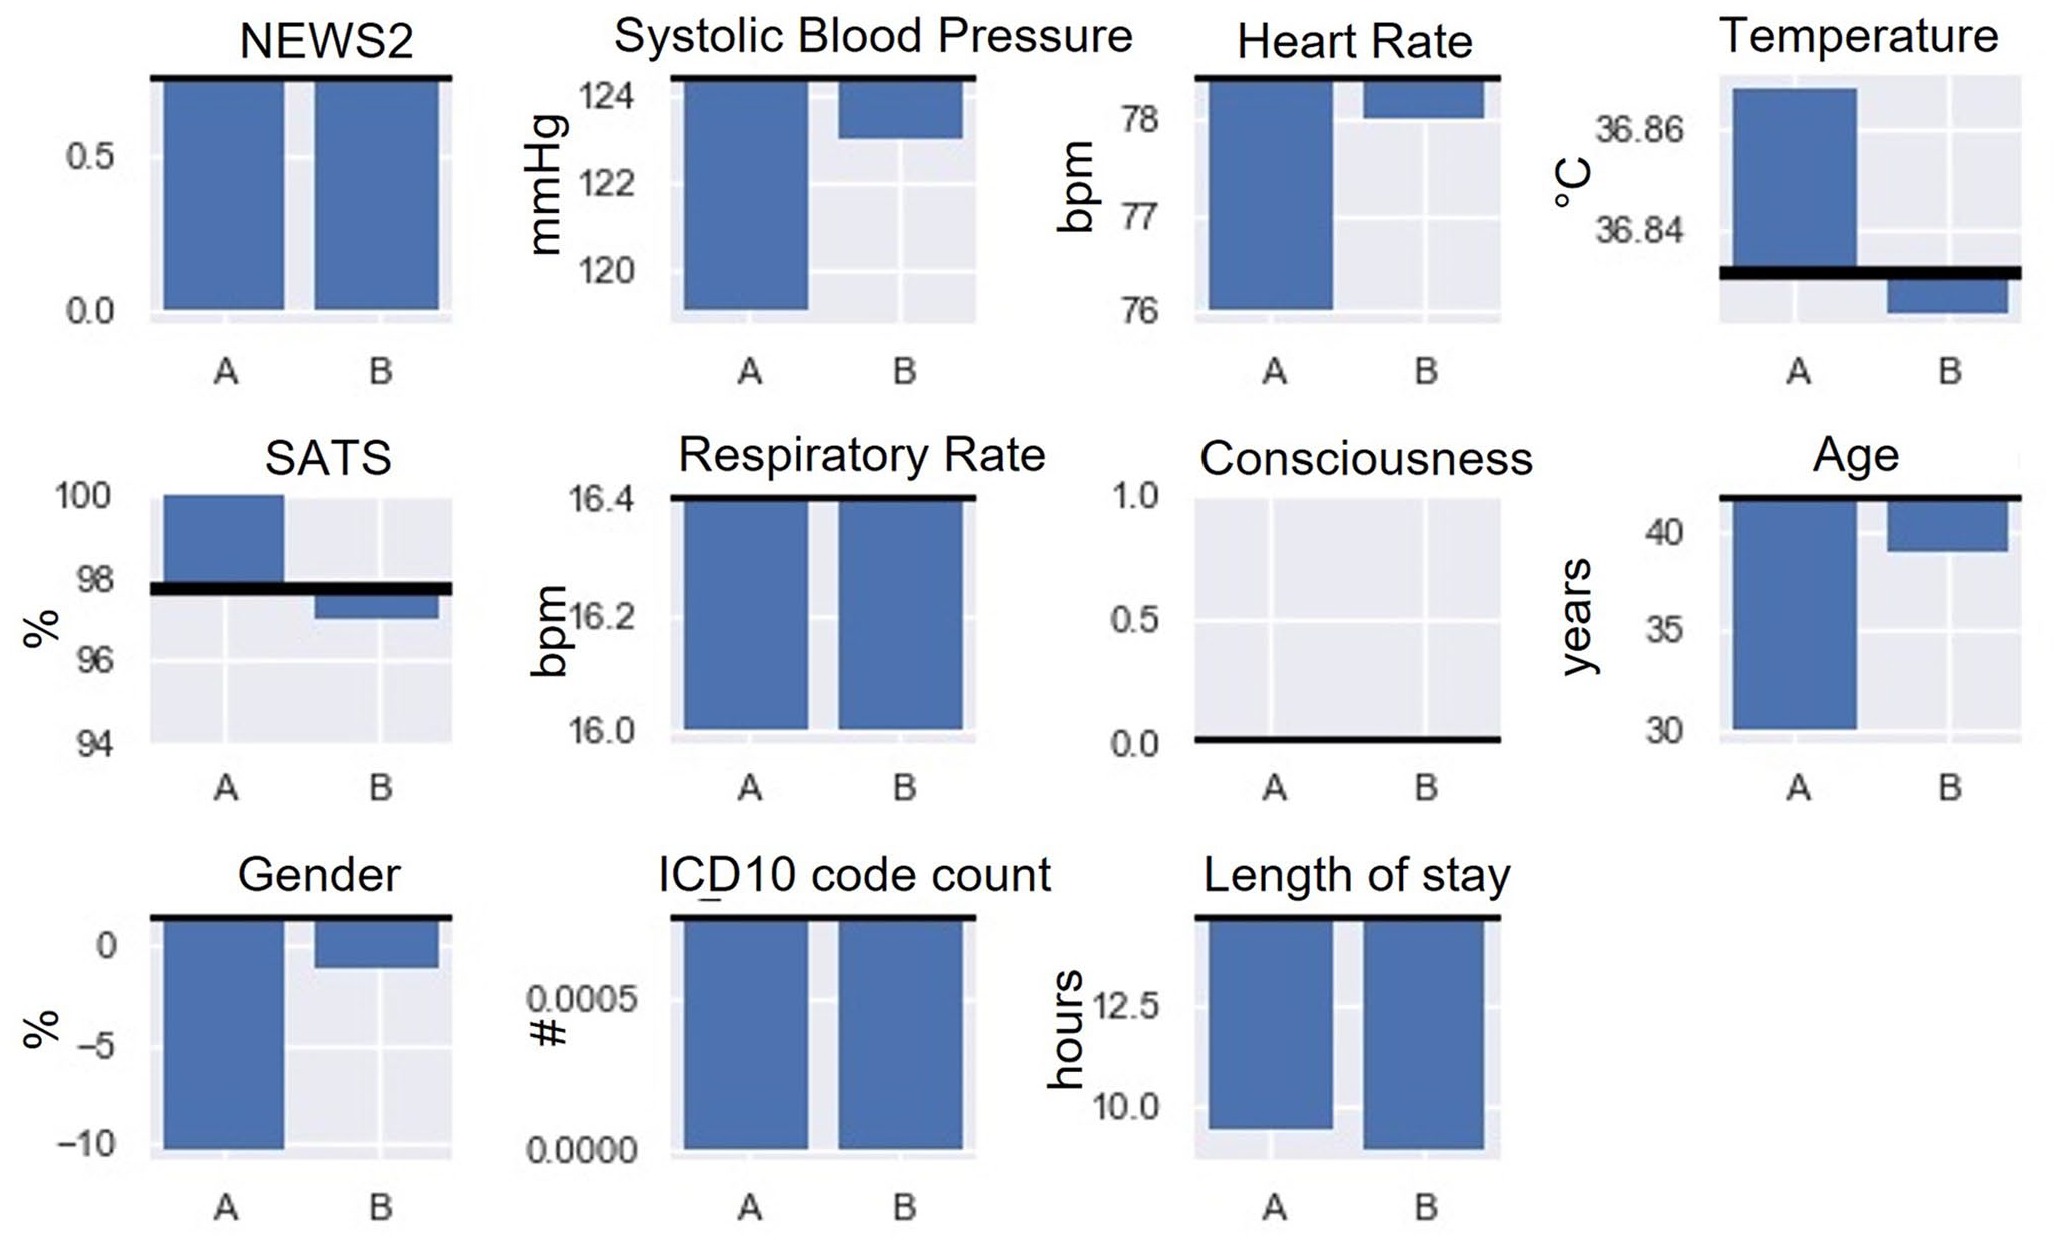
NEWS, vitals, age, gender, ICD-10 code count, and length of stay show the subclustering results for cluster 0. The mean value of each cluster is compared to the mean/median value (black line) of the parent cluster.
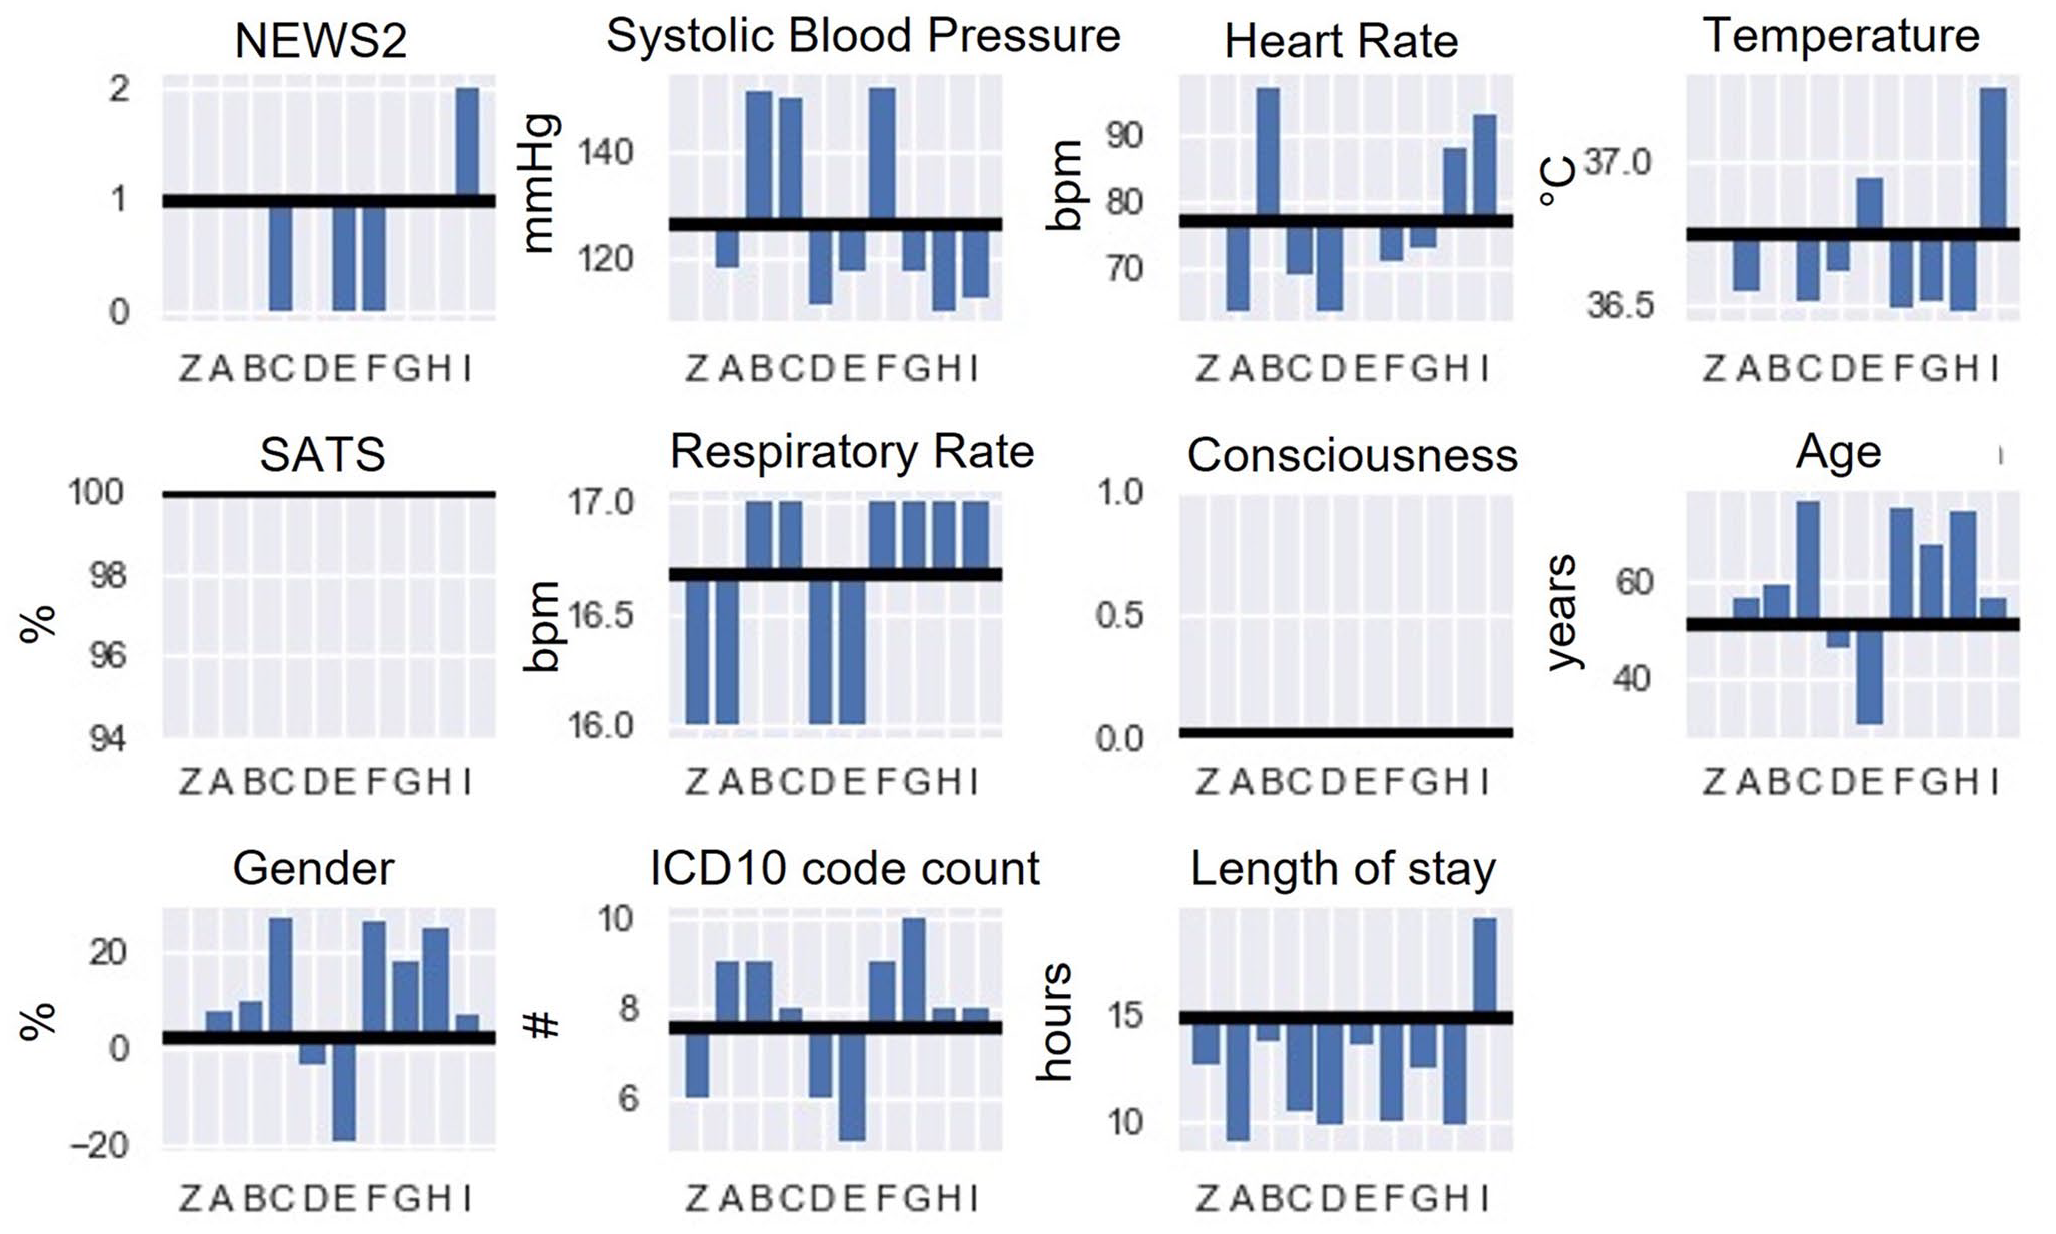
NEWS, vitals, age, gender, ICD-10 code count, and length of stay show the subclustering results for cluster 1. The mean value of each cluster is compared to the mean/median value (black line) of the parent cluster.
The vast majority of patients in the population (Figure 3) are male in clusters 2 and 6, whereas cluster 0 is predominantly female. The average length of stay is the longest for the unclusterable patients and in clusters 6, 2, 5, and 4 (in ascending order). Although patients in cluster 5 are close to the population average age, this cluster contains patients with the highest temperature, heart rate, respiratory rate which is also reflected in the highest NEWS2. In contrast, cluster 0 has the youngest population, with the lowest respiratory rate, the lowest blood pressure, and the lowest NEWS2. Consequently, the median length of stay is also the shortest. Patients are the oldest in cluster 6, with by far the highest blood pressure and the lowest SATS. Unclusterable patients (“−1”) are mostly male and have elevated temperature, systolic blood pressure, heart rate, and respiratory rate, hence the increased NEWS2.
Cluster 0 (Figure 4) consists of two subclusters in which all patients could be assigned to a cluster; therefore, no unclusterable patients were identified. While the median NEWS2, mean respiratory rate, and count of ICD-10 codes are equal for both clusters, cluster 0A contains much younger patients than 0B and approximately 34% more likely to be female. In addition, 0A has a 4.5% longer median hospital stay, and approximately 90% increase in a limited level of consciousness and a lower systolic blood pressure.
Nine subclusters and a group of unclusterable patients were identified in cluster 1 (Figure 5). All identified subclusters have the same median SATS of 100%, and subclusters 1B, 1C, 1F, 1G, 1H, and 1I have an increase of approximately 6% in respiratory rate. Cluster 1C has the oldest population and is mostly female. Compared to the rest of the subpopulation, the temperature is marginally lower, and the number of ICD-10 codes increased by ~32%. Patients have the longest hospital stay in cluster 1I and the highest median NEWS and temperature. Yet, they are also most likely to be conscious.
ICD-10 codes
Figure 6 shows the frequency of identified primary ICD-10 code groupings per cluster. The highest incidence ICD-10 code group is “Circulatory system (I00–I99)” with 29%, 28%, and 27.0% in clusters 2, 4 and 7, respectively.
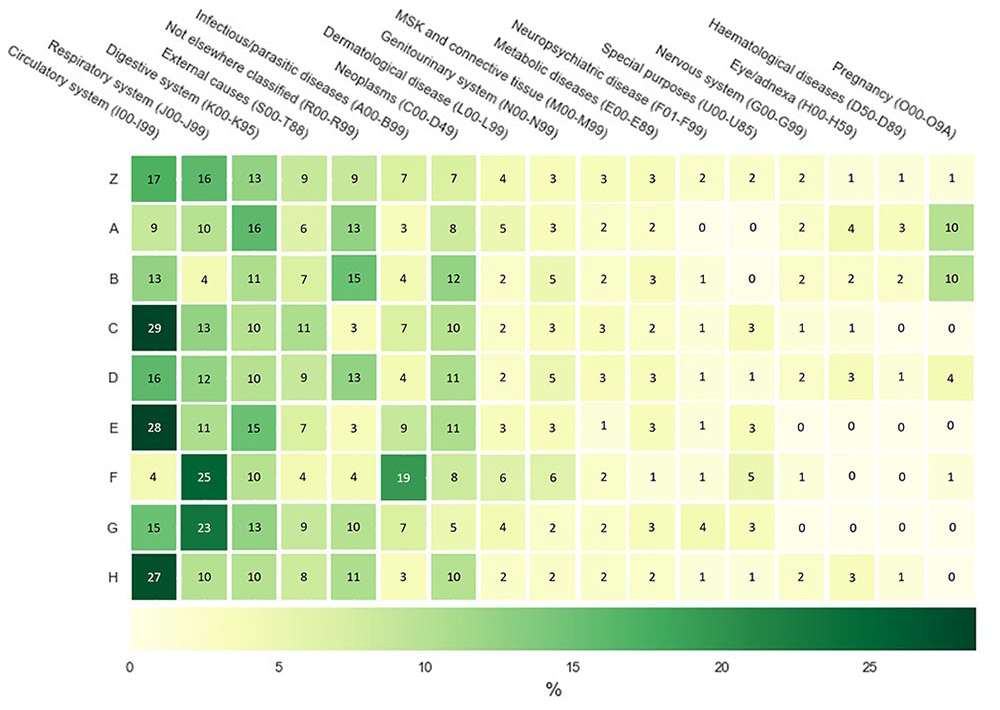
Heatmap of primary ICD-10 codes of full-population clustering and collated by top-level grouping. For display purposes, only ICD-10 codes with ⩾ 2% incidence for at least one cluster are displayed. Since only a subset of ICD-10 codes are visualized, each row does not add up to 100.
Diseases of the “respiratory system (J00–J99)” are common in clusters 5 (25%) and 6 (23%), with approximately twice times higher occurrence than in the other clusters. “Infectious/parasitic diseases (A00–B99)” are mostly in cluster 5 (19%) with the second closes being in cluster 4 with 9%. “Pregnancy-related (O00–O9A)” patients are almost exclusively found in clusters 0 and 1. In contrast to the other ICD-10 code groups, “digestive system (K00–K95)” is relatively equally split between all clusters, ranging between 10% and 16%.
The ICD-10 codes for the identified subclusters of clusters 0 and 1 are distributed differently. For cluster 0’s subclusters (Figure 7), the most prominent ICD-10 code is “Pregnancy-related (O00–O9A)” with 22% in cluster 0A. This is followed by “Digestive system (K00–K95)” with 15% and “Not elsewhere classified (R00–R99)” with 13%. These two are also the most relevant ICD-10 codes in cluster 0B with 16% and 12%, respectively.
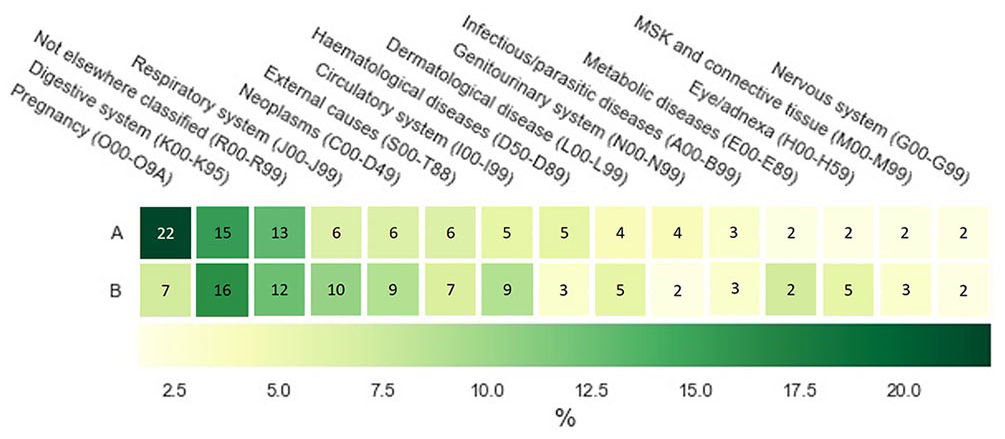
Heatmap of primary ICD-10 codes of the subclusters of cluster 0 as recorded by clinicians at the time of patient admission and collated by top-level grouping. For display purposes, only ICD-10 codes with ⩾ 2% incidence for at least one cluster are displayed. Since only a subset of ICD-10 codes are visualized, each row does not add up to 100.
For cluster 1 (Figure 8), “Not elsewhere classified (R00–R99)” is common occurring in 15% of unclustered patients (1Z), followed by “Neoplasms (C00–D49),” “Digestive system (K00–K95),” and “Circulatory system (I00–I99)” with 13%, 13%, and 12%, respectively. “Neoplasms (C00–D49)” is overall the most common ICD-10 code and has a value of 31% in clusters 1A and 1H. “Pregnancy (O00–O9A)”-related cases appear almost exclusively in 1E with 25%. “Circulatory system (I00–I99)” patients are mostly common in clusters 1F, 1G, and 1C with 29%, 21% and 21%, respectively. Whereas “Infectious/parasitic diseases (A00–B99)” range mostly between 2% and 4%, cluster 1I is an exception with 14%.
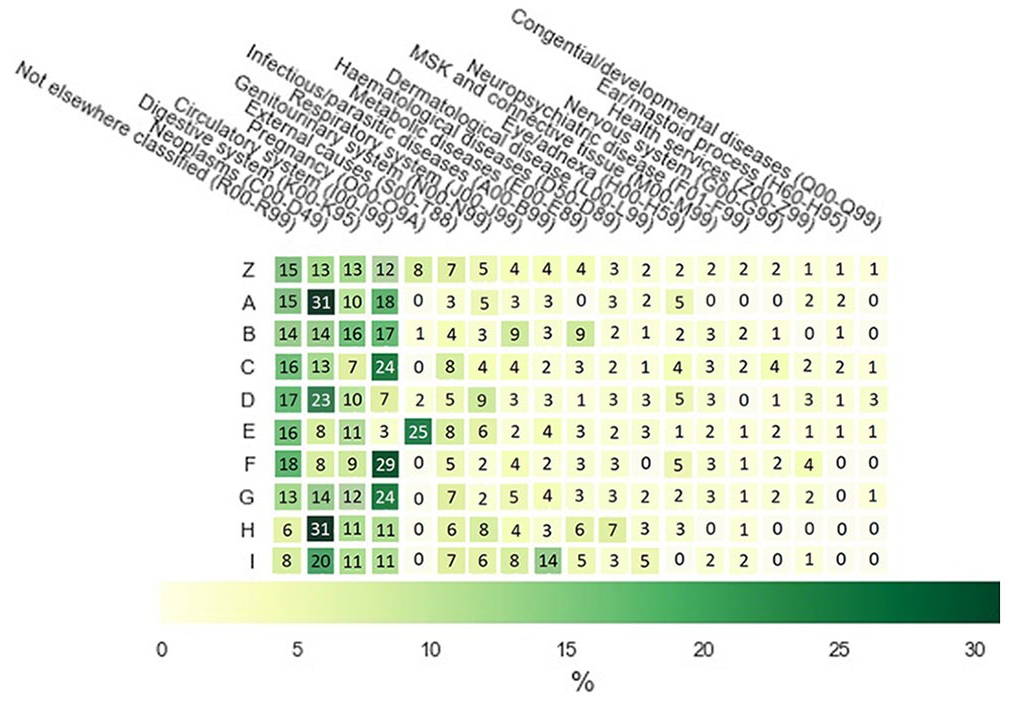
Heatmap of primary ICD-10 codes of different subclusters as recorded by clinicians at the time of patient admission and collated by top-level grouping. For display purposes, only ICD-10 codes with ⩾ 2% incidence for at least one cluster are displayed. Since only a subset of ICD-10 codes are visualized, each row does not add up to 100.
The distribution of ICD-10 codes allows us to see that the clusters are not just comprised of patients with one type of disease and in fact that clusters usually contain a mixture of different diagnoses. This reinforces the need for additional patient clustering as it is not enough to consider only diagnoses codes when assigning patient subtypes.
Surrogate explanations
Using surrogate explanations, features not relevant for cluster separation could be excluded. Consequently, different features remained for clustering the entire population and subclustering clusters 0 and 1.
For the entire population, “ICD-10 code count” is the most important feature for assigning patients to clusters 0, 2, and 4. Whereas “Gender” is most important for clusters 3, 6, and 7. “SATS” and “Temperature” are the most important factors for clusters 1 and 5, respectively. “Heart Rate” and “Blood Pressure” have only a minor role, mostly in cluster 4 (Figure 9).
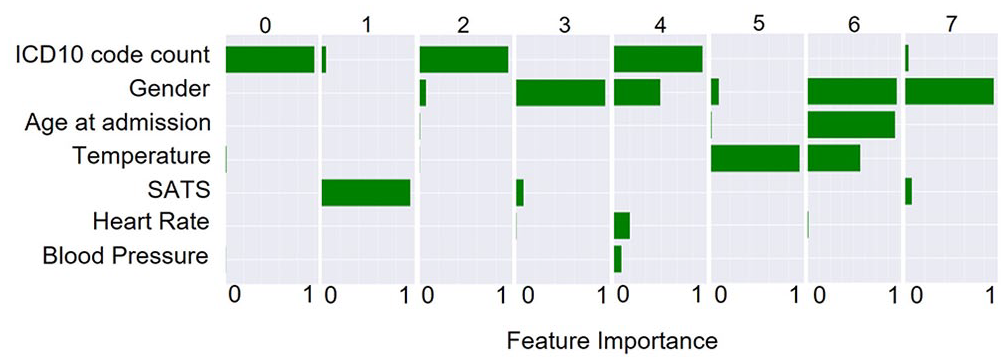
Surrogate explanations for the contribution of each vital in determining the assignment of patients into each cluster from clustering of the entire population.
Clustering 0 identified only two subclusters with “SATS” being by far the most dominant feature with subcluster 0A containing patients with a median SATS level of 100% and 97% saturation for subcluster 0B at their first measurement point (Figure 10). The other features, that is, “Age,” “Heart Rate,” and “Blood Pressure,” have only a minor impact (Figure 10).
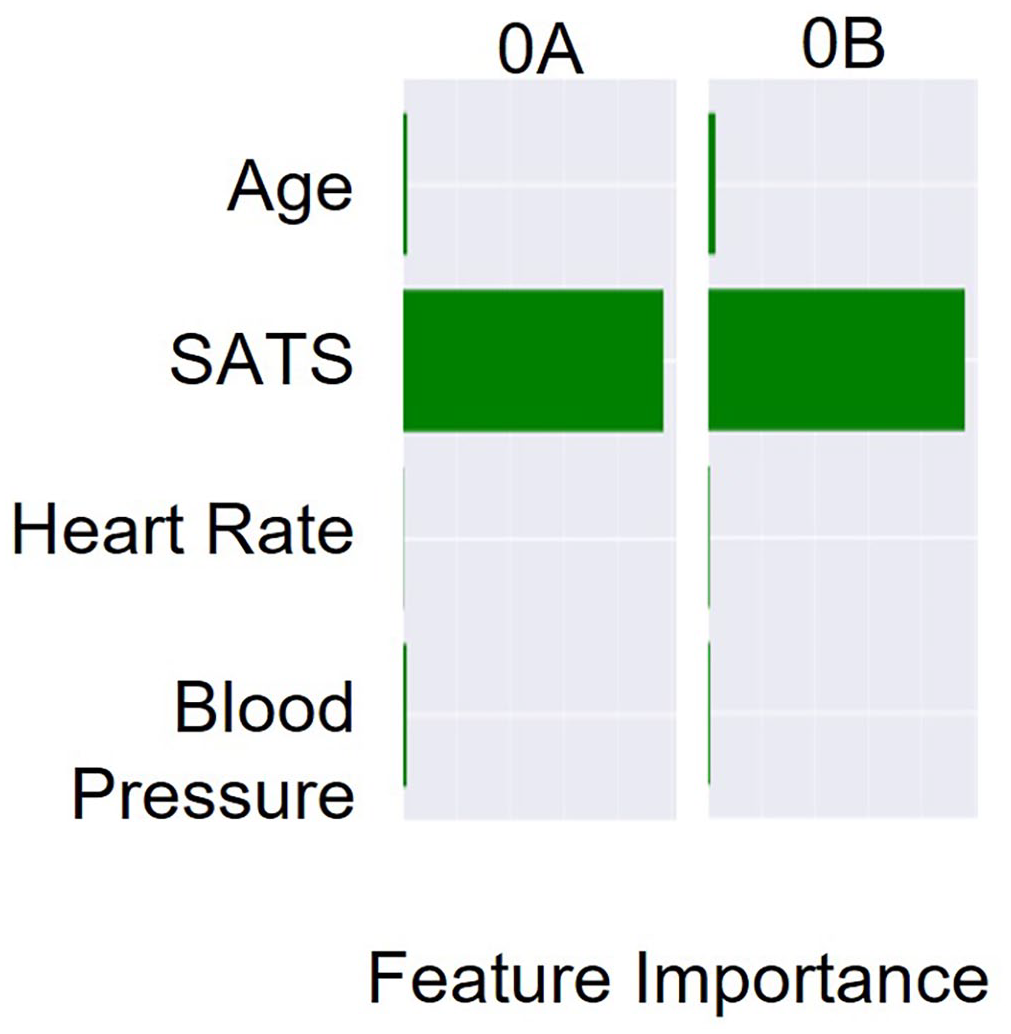
Surrogate explanations for the contribution of each vital in determining the assignment of patients into each subcluster of cluster 0.
In total, nine subclusters were determined for cluster 1. “Age” is the most important factor in five clusters, that is, 1A, 1C, 1D, 1E, and 1I, and has still a high impact on clusters 1F, 1G, and 1H. Other features with high impact are “Gender,” “Heart Rate,” and “Blood Pressure.” Whereas “ICD-10 code count” and “Temperature” have only a minor influence on cluster separation (Figure 11).
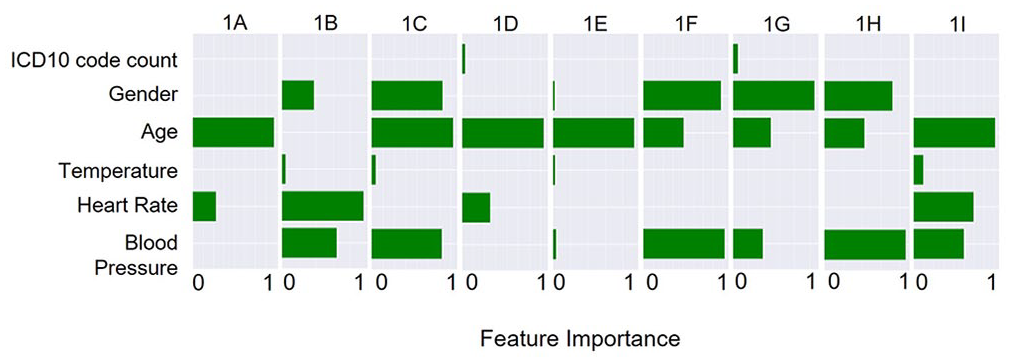
Surrogate explanations for the contribution of each vital in determining the assignment of patients into each subcluster of cluster 1.
Clinical evaluation
The clinicians were able to detect intercluster differences and intracluster similarities, enabling the generation of labels and descriptions for each cluster (Table 4, full descriptions in the Supplementary section). For example, cluster 0 was defined by having young healthy patients with few comorbidities, an even spread of primary diagnoses, brief stay, median NEWS2 of 0, and low mortality. All cluster descriptions are available in the Supplementary Materials. The two clinicians generally gave similar descriptions for each cluster, although there were some differences in which features they used to define each cluster. Of the 21 features mentioned by clinician A and 30 features by clinician B to describe membership to clusters 0–7, 15 were in common. Including in common omission of irrelevant features (36), in total out of 72 opportunities to comment on features, there was an overlap of 51 features (71%).
Comparison of feature importance in characterizing each cluster between clinicians and surrogate explanations.
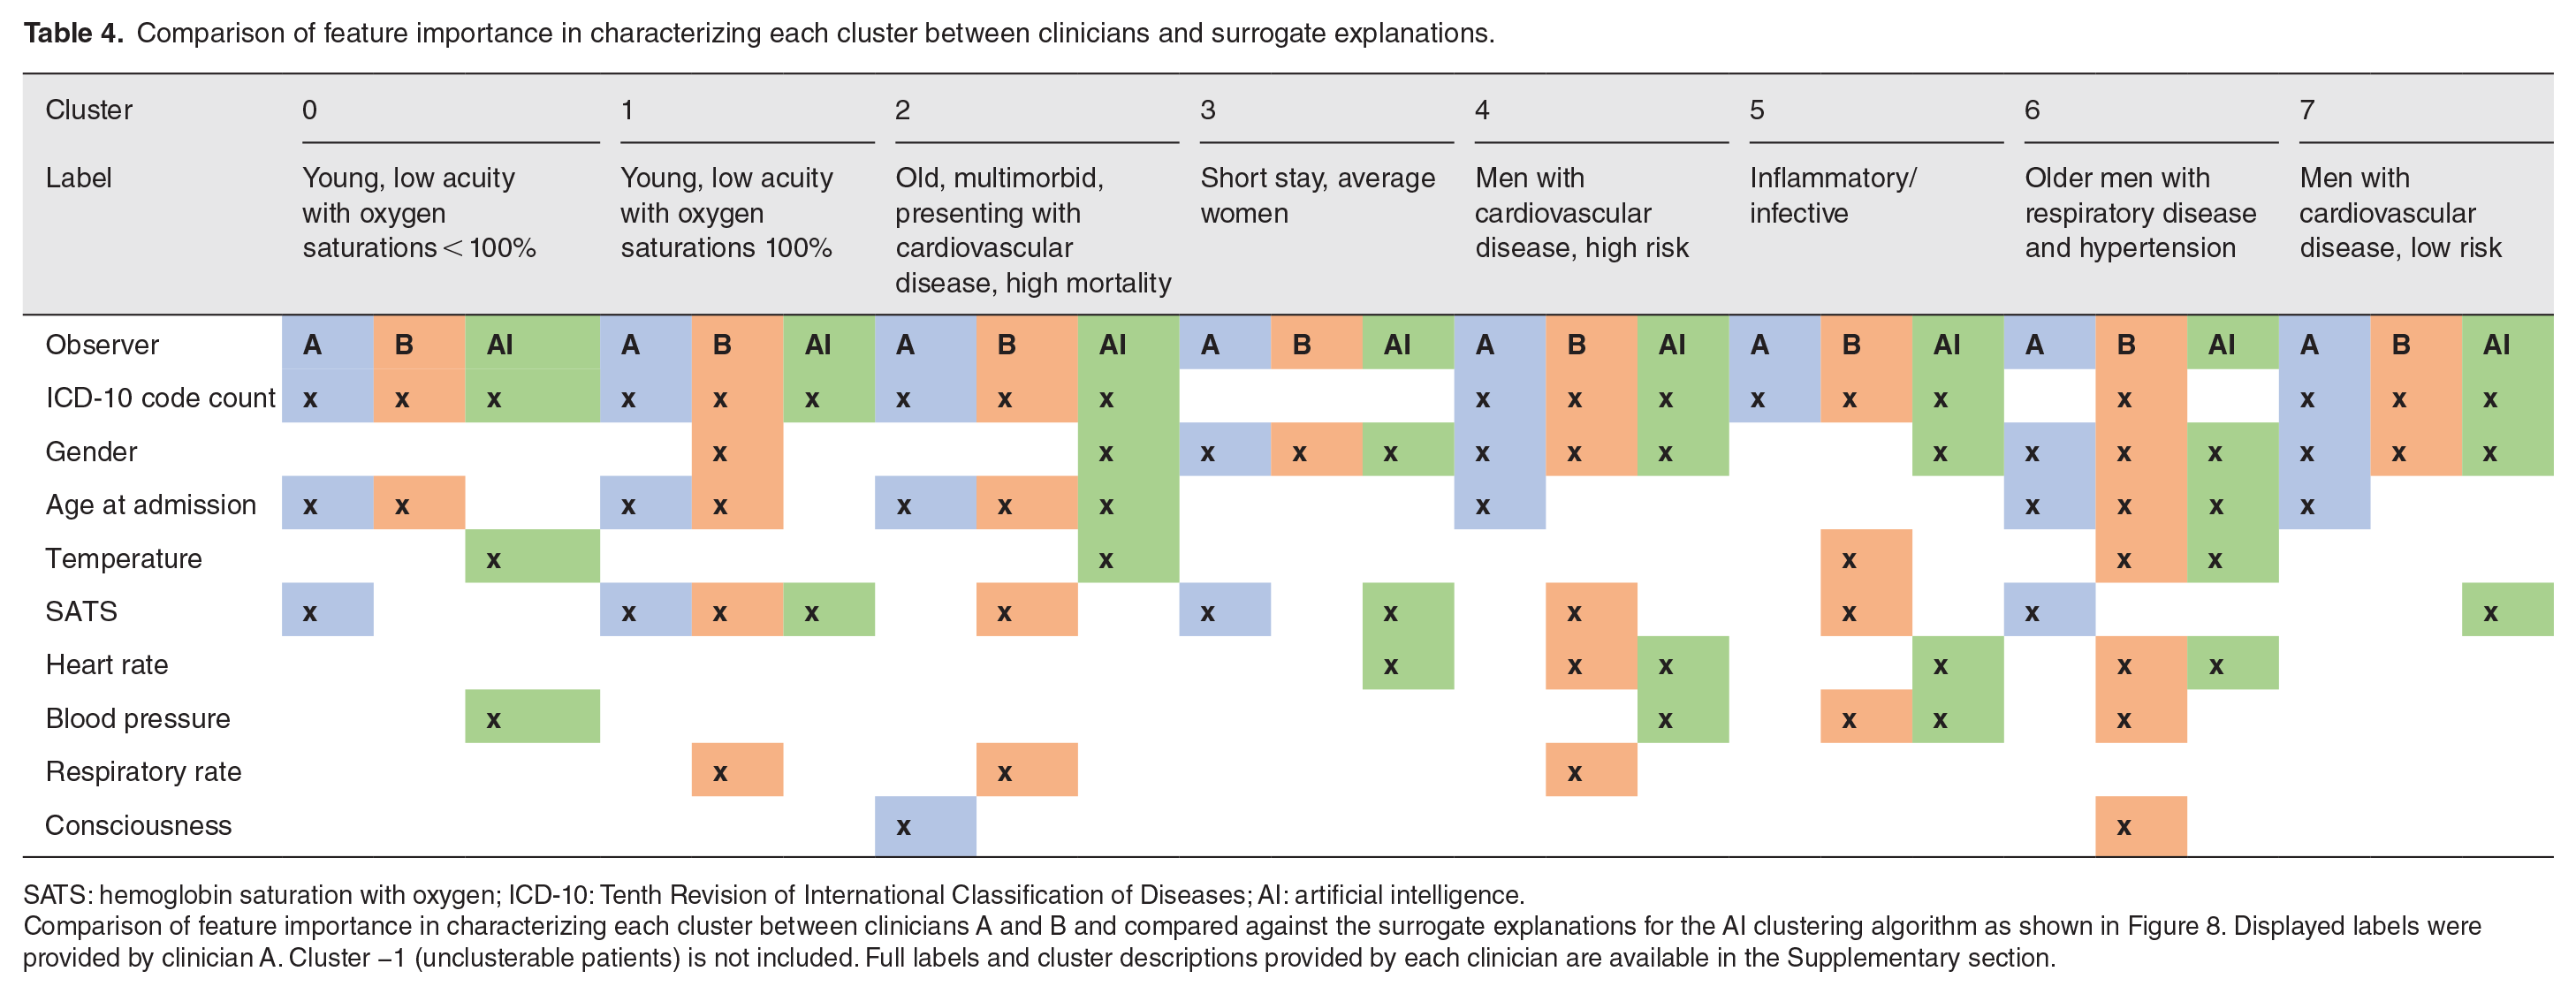
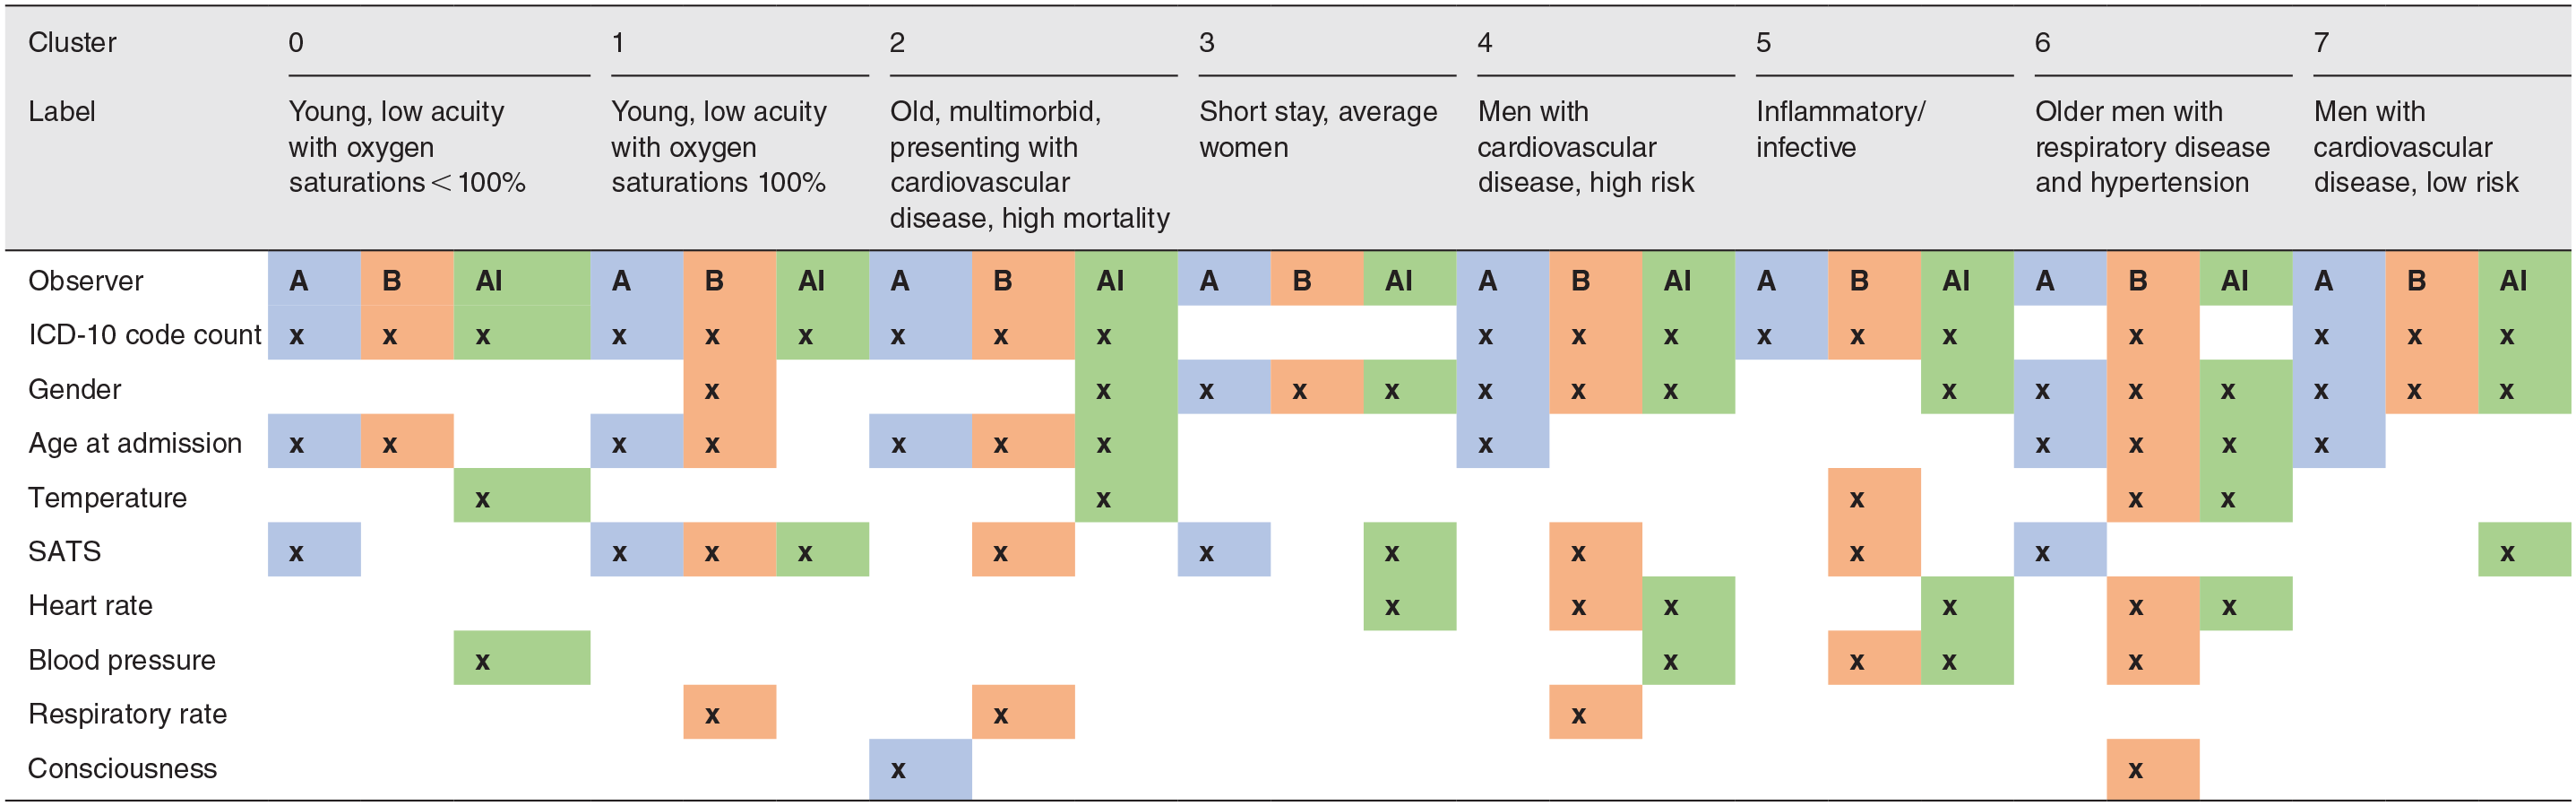
SATS: hemoglobin saturation with oxygen; ICD-10: Tenth Revision of International Classification of Diseases; AI: artificial intelligence.
Comparison of feature importance in characterizing each cluster between clinicians A and B and compared against the surrogate explanations for the AI clustering algorithm as shown in Figure 8. Displayed labels were provided by clinician A. Cluster −1 (unclusterable patients) is not included. Full labels and cluster descriptions provided by each clinician are available in the Supplementary section.
Features found to contribute to cluster assignment through the automated clustering process (Figure 6) were largely identified by the two clinicians when independently assessing the characteristics of each cluster (Table 4). Of the 26 features which contributed to level 1 clustering as identified automatically, 17 were identified by at least one clinician, and 12 were identified by both clinicians. Including in common omission of irrelevant features for the artificial intelligence (AI) system and both clinicians (27), in total there was an agreement in features of 54% between all three agents, and 74% between the AI system and at least one of the two clinicians.
Outcome prediction
Relative performance in predicting mortality and admission to higher care varied by cluster, and performance metric, when compared to the entire cohort (“All”) and NEWS2 (Table 5). For mortality, clusters −1 (unclusterable patients), 1, 2, 3, and 7 performed particularly well, and this was reflected in the receiver operating characteristic (ROC) and precision recall curves (Figure 12(a) and (b)). For admission to higher care, clusters −1 (unclusterable patients), 2, and 6 performed particularly well compared to the NEWS2 scoring system. Logistic regression predictive models were generated for subclusters within clusters 0 and 1 (Supplementary Figures 1 and 2 and Supplementary Tables 1 and 2). Several of these subclusters showed improved performance compared to their parent cluster’s performance: for example, subclusters 1D and 1F for admission to higher care units.
Cluster outcome prediction performance.
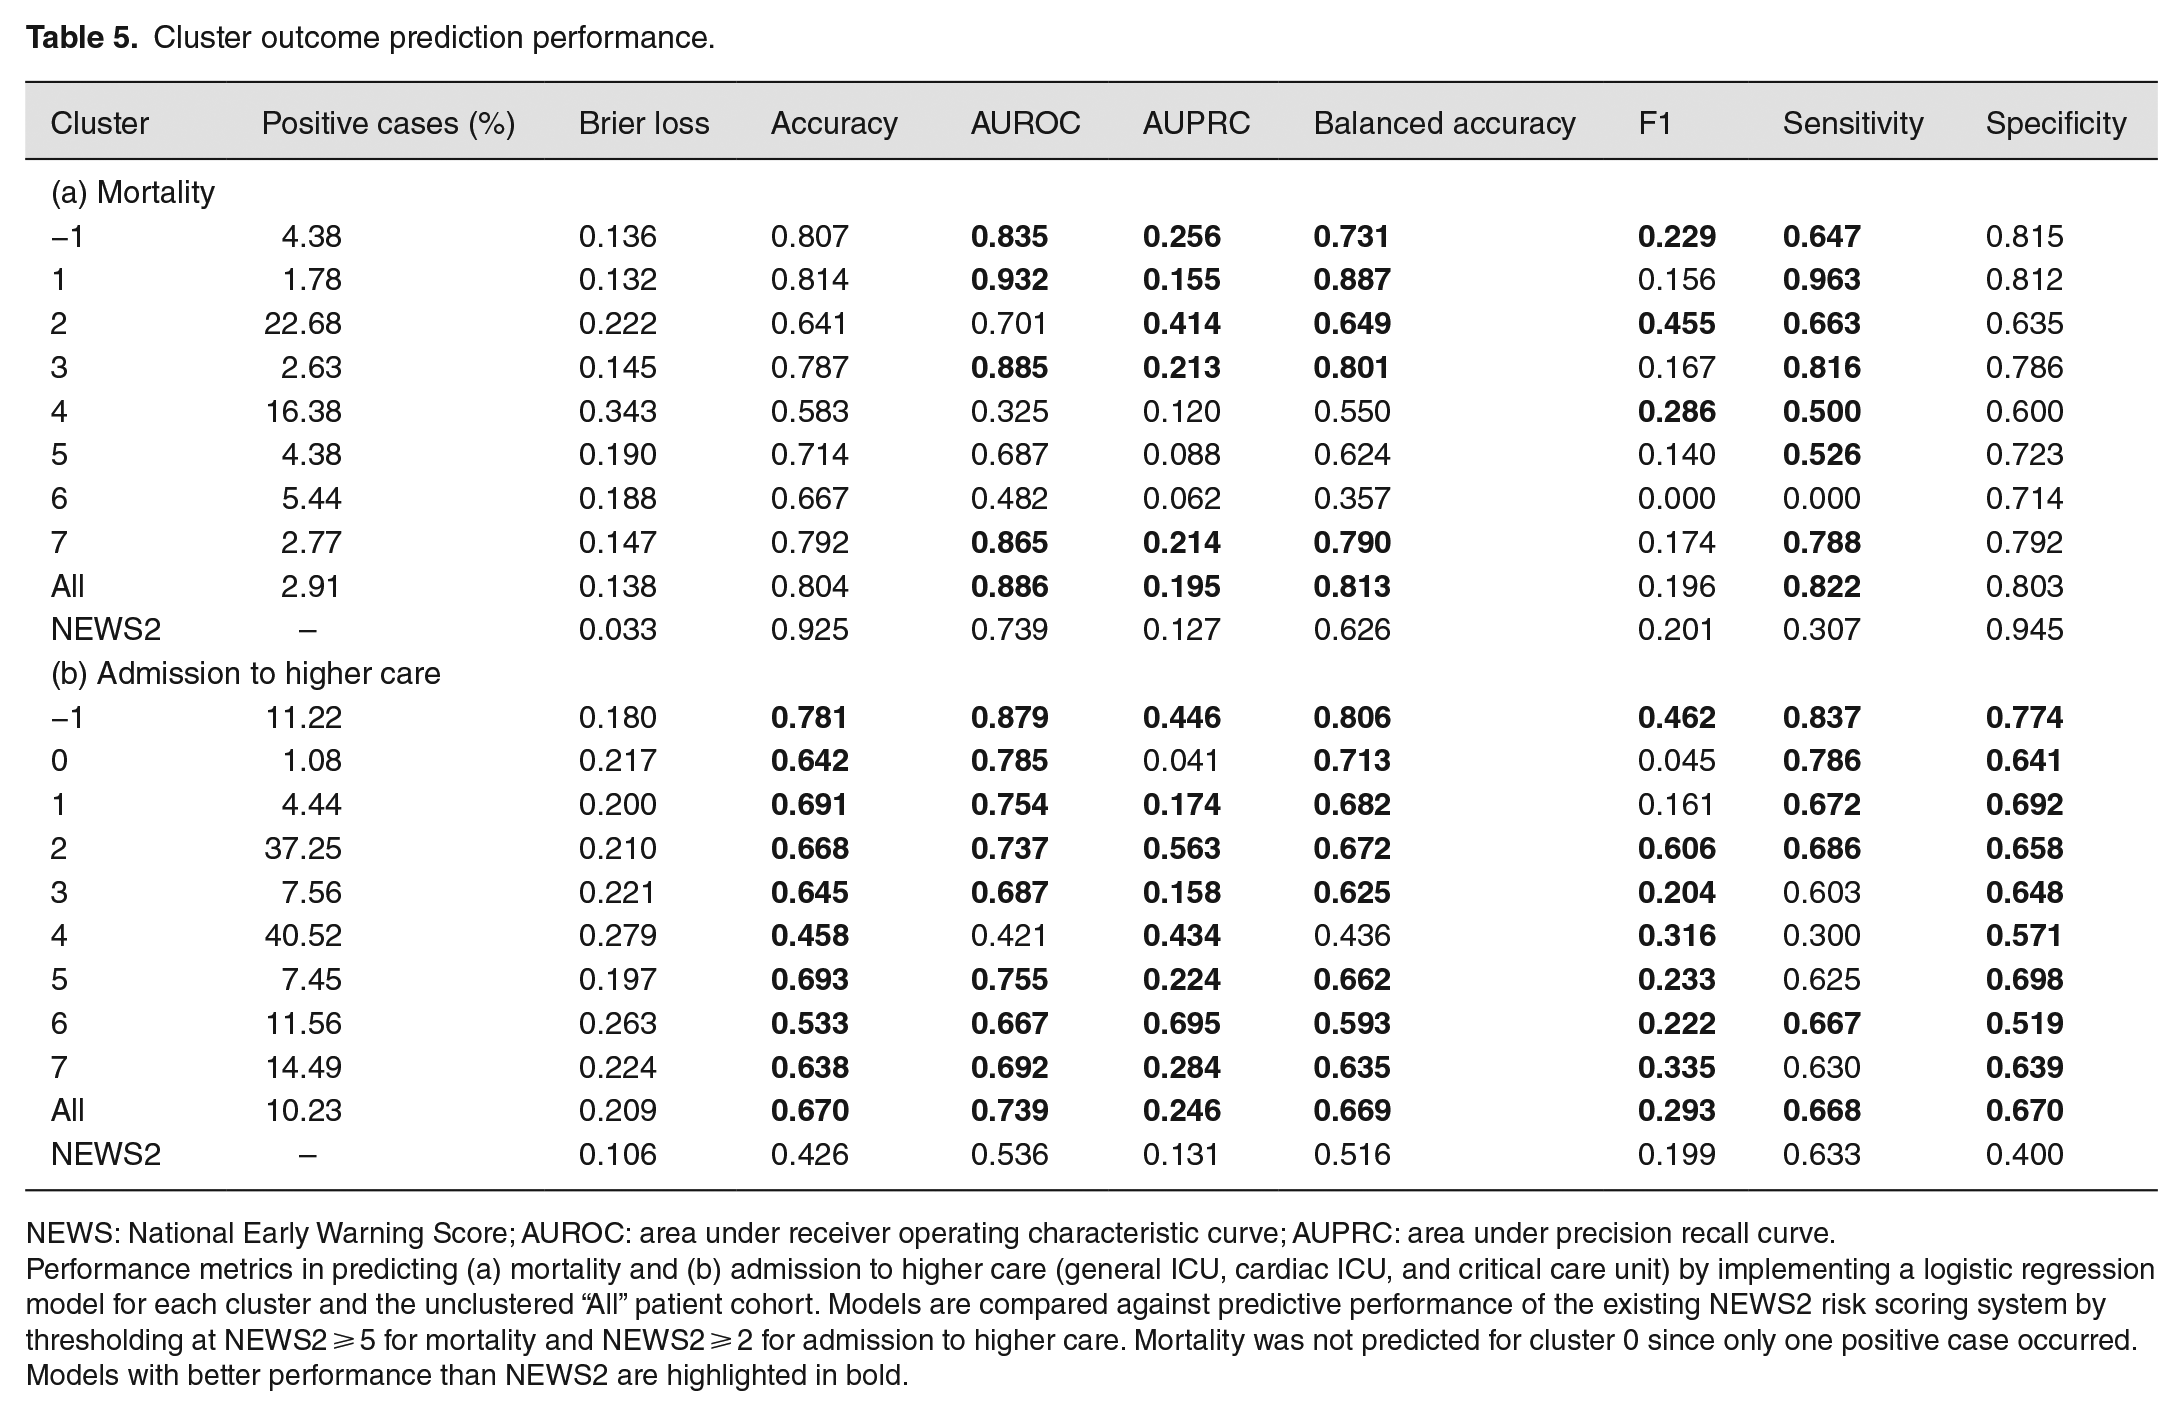
NEWS: National Early Warning Score; AUROC: area under receiver operating characteristic curve; AUPRC: area under precision recall curve.
Performance metrics in predicting (a) mortality and (b) admission to higher care (general ICU, cardiac ICU, and critical care unit) by implementing a logistic regression model for each cluster and the unclustered “All” patient cohort. Models are compared against predictive performance of the existing NEWS2 risk scoring system by thresholding at NEWS2 ⩾ 5 for mortality and NEWS2 ⩾ 2 for admission to higher care. Mortality was not predicted for cluster 0 since only one positive case occurred. Models with better performance than NEWS2 are highlighted in bold.
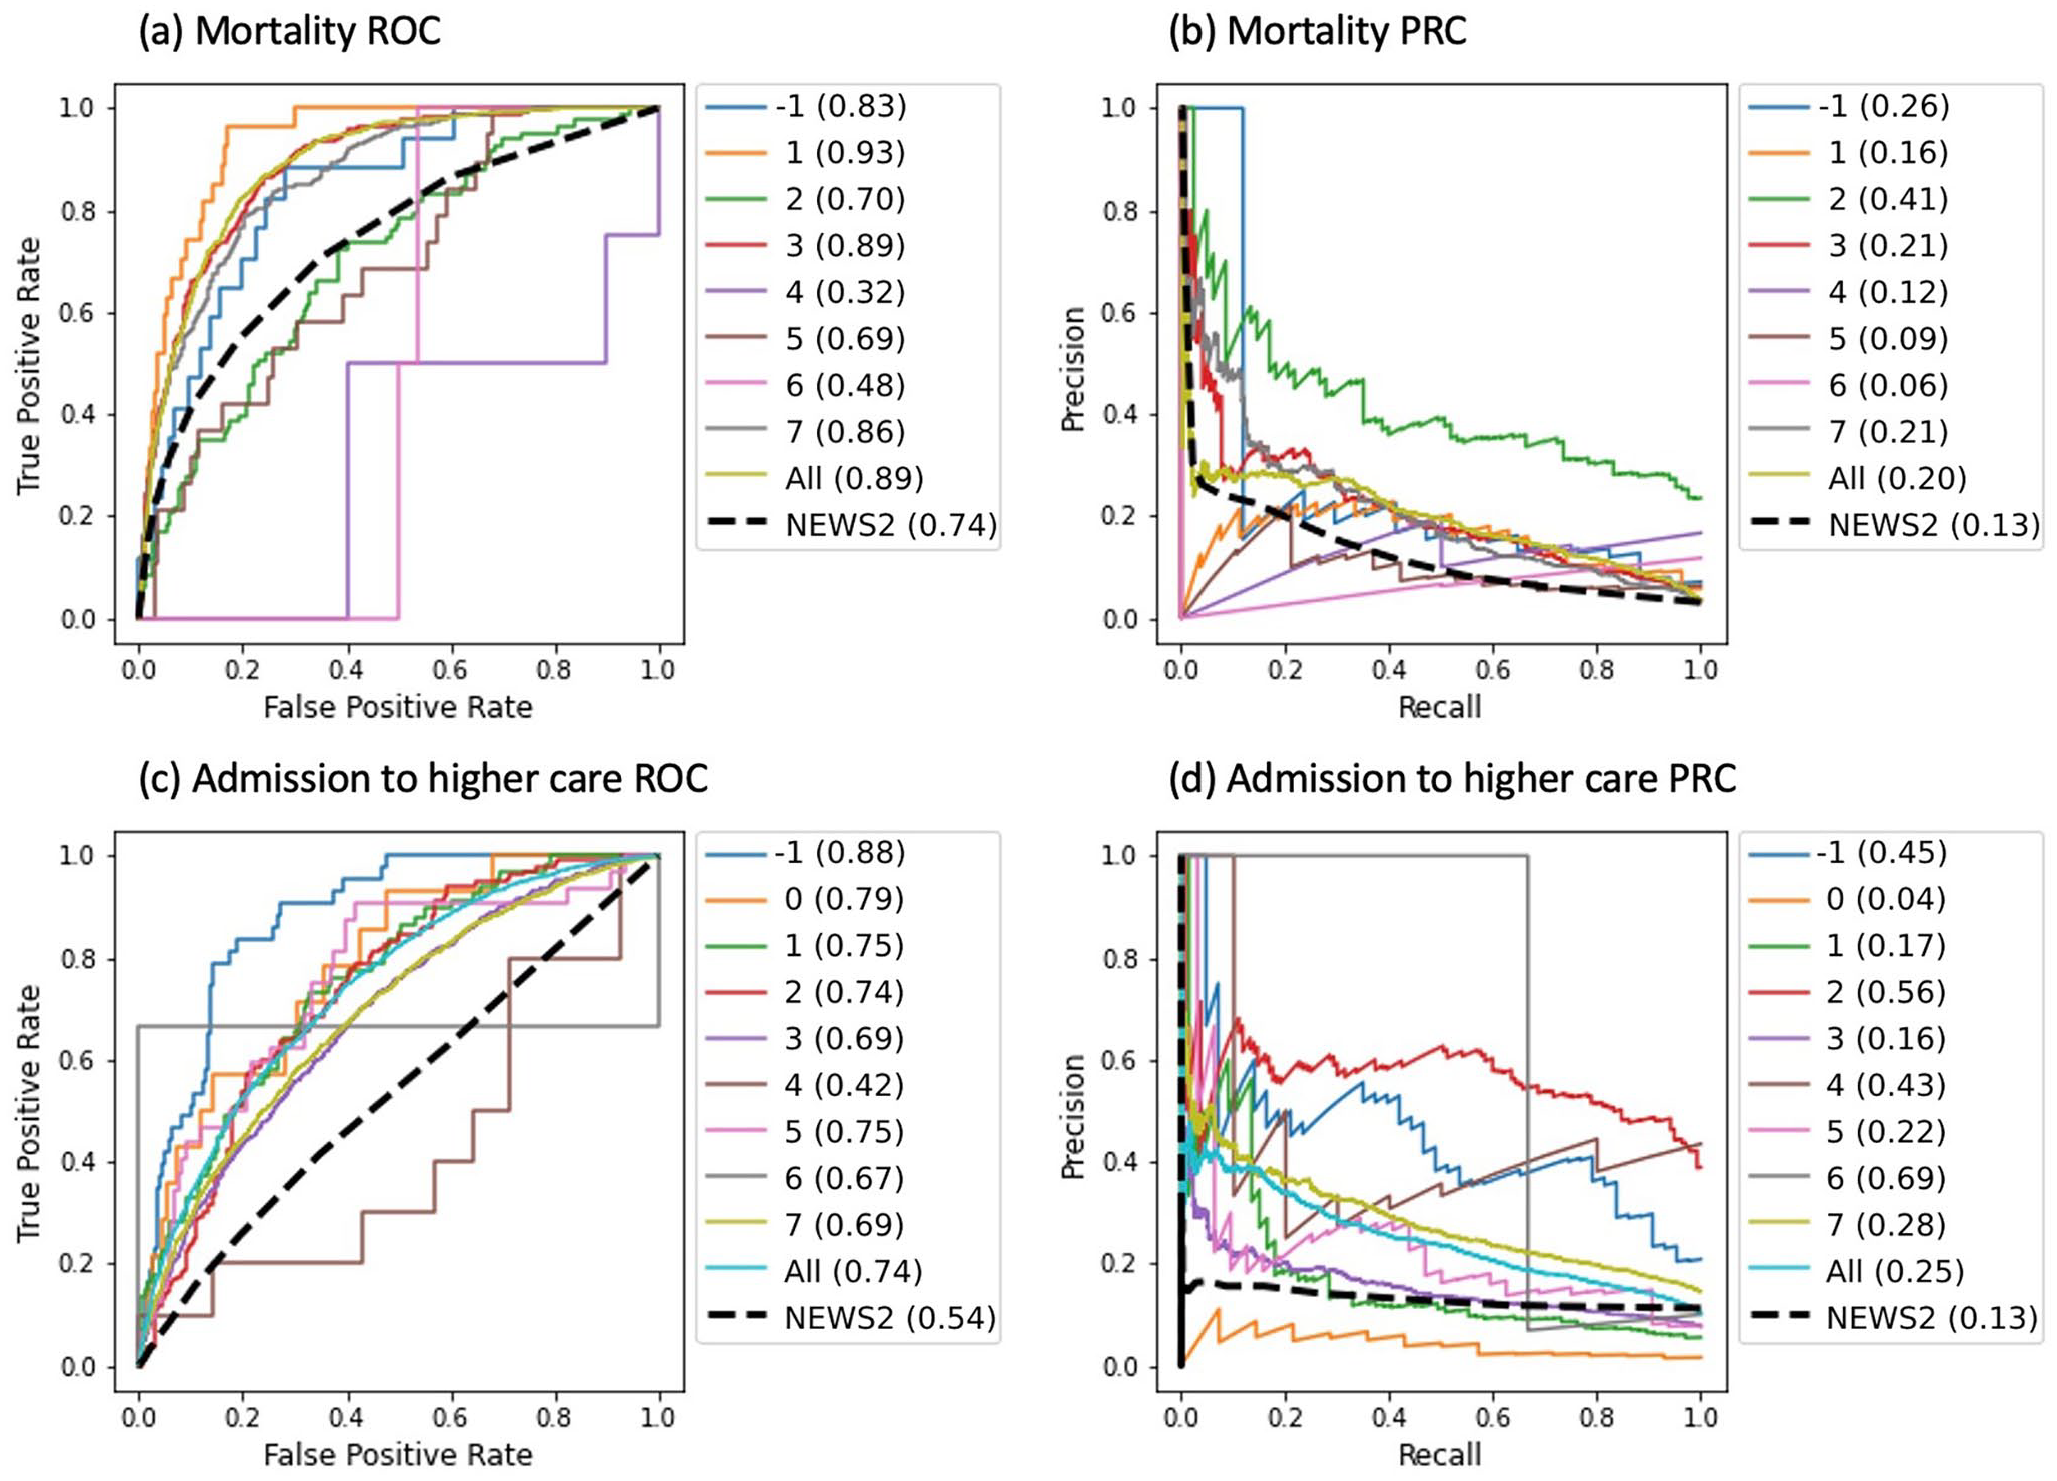
Predictive performance for classification models compared against the existing NEWS2 risk scoring system for the two predicted outcomes: in-hospital mortality and admission to higher care (general ICU, cardiac ICU, and critical care unit). “All” refers to the entire unclustered patient cohort. Mortality was not predicted for cluster 0 since only one positive case occurred: (a) mortality ROC, (b) mortality PRC, (c) admission to higher care ROC, and (d) admission to higher care PRC. Figures in brackets are the area under the curve.
Logistic regression mortality prediction models were not generated for cluster 0, nor any of its subclusters, since there was only one positive example in this cluster. Likewise, within cluster 1, no mortality predictions were made for subclusters 1A, 1B, 1D, and 1H nor subclusters 1H and 1I for admission to higher care due to insufficient positive examples. Thresholds for NEWS2’s predictive power were optimized by maximizing the F1 score and were found to be NEWS2 ⩾ 5 for mortality and NEWS2 ⩾ 2 for admission to higher care.
Discussion
This study presents a pipeline in which explainable hierarchical clustering is used for patient subtyping and risk prediction. Patient subtyping by way of clustering could be the first step toward a personalized scoring system, improving the predictive success of currently deployed risk scoring metrics.10–13,19
The clusters identified in this study were based on six vitals from the first set of readings taken during a hospital stay in combination with age, gender, and number of ICD-10 codes at admission. Using these few features and the focus on hospital departments outside of intensive care are in contrast to previous studies. Castela Forte et al. 1 and Vranas et al. 3 included 76 and 23 clinical features, respectively, resulting in the identification of six subtypes of ICU patients. In this study, the first clustering iteration of the entire population revealed eight clusters and a group of unclusterable patients. The clinicians identified “unclusterable patients” as average patients without any distinguishable features. In the second clustering iteration, that is, subclustering, identified a total of 23 subclusters. Cluster 4 and 6 were excluded from subclustering as they contained less than 1000 patients. The subclusters enabled the clinicians to assign descriptions with more precise clinical meaning. This could be the result of patient subtypes becoming more homogeneous which would also be supported by the increase in the DBSV score.
The feature contributions identified by the surrogate explanations varied between clusters and were found to be largely in agreement with the clinicians. This encourages tailored feature selection for individual patient subtypes and will, in the future, be expanded upon so that some additional features will be available for some patient subtypes, for example, additional blood tests for some patient subtypes.
Here, cluster 6 has the highest mortality rate with 5.44% which is also reflected in the highest median NEWS2 of 3.0. Surprisingly, this does not correlate with the maximum average hospital length of stay. While cluster 6 patients stay on average in hospital for 68 h 26 min, patients in cluster 2 and 4 stay longer with an average length of stay of 126 h 48 min and 124 h 44 min, respectively. Cluster 2 also has the highest ICD-10 code count with 26, followed by cluster 4 and 5 with 24.
To provide further insights into the clinical meaning of the patient subtypes, the most frequent ICD-10 codes were identified. Vranas et al. 3 found “Sepsis” as the most common diagnosis in ICU patients in five out of six clusters, whereas Castela Forte et al. 1 determined a different leading cause for each cluster. In this study, “Sepsis” is found as the most common diagnosis in two out of nine clusters plus the unclusterable patient group. However, all three clusters account for only about 2.23% of the hospital population. The two largest clusters found “Respiratory Infections” and “Heart disease” as the most common ICD-10 and account for 41.73% and 38.41% of the hospital population, respectively. Castela Forte et al. 1 also identified two clusters with high prevalence of respiratory failure.
The identified NEWS2 thresholds for best predicting mortality and admission to higher care are lower than the national guidelines’ triggers for emergency assessment. 18 This is unsurprising since our study focuses on the initial set of observations at the time of admittance and the patient may only deteriorate days or weeks later. Hence, other studies often limit performance evaluation to outcomes predicted within 24 h of a recorded score. 37 However, clusters and subclusters identified in this study were better able to predict early signs of these patient outcomes compared to the existing NEWS2 system even though the average stay per cluster was often two or more days (Table 2). For example, cluster 2 saw consistent improvements in predictive performance, specifically F1 score, for both targets when compared to NEWS2. A defining characteristic of cluster 2 independently noted by both clinicians was cardiovascular disease. This provides further evidence that certain subtypes could benefit from improved predictive performance via a clustering process if deployed clinically. Of note, cluster −1 (unclusterable patients) models performed well compared to NEWS2 and often better than other clusters. This suggests that even those identified patients not in a clearly defined cluster could benefit from the presented approach. Generally, admission to higher care predictive performance for each cluster was better than mortality when compared to the NEWS2 baseline. For mortality, individual clusters and subclusters generally showed improved sensitivity compared to NEWS2, whereas for admission to higher care, they had both improved sensitivity and specificity. Admission to higher care was less imbalanced than mortality with 10.2% of cases in the positive class compared to 2.9% for mortality (Table 1), which may have contributed to the improved predictive performance. However, class imbalance, and small sample size, remained an issue and likely influenced performance for some clusters, in particular for metrics such as area under precision recall curve (AUPRC), recall, and F1 score which are affected by imbalances. These results illustrate the potential utility of applying the presented pipeline for prediction of patient outcomes. The presented prediction results involved no hyperparameter optimization and utilized only the first time point of measurements for each hospital stay. Predictive performance may be further improved by hyperparameter tuning, addressing the class imbalance, using more data point for each patient, and/or implementing a more sophisticated predictive model.
Surrogate explainers were generated to improve cluster explainability. A previous analysis showed that the level of consciousness and SATS are the key criterion for separating clusters. 31 The importance of the level of consciousness has also been previously identified as the key feature in predicting discharge from ICU. 5 However, in this study, the level of consciousness appeared less important and SATS only in some cases. It was also shown that the number and type of features varies between clusters. For example, clustering the entire population mostly only utilized five features, whereas subclustering cluster 0 almost exclusively relies on SATS. This result was verified by a 74% overlap between features independently identified by clinicians and the surrogate explainers (Table 4). The integration of surrogate explainers and clinicians helped validate and verify the presented results. Future studies and the deployment in hospital settings should consider this approach to increase fairness, accountability, and transparency. This also aids in building trust between the clinicians and machine learning systems. However, the identified patient subtypes and associated predictive performance should be treated with care, and considered merely illustrative, as the whole analysis is based on a data set from one hospital. Adding data from other hospitals as well as considering additional features may reveal other or alter the identified patient subtypes. Further work should be completed to validate the presented results before clinical application of the pipeline. Furthermore, two clinicians were part of the team in order to co-design the process. Future studies will increase the number of clinicians for additional feedback, increasing the acceptance of and trust in the identified patient subtypes. In summary, once validated, the presented pipeline could become a useful tool to assign patients to subtypes and could thereafter inform clinical decisions for improved patient care.
Supplemental Material
sj-docx-1-ebm-10.1177_15353702231214253 – Supplemental material for Explainable hierarchical clustering for patient subtyping and risk prediction
Supplemental material, sj-docx-1-ebm-10.1177_15353702231214253 for Explainable hierarchical clustering for patient subtyping and risk prediction by Enrico Werner, Jeffrey N Clark, Alexander Hepburn, Ranjeet S Bhamber, Michael Ambler, Christopher P Bourdeaux, Christopher J McWilliams and Raul Santos-Rodriguez in Experimental Biology and Medicine
Footnotes
Authors’ contributions
EW and JNC participated in all aspects of the study. RSB and AH contributed to the development of the machine learning pipeline. AH extracted the data and assisted in writing the manuscript. CPB and MA clinically evaluated the data. CPB, CJM, RBR, and MA consulted throughout the study.
Declaration of conflicting interests
The author(s) declared no potential conflicts of interest with respect to the research, authorship, and/or publication of this article.
Funding
The author(s) disclosed receipt of the following financial support for the research, authorship, and/or publication of this article: This work was funded by Health Data Research UK via the Better Care Partnership Southwest (HDR CF0129) within the P-NEWS project (personalized early warning scores for preventing unplanned critical admissions); EW, JNC, AH, and RSR are funded by the UKRI Turing AI Fellowship (grant no. EP/V024817/1).
Supplemental material
Supplemental material for this article is available online.
References
Supplementary Material
Please find the following supplemental material available below.
For Open Access articles published under a Creative Commons License, all supplemental material carries the same license as the article it is associated with.
For non-Open Access articles published, all supplemental material carries a non-exclusive license, and permission requests for re-use of supplemental material or any part of supplemental material shall be sent directly to the copyright owner as specified in the copyright notice associated with the article.