
Abstract
Photoacoustic (PA) imaging is a promising modality for medical diagnostics and therapeutic monitoring, but accurate quantification of contrast agents (CAs) remains a challenge due to nonlinear signal responses and spectral shifts at varying concentrations. These limitations hinder its clinical utility in applications such as tumor detection and treatment monitoring. This study introduces a spectral decomposition method to improve absolute CA concentration estimation in PA imaging. By using a reference spectral library, the approach corrects for signal distortions and nonlinear behavior, overcoming key limitations of traditional intensity-based methods. Validation was performed through in vitro experiments using a prostate-specific membrane antigen (PSMA)-targeted CA in both saline and blood, as well as dynamic tracking of indocyanine green (ICG) in ex vivo tissue. The method achieved significantly lower concentration estimation errors, with average absolute errors of 1.80 µM in saline and 3.34 µM in blood. Compared to conventional techniques, the proposed method demonstrated enhanced reliability and robustness. These results underscore the potential of this spectral-based quantification technique to support more precise, clinically translatable PA imaging, enabling accurate CA measurement for early disease detection, surgical guidance, and real-time monitoring of therapeutic interventions.
Keywords
Introduction
Photoacoustic (PA) imaging, also known as optoacoustic imaging, is an emerging nonionizing functional imaging modality that relies on laser-generated ultrasound (US). A short laser pulse is emitted into the tissue and absorbed by various chromophores. Thermoelastic expansion generates acoustic waves, which are detected by an US transducer to form PA images.1,2 Each chromophore has unique optical properties, resulting in a distinct PA response to different laser wavelengths. By illuminating the tissue with multiple wavelengths and extracting the chromophore-specific PA responses, their composition can be identified. This process is referred to as spectroscopic PA (sPA) imaging, or multispectral PA imaging.
The technique has demonstrated high efficacy in visualizing tissue metabolism and characterizing tissues for diagnostic and therapeutic guidance.3,4 PA imaging has been successfully applied in neurovascular mapping,5,6 oxygenation mapping,7,8 ablation guidance,9,10 and surgical tool tracking.11–13 It also shows promise for early tumor detection.14,15 Unlike other functional imaging modalities such as magnetic resonance imaging (MRI), PA imaging offers real-time, high-framerate, and high-resolution imaging due to the nature of ultrasound, making it particularly suitable for intraoperative use.
While many applications have been demonstrated using endogenous contrast agents (CAs) such as hemoglobin and lipids in sPA imaging, exogenous CAs are often employed for tumor detection by altering the optical properties of target tissues, thereby enhancing tumor sensitivity. Various types of CAs have been investigated, including metallic nanomaterials, 16 near-infrared (NIR) organic dyes, 17 semiconducting polymer nanoparticles. 18 Molecular-targeted CAs, designed to recognize and bind to specific tissues such as cancerous cells, have further improved early tumor detection.19–21 While CAs have enabled visualization of targeted tumors, the need for precise, quantitative imaging methods to assess their accumulation remains unmet. The accumulation of these targeted CAs in tissue often correlates with the degree of tumor malignancy, making accurate quantification of CA expression critical for proper tumor classification.
Despite advancements in PA imaging, particularly in detecting and visualizing targeted CAs, most existing studies have focused on qualitative imaging or relative concentration estimation based on signal intensity changes.22–24 Accurately estimating the absolute concentration of CAs remains a significant challenge. Current quantification methods rely on the intensity of the acquired PA signal at specific wavelengths, assuming a linear relationship between CA concentration and PA intensity.25–27 These methods treat each wavelength independently and disregard the broader spectral context, which contains valuable information about the agent's optical behavior at varying concentrations. This assumption is limited by several factors, including complex interactions between light, sound, and tissue, as well as variations introduced by the imaging system and signal processing techniques. Another approach uses the intensity of reference CA spectral signatures in the acquired PA image. However, many exogenous CA exhibit strong nonlinear spectral behavior. For instance, indocyanine green (ICG) displays both spectral shifting and peak suppression at high concentrations, which interrupts the linearity assumption and can lead to substantial errors in estimation and potential misclassification of targets. 28 This is not an isolated phenomenon; several molecular-targeted and nanoparticle-based agents show similar nonlinear responses, making this a pervasive limitation across quantitative PA imaging.
Recent studies have explored spectral unmixing and constrained inversion techniques to address challenges in sPA imaging. For instance, Tzoumas et al proposed methods for separating molecular agents including ICG from background absorbers using fixed spectral signatures, improving sensitivity under spectral coloring conditions. 29 Similarly, Ding et al introduced a constrained inversion framework that incorporates spectral priors and regularization to reduce reconstruction artifacts and crosstalk. 30 While both approaches advanced the state of spectral decomposition, they operate under the assumption of linear and static chromophore spectra, and thus do not account for nonlinear spectral distortions that occur with certain exogenous CAs. Another recent work by Thomas et al introduced the use of known chromophores as fluence markers to improve optical inversion and absorption recovery. 31 While effective for addressing fluence variation, this method does not directly quantify absolute CA concentrations or account for nonlinear spectral behaviors of exogenous agents like ICG. As a result, despite improvements in signal recovery, the core challenge of accurately determining absolute CA concentrations, particularly for agents with concentration-dependent spectral shifts, remains unsolved. This limitation can lead to significant estimation errors, impairing the ability to differentiate malignant from benign tissue and potentially affecting diagnostic and therapeutic decisions.
To overcome these limitations, we propose a novel spectral-based quantification method for absolute concentration estimation as illustrated in Figure 1. Unlike intensity-based techniques, our method analyzes the spectral characteristics of CAs, enabling more accurate and robust determination of absolute concentrations. This approach leverages the unique spectral signatures of CAs by mathematically comparing the measured spectra to a reference library of known concentrations. By focusing on spectral information rather than intensity, the proposed method enables reliable absolute concentration estimations and enhances the accuracy of quantitative PA imaging. By analyzing the entire spectral shape rather than relying on single-wavelength intensity values, our method captures concentration-dependent spectral shifts and distortions, enabling robust estimation.

The concept of absolute quantitative photoacoustic (PA) imaging for contrast agents concentration estimation using a spectral decomposition approach.
The contributions of this paper are two fold: (1) we introduce an absolute concentration mapping method based on spectral analysis, addressing the limitations of intensity-based approaches and (2) we demonstrate the feasibility of this method for achieving accurate, quantitative PA imaging of CAs. The article is organized as follows: the second section describes the proposed methods in detail. The third section outlines the experimental setup for reference spectra collection and validates the methods under various conditions. The fourth section presents the study results. The fifth section discusses the advantages and limitations of the work, followed by the conclusion in the sixth section. Preliminary results from this work were previously reported in publication. 32
Methods
Biomedical materials exhibit distinct optical absorption characteristics, which are critical in defining their PA spectra. These characteristics stem from the specific molecular structures of the materials, where different chromophores exhibit unique absorption spectra based on their chemical composition. When these materials absorb pulsed laser energy, they undergo rapid thermoelastic expansion, generating PA signals. The intensity and spectral content of these signals are directly related to the material's optical absorption properties at the excitation wavelengths.
In the biological environment, multiple chromophores or CAs often coexist within a sample, leading to a measured PA signal that represents a composite of contributions from each of these absorbing entities. Mathematically, the measured PA signal of a specific pixel at a particular wavelength w, denoted as pw, can be expressed as equation (1).

Here, p is the measured PA intensity at the wavelength w, i the contrast source number, M the number of absorbers, μa the PA spectrum of contrast source i, and W the number of wavelengths used. m is the estimated composition of the contrast source.
The goal is to accurately decompose these contributions to reconstruct an image that reflects the spatial distribution and concentration of each material within the sample. This is achieved through spectroscopic decomposition, also known as material decomposition or spectral unmixing. The technique assumes that the measured PA spectrum is a linear combination of the spectra from individual chromophores. By analyzing the spectral data collected across multiple wavelengths, the relative contribution of each chromophore to the overall PA signal can be estimated. This technique has been extensively explored in applications such as blood-oxygenation mapping,4,33 surgical guidance,10,34 and CA-enhanced imaging. 20
Spectroscopic decomposition relies on the principle that the observed PA spectrum across various wavelengths is a sum of the individual contributions from different chromophores. This relationship is represented mathematically by the following optimization problem as shown in equation (2):
This optimization problem aims to minimize the difference between the measured PA spectrum and the linear combination of the chromophore spectra, thereby determining the best estimates of
The PA spectrum of the sample was assumed to be a linear combination of the reference spectra in a spectral library. The contribution of each reference spectrum to the measured spectrum was calculated. Once the decomposition was performed, the estimated concentrations of the validation samples were determined using equation (3).
This equation provides an estimation of the concentration
For comparison, a single spectrum estimation method (equation (4)) was also applied. This method estimates the concentration based on the composition (m1) of the reference spectrum at a single known concentration (C1).

Additionally, a single wavelength linear peak intensity model (equation (4)) was used as another comparative approach. In this method, it was assumed that the PA intensity at this peak wavelength is proportional to the concentration. The estimated concentration

Experimental Implementation
In Vitro Study Setup
Figure 2A illustrates the PA imaging system and sample setup used in this study. A linear-array US transducer probe (L12-5 50 mm Linear Array Transducer, Philips, the Netherlands) served as the signal sensing device, paired with a dual-head illumination fiber bundle for laser energy delivery. Data acquisition was performed using the Verasonics Vantage system (Vantage 128, Verasonics, USA). A Q-switched Nd:YAG laser (Q-smart 450, Quantel, USA) with an optical parametric oscillator (OPO) (MagicPRISM, OPOTEK, USA) was employed, capable of generating wavelengths from 690 to 950 nm at a repetition rate of 20 Hz with a 5 ns pulse duration. Bubble-free distilled water was used as the scanning medium. Samples were placed in transparent silicone tubes (1 mm inner diameter, 2 mm outer diameter) and secured in a customized tube holder, as shown in Figure 2B.

(A) Experiment setup sketch: tube holder was aligned to the photoacoustic (PA) imaging plane. (B) Photo of 3D-printed tube holder with sample tubes mounted.
The selected wavelength range for sample scanning was between 700 and 850 nm, with 10 nm interval steps. This range includes the optimal spectral peak of the CA around 790 nm. To enhance image quality, a 64-frame averaging filter was applied to suppress random noise and compensate for laser output energy fluctuations. The acquired images were beam formed using the delay-and-sum (DAS) algorithm before enveloping. 35
Sample Preparation
To test the proposed algorithm, spectra of the CA under different concentrations were first collected. The custom-synthesized PA CA (SRF0715), composed of 2 dimer-structured IR800CW dyes and prostate-specific membrane antigen (PSMA)-targeted ligands, was selected. 36 The CA was diluted with phosphate-buffered saline (PBS) to create 6 concentrations (2, 5, 10, 20, 30, and 40 µM). These solutions were loaded into tubes mounted on the customized holder. PA scanning was conducted in order from lower to higher concentrations. PA excitation was performed at wavelengths ranging from 700 to 850 nm in 10 nm increments, covering the CA's spectral peak. The US scanning was conducted at the same location to confirm the structure of the target.
To further validate the algorithm's efficiency in a realistic environment and assess its accuracy in the presence of other chromophores, concentration estimation was performed using a blood medium. The same PA CA was diluted with mouse blood collected posteuthanasia. Identical concentration samples were prepared and scanned using the same imaging system settings.
Spectrum Library Generation
The acquired spectra of the CA at each concentration were input into algorithms to estimate their concentrations. Spectra from the 2 and 40 µM solutions were used as library references in the proposed method, while the remaining collected spectra were utilized to validate the algorithm's efficiency. For comparison, the single-spectrum method was applied to the acquired signals, using the 2 µM spectrum as a reference.
Ex Vivo Concentration Estimation Demonstration
The proposed algorithm for CA concentration mapping was further evaluated in an ex vivo setup. The algorithm was tested by monitoring the injection of a CA, ICG (ICG 250 mg, U.S. Pharmacopeia, USA) into a chicken breast tissue sample. A silicone tube was inserted into the tissue and connected to a syringe slider controlled by a stepper motor to regulate flow, as shown in Figure 3. The US imaging was used to align the imaging plane and confirm the tip of the injection tube. A 25 µM ICG solution was injected through the tube, and the process was monitored using continuous sPA imaging at 4 wavelengths (700, 710, 790, and 850 nm) at a 5 Hz frame rate, covering the primary and secondary peaks of the ICG spectrum. 37 A laparoscopic transducer (Philips ATL Lap L9-5, Philips, the Netherlands) and a fiber bundle were used for data acquisition, as shown in Figure 3. The distribution of ICG in the tissue was quantified using the proposed algorithm and compared to conventional methods.

Ex vivo study setup: indocyanine green (ICG) was injected into a chicken breast tissue sample using a motor-controlled syringe. Ultrasound (US) imaging was employed to locate the tip of the injection tube.
Results
Contrast Agent Spectral Library Acquisition
The spectra of the SRF0715 CA were acquired using PA tomography scanning. The locations of the CA-containing tubes were manually labeled based on the US and PA images. The spectra at 2 and 40 µM concentrations are shown in Figure 4. A clear spectral shift toward shorter wavelengths was observed as the concentration increased. The intensity at the peak wavelength of 790 nm decreased at 40 µM, with a secondary peak emerging at 710 nm.

Library spectra of contrast agent (CA) SRF0715 at 2 concentrations.
Simulated Spectral Analysis of Contrast Agent
The effectiveness of the proposed method for estimating CA concentration was first evaluated through simulations. A set of simulated CA spectra at various concentrations was generated using linear interpolation between acquired library spectra at 2 and 40 µM. Figure 5A shows the simulated spectra, indicating a decrease in the main peak and a shift toward shorter wavelengths.

Simulated contrast agent spectra interpolated between 2 and 40 µM. Concentration estimation using single spectrum method (A), linear intensity model (B), and the proposed method (C).
Concentration estimations were performed using different methods, as shown in Figure 5B-D, where the true values and estimated concentrations are displayed. The results demonstrate that both the single spectrum estimation and peak intensity linear estimation methods failed to track the increase in concentration. The single spectrum decomposition method consistently estimated concentrations around 2 µM, while the peak intensity linear method showed a decrease, following the reduced intensity at the peak wavelength at 790 nm. The linear intensity model was also tested at 710 nm where a secondary spectrum peak was observed with this CA increasing with concentration. However, the estimation accuracy is still poor. In contrast, the proposed method successfully estimated the concentrations from the simulated spectra as shown in Figure 5E.
To assess the performance of the proposed method in more realistic scenarios, we simulated changes in CA spectra when mixed with blood spectra at different oxygenation levels. Blood oxygen levels of 50%, 70%, and 90% were combined with the interpolated CA spectra ranging from 2 to 40 µM. The proposed method was then used to isolate the influence of blood spectrum and estimate concentrations accurately through spectral unmixing. The results, shown in Figure 6, indicate that concentration estimations remained consistent across different oxygen levels. Compared to simulations without blood interference, the estimation showed larger errors, peaking at 20 µM with an error of 2.13 µM.

Simulated contrast agent (CA) spectra interpolated mixed with hemoglobin spectra at (A) 50%, (B) 70%, and (C) 90% oxygen level and their concentration estimation using the proposed method.
Estimation of Contrast Agent Concentration in PBS
The PA absorption spectra of the SRF0715 CA were acquired at 6 concentrations, ranging from 2 to 40 µM as shown in Figure 7A. The sample spectra were extracted by manual labeling based on the tube locations confirmed by both PA and US image. The spectra at various concentrations are shown in Figure 7B. Similar to the simulation results, all spectra exhibited a notable signal peak at 790 nm, with a shift similar to the reference spectra. As concentration increased, the CA demonstrated a change in the spectrum, including the emergence of a second peak around 710 nm and a decrease in intensity at the primary peak of 790 nm. These results highlight the nonlinear relationship between the sample spectrum and concentration.
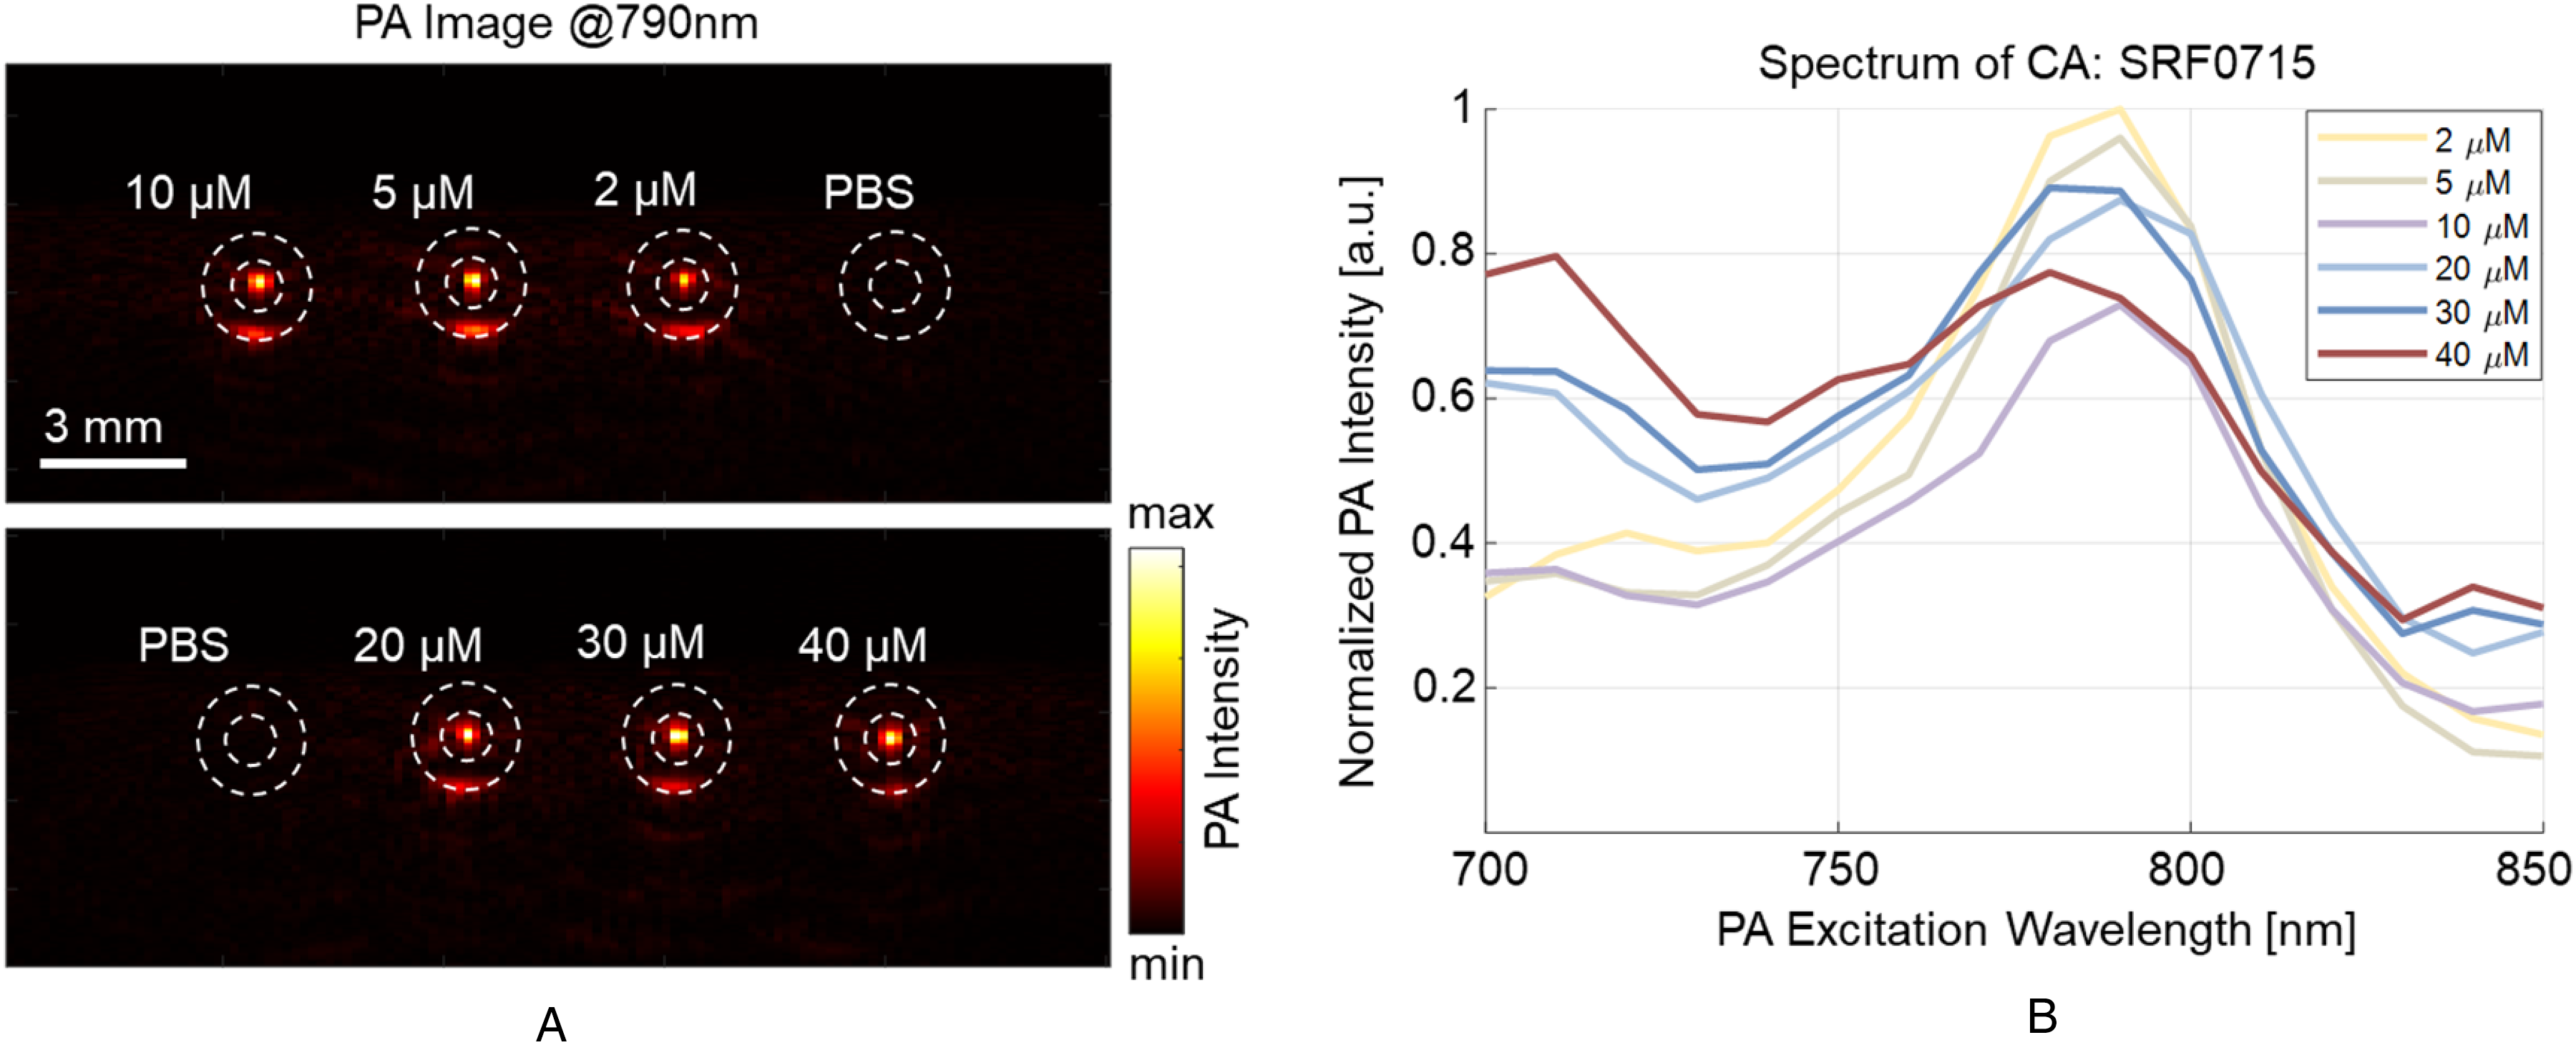
(A) Photoacoustic (PA) scanning images of samples at various concentrations. (B) Acquired PA spectrum of the prostate-specific membrane antigen (PSMA)-targeted contrast agent (CA).
Concentration estimations were performed using single spectrum estimation, linear intensity modeling, and proposed spectral-based quantification method. The single spectrum method, based on the composition of a single reference spectrum, is shown in Figure 8A. The true values and estimated concentrations for each sample are displayed as red crosses, with the fitting line of the estimation, compared to the ground truth line. The 2 µM library was used for spectral unmixing. This method failed to detect concentration changes across different samples, predicting all samples approximately 2 µM. The average estimation error was 15.89 µM. The single-wavelength linear intensity modeling method, using the PA signal intensity at 790 and 710 nm independently, is shown in Figure 8B. Similar to the simulation results, this method failed to estimate the increase in concentration. Instead, the estimated concentration decreased as the actual concentration increased, with the reduction in peak intensity at 790 nm contributing to this inaccurate estimation. When estimation was performed using the secondary peak at 710 nm, the estimation error decreased but remained unsatisfactory.

Concentration estimation and error of the prostate-specific membrane antigen (PSMA)-targeted contrast agent (CA): SRF0715, using single spectrum method (A), peak intensity fitting method (B), and the proposed method (C).
Our proposed method, based on the library spectrum, is presented in Figure 8C. This method successfully identified the concentration increments, with an average estimation error of 1.80 µM. The highest estimation error was observed in the 30 µM sample, with an error of 7.55 µM.
Estimation of Contrast Agent Concentration in Blood
The CA in the blood medium was also scanned and estimated using our proposed library-based concentration algorithm. The same method was applied, using reference spectra at 2 and 40 µM. Six different concentrations were scanned and estimated. The estimation results are shown in Figure 9 using our proposed method. The results demonstrate that the algorithm accurately estimates the concentration of the CA in the blood medium, with an average error of 3.34 µM and a maximum error of 17.01 µM observed in the 10 µM sample.

Concentration estimation and error of contrast agent (CA): SRF0715 in blood.
Ex Vivo ICG Injection Monitoring
The performance of the proposed algorithm was further validated in an ex vivo study. The injection of ICG into a tissue sample was monitored using the proposed method. ICG has similar concentration dependent spectral property similar to the SRF0715 CA. Additionally, the visible green color makes it easier to inspect its distribution in tissue. The concentration of ICG at each pixel was calculated based on reference spectra at various concentrations. 37 The spectra from 1.95, 3.91, 15.6, and 31.3 µM were used as reference. The distribution of ICG at different time points during the injection is shown in Figure 10A. Initially, no ICG signal was detected, but the concentration around the injection tube began to increase at 44 s, quickly saturating at 25 µM, which corresponds to the solution concentration. The ICG also penetrated the surrounding tissue, with the estimated concentration around the injection site increasing accordingly.
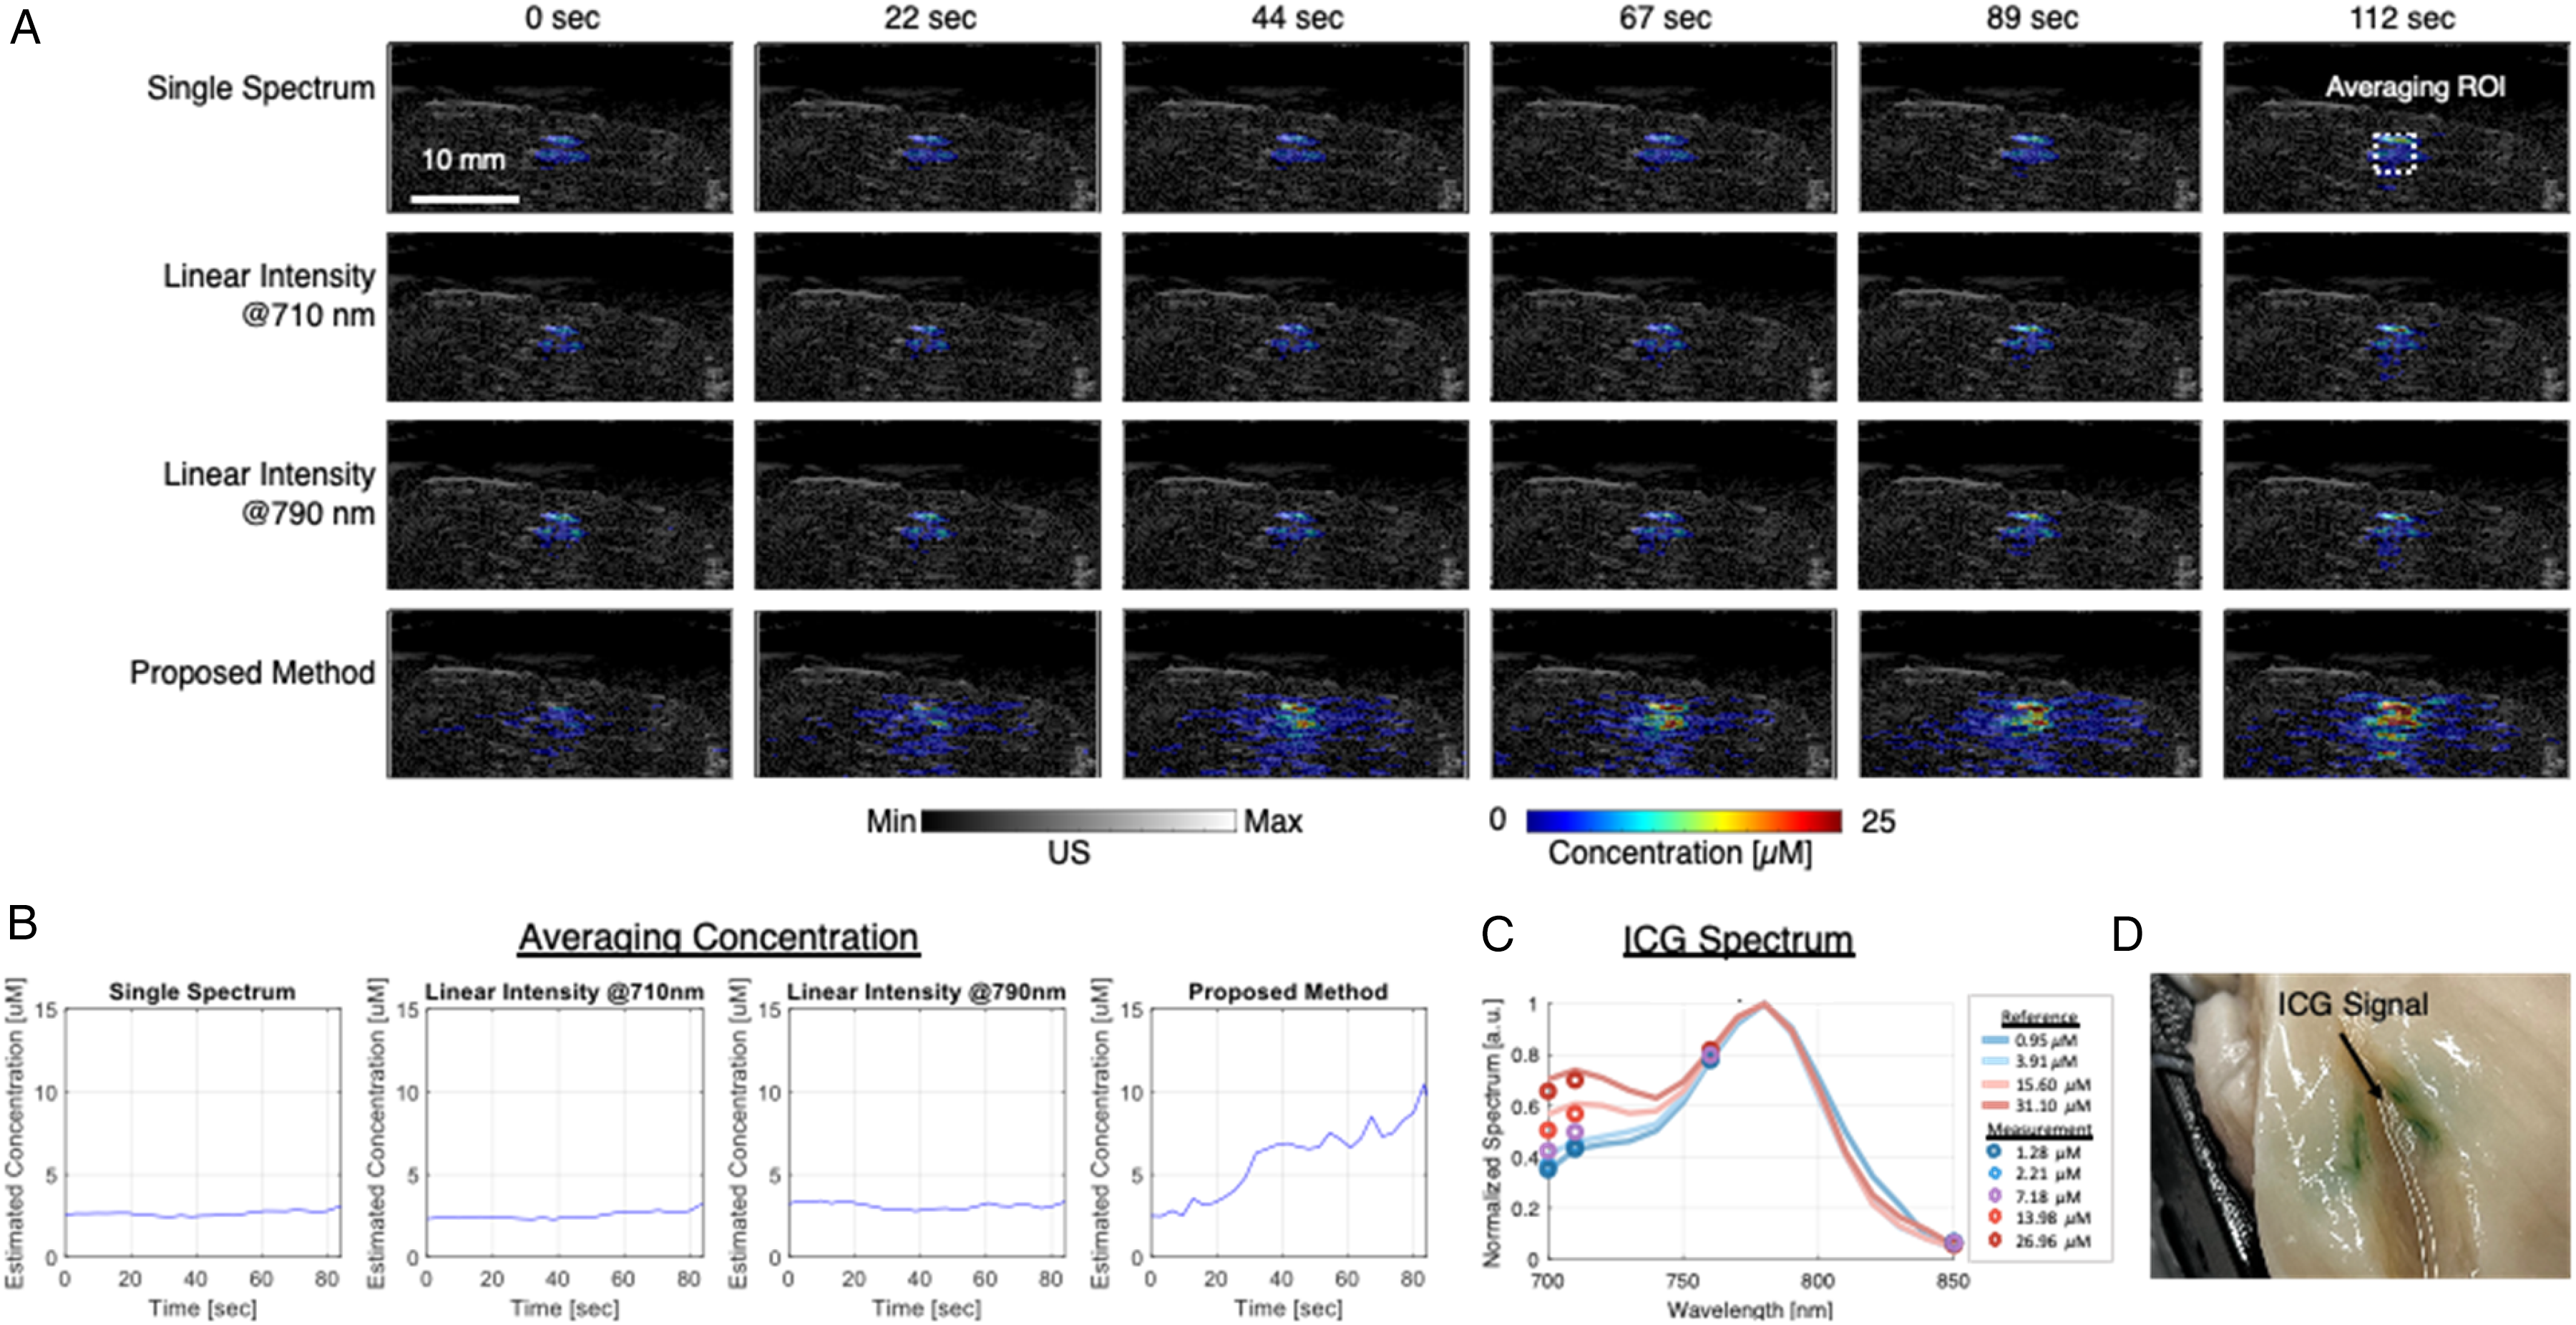
(A) Quantification of contrast agent concentrations using different methods at various time points after injection. (B) Average concentration measurements within the region of interest (ROI) over the injection period. (C) Measured ICG spectra at pixels corresponding to different concentrations, compared against the reference ICG spectra used in the spectral library. (D) Photo of the postinjection sample confirming visible indocyanine green (ICG) color.
In comparison, concentration estimation using conventional methods was performed. Single-wavelength PA intensities at 710 and 790 nm, capturing the primary and secondary peaks of the ICG spectrum, were used for estimation, along with single-spectrum estimation using the 25 µM ICG spectrum. Both methods detected an increase in concentration, but the measured values were significantly lower than 25 µM, and no substantial changes were observed around the injection tube. The average concentrations around the tube under different methods were quantified. The region of interest (ROI) was selected as shown in Figure 10A, and the averaged concentrations are plotted in Figure 10B. The results align with the visualizations, where the single-spectrum and linear-intensity methods captured only minor increases, with values below 5 µM. In contrast, the proposed method detected a significant increase in concentration starting at 10 s, reaching up to 10 µM within the ROI. The spectra at pixels corresponding to different concentration measurement are shown in Figure 10C. The spectral intensity point was plotted and compared against the reference ICG spectra at various concentrations used in the spectral library. Figure 10D shows a photograph of the sample postinjection, indicating visible ICG expansion.
Discussion
The PSMA-targeted CA was scanned at 6 concentrations, and their PA spectra were acquired. The selected CA exhibited nonlinear PA behavior with increasing concentration. Specifically, the peak intensity at 790 nm decreased as the concentration increased, and a secondary peak emerged at a shorter wavelength. This spectral shift and shape alteration at higher concentrations posed significant challenges for the spectroscopic decomposition algorithm when relying on a single-spectrum reference. This limitation was evident in the results of the single spectrum method, where estimated concentrations remained close to the reference spectrum concentration without reflecting the actual increases.
In both simulation and in vitro testing, the single spectrum method failed to accurately estimate the rising concentrations of the CA, consistently predicting all samples near the reference spectrum concentration of 2 µM. The estimation error was particularly high, reaching 38 µM at the 40 µM sample concentration. Similarly, the linear intensity modeling method struggled to track the concentration, particularly with this CA, which exhibited the unique optical property of reduced peak intensity as concentration increased.
Our proposed algorithm showed superior accuracy, with a stronger linear correlation to the sample concentrations and smaller estimation errors compared to the other methods. The proposed method reduced the average estimation error to 1.80 µM, a significant improvement over the single spectrum method (15.89 µM averaging error) and the peak intensity fitting method (7.66 µM averaging error). The maximum estimation error with our method was under 8 µM, highlighting its robustness in quantifying CA concentrations more reliably.
The ex vivo study highlighted the effectiveness of the proposed method in quantifying ICG concentration. ICG has similar spectral property as SRF0715 CA used in previous experiments while its visible green color helps the visual inspection of its distribution during injection. While conventional methods detected an increase in concentration during the injection, the measured values were lower than the injected CA concentration. In contrast, the proposed method estimated concentrations closer to the original solution concentration of 25 µM and successfully visualized the penetration of ICG into the tissue, rather than its accumulation at the tube end as suggested by conventional methods. This observation aligns with the postinjection sample photo, where a green coloration was visible in the surrounding region. The spectrally varying ICG spectra collected at different concentration pixel support this observation and illustrate how the algorithm accounts for concentration-dependent spectral changes in tissue environment. Although the trend of ICG accumulation was compared across methods and the postinjection sample, the true distribution during the injection could not be directly verified.
Despite these promising results, the proposed method has several limitations. First, the algorithm was tested with only 2 specific CAs, limiting the assessment of the generalizability of the proposed method. To validate the broader applicability of the method, further studies should investigate its performance across a variety of CAs with different optical properties. Second, the method should be evaluated in more complex, multichromophore environments to simulate in vivo conditions more closely. Testing in such environments will be crucial for assessing the algorithm's accuracy and reliability in clinical settings, where multiple PA signal sources are often present.
An important consideration not addressed in the current experiments is spectral coloring, which results from wavelength-dependent light attenuation in tissue. In our design, we intentionally minimized spectral coloring by using water-based phantoms and low-absorbing chicken tissue to isolate and study the effect of spectral nonlinearity alone. While this approach allowed us to clearly validate the proposed method's ability to model and quantify concentration-dependent spectral changes, it limits direct translation to in vivo settings. The future integration with fluence correction techniques is critical to enable accurate quantification in more complex, heterogeneous environments.29,30
In addition, the effects of tissue motion were not explicitly addressed in this study. Motion artifacts arising from systemic circulation or organ movement can distort the recorded spectrum and impair quantification accuracy. While our present study was conducted under static conditions, we have previously developed motion-robust techniques including image-similarity-based cardiac gating 10 and learning-free spectral denoising frameworks. 38 These can be readily integrated with the current method and will be the subject of future work.
Additionally, for future clinical translation, it is important to consider the increased system complexity associated with sPA imaging, which requires multiwavelength laser excitation. However, this capability is now commonly available in clinical-grade systems, and the enhanced diagnostic value, particularly the ability to accurately quantify concentrations of clinically relevant agents like ICG, justifies the added cost.
Overall, this spectral-based quantification method could significantly enhance the accuracy of PA imaging in various applications, particularly in oncology. Precise quantification of CA accumulation is critical for early tumor detection, where accurate assessment of tumor malignancy and extent relies heavily on the concentration and distribution of CAs. By overcoming the limitations of current methods, our algorithm could provide more reliable estimates of CA concentrations, allowing for better differentiation between malignant and benign tissues. The ability to quantify CA concentrations in real-time opens up avenues for intraoperative tumor margin assessment and therapeutic response tracking.
Conclusion
In conclusion, this study presents a novel spectral-based quantification method for accurately estimating the concentration of CAs in PA imaging. Both PSMA-targeted CA and ICG were tested in this study. The proposed method significantly outperforms traditional single spectrum and peak intensity fitting methods, demonstrating reduced estimation errors and a higher correlation with actual concentrations. Despite its success, the method's applicability must be further validated across a broader range of CAs and under more complex, in vivo conditions to ensure its robustness in clinical settings. Future research should focus on refining the algorithm for real-time use and integrating it into existing PA imaging systems, with the potential to enhance tumor detection, surgical guidance, and treatment monitoring in oncology.
Footnotes
Acknowledgments
The authors thank Nicole Hermance and Dr. Amity L. Manning for providing heparinized mouse blood.
Ethical Approval
This study used ex vivo animal tissue experiments and did not require ethical approval.
Author Contributions
SG and HKZ conceptualized the study and designed the experiments. SG led the experimental work, performed data analysis, and drafted the initial manuscript. LS and RM conducted experiments and contributed to data analysis. SB, SR, and MGP assisted with experimental materials and provided ongoing guidance. HKZ supervised the project, provided financial support, and ensured overall guidance and oversight.
Funding
The authors disclosed receipt of the following financial support for the research, authorship, and/or publication of this article: This work was supported by Worcester Polytechnic Institute internal funding, and National Institutes of Health funding under grants: R01CA134675, P41EB024495, and DP5OD028162.
Declaration of Conflicting Interests
The authors declared no potential conflicts of interest with respect to the research, authorship, and/or publication of this article.
Data Availability
The data that support the findings during the current study are available from the corresponding author upon reasonable request.