
Abstract
Background
In rodents, 11β-hydroxysteroid dehydrogenase 1 (11β-HSD1) catalyzes the conversion of inactive 11-dehydrocorticosterone to the active hormone corticosterone. Dysregulation of intracellular glucocorticoid action is implicated in metabolic diseases. Assessing 11β-HSD1 enzyme levels in vivo may be key to understanding obesity pathophysiology.
Objective
We used a Zucker Fatty (ZF) rat model and [18F]AS2471907 PET imaging to determine appropriate kinetic modeling methods and assess changes in 11β-HSD1 levels due to obesity in the liver, white and brown adipose tissue (WAT/BAT), and brain.
Material and Methods
To validate [18F]AS2471907 PET in preclinical models, time-activity curves (TACs) were generated and kinetic modeling was performed with image-derived input functions (IDIFs) extracted from multiple locations. Quantitative estimates of radioligand binding were compared with ex vivo 11β-HSD1 protein expression. Validated quantitative PET kinetic modeling methods were then used to assess differences in 11β-HSD1 between lean and obese ZF rats. Metabolic disease status was confirmed with stable isotopes tracer studies of glucose and fatty acid metabolism.
Results
Obesity is associated with decreased brain 11β-HSD1 levels, measured by [18F]AS2471907 PET, which correlated with measures of glucose and fatty acid metabolism.
Conclusion
We demonstrate that [18F]AS2471907 PET can provide useful quantification of 11β-HSD1 levels in a rodent model of obesity.
Keywords
Introduction
In humans, the intracellular enzyme 11β-hydroxysteroid dehydrogenase type 1 (11β-HSD1) catalyzes the conversion of inactive cortisone to active cortisol. In rodents, 11β-HSD1 catalyzes the conversion of inactive 11-dehydrocorticosterone to active corticosterone, where it provides physiological effects similar to cortisol.1,2 Dysregulation of intracellular glucocorticoid action is implicated in the pathophysiology of metabolic diseases.3,4 Enzyme levels and corresponding activity of 11β-HSD1 in tissues, including the liver, adipose tissue, and brain, may be key to understanding obesity and fatty liver disease pathophysiology.
Multiple methods have been successfully employed to measure the activation of glucocorticoids by 11β-HSD1 in a variety of animal models and clinical populations, including in vitro assays, 5 transgenic or knock-out models,6,7 plasma or urinary metabolites of cortisone and cortisol,8–12 and stable isotope tracers.13–18 More recently, radiolabeled 11β-HSD1 inhibitors have been developed,19,20 and in combination with positron emission tomography (PET) imaging, can be used to measure 11β-HSD1 levels in multiple organs in one PET scan. [18F]AS2471907 has been used to quantify in vivo levels of 11β-HSD1 in the brain,21–24 liver24,25 and adipose tissue24,25 in humans, and Sprague-Dawley rats.
In this study, we assess the feasibility and reliability of [18F]AS2471907 PET to quantify 11β-HSD1 levels in multiple organs in a preclinical model of obesity, the Zucker fatty (ZF) rat. PET imaging of peripheral organs can be complicated by the presence of radiolabeled metabolites. Some radioligands are catabolized in the liver, and as such, validation studies are required to demonstrate that radioligand metabolites are not a significant source of signal in the liver or other peripheral organs. In addition, longitudinal imaging is desirable to examine interventions targeted at altering 11β-HSD1 activity in metabolic diseases. To this end, it is important to assess the reliability and variability of quantitative measures derived from [18F]AS2471907 PET between repeated (test and re-test) scans.
ZF rats have been used previously to characterize the changes in 11β-HSD1 activity between lean and obese strains. 5 To optimize measurement of 11β-HSD1 levels, this current [18F]AS2471907 validation in ZF rats includes several novel analyses that were not performed in the previous preclinical PET study 24 : (1) kinetic modeling approaches performed with the IDIF extracted from multiple locations; (2) test–retest to assess the best overall IDIF and kinetic models for quantification of 11β-HSD1; (3) assessment of blood and tissue radiometabolites; (4) in vivo quantitative estimates of radioligand binding compared to ex vivo measures of 11β-HSD1 protein expression; (5) validated quantitative PET kinetic modeling methods to assess differences in 11β-HSD1 between lean and obese ZF rats; and (6) metabolic disease status confirmed with stable isotopes tracer studies of glucose and fatty acid metabolism.
Given the role of glucocorticoids in regulating glucose and fatty acid metabolism, 1 we hypothesized that 11β-HSD1 levels measured by PET would correlate to stable isotope measures. Thus, the overall goal of this study was to demonstrate that [18F]AS2471907 PET can provide reliable quantification of 11β-HSD1 levels in a rodent model of obesity in multiple organs: liver, white and brown adipose tissue, and brain.
Methods
Preclinical Animals
Three separate cohorts of ZF rats were used to assess: (1) PET quantification methods, (2) radioligand metabolites in liver tissue, and (3) cross-sectional PET and stable-isotope tracer studies in lean and obese strain ZF rats. All animal studies were conducted under the approval of the Yale Institutional Animal Care and Use Committee (#2022-11547).
Cohort 1–Validation of PET Quantification of 11β-HSD1 levels of Zucker Fatty Rats
PET/CT Acquisition
The first cohort consisted of five (4F/1M) lean strain ZF rats (mean weight = 251 ± 72 g; 10 weeks old, Charles River; Strain 186). Rats were permitted to feed ad libitum prior to imaging. Rats were injected with [18F]AS2471907 via the tail vein. List-mode PET data were acquired on the Inveon PET/CT scanner (Siemens Preclinical Systems, Knoxville, TN, USA) for 60 min and rebinned into frames of 12 × 10 s, 6 × 30 s, 1 × 60 s, 2 × 120 s, and 10 × 300 s. All animals had a low-dose CT acquisition after the PET acquisition to provide attenuation and scatter correction. To assess test–retest variability, the same five lean strain ZF rats (weight: 263 ± 93 g) were imaged again with [18F]AS2471907 PET 15 ± 11 days later (minimum of 7 days). At the end of the second PET/CT acquisition, blood samples were taken prior to euthanasia, processed, and analyzed to measure the parent radioligand and its radioactive metabolites at the end of scan (∼60 min) using a high-performance liquid chromatography (HPLC) method previously described. 26 The parent fraction was calculated as the ratio of the sum of radioactivity fractions containing the parent compound to the total amount of radioactivity collected.
PET/CT Quantification
All PET images were reconstructed with the vendor provided software. Images were reconstructed with 3-D ordered subset expectation maximization (3D-OSEM) – maximum a posteriori (MAP) (two 3D-OSEM iterations with 16 subsets followed by 25 MAP iterations), with target resolution of 0.8 mm (β = 0.0023), chosen based on our previous methodology optimization for preclinical PET quantification.
24
Three IDIFs were evaluated for input into the kinetic models; (1) aortic arch, (2) abdominal aorta (between the liver and kidneys), and (3) aorta below the kidneys. Each IDIF was generated using a cylindrical ROI of


Immunoblotting Assay
The liver (left lateral or medial lobe), intrascapular BAT and brain tissue samples were extracted post-mortem from rats after their last scan to correlate in vivo PET quantification estimates to 11β-HSD1 protein content measured ex vivo. Tissue was homogenized in ice-cold homogenization buffer with protease and phosphatase inhibitors (cOmplete MINI + PhosSTOP (Roche)). Proteins were resolved by SDS-PAGE using a 4%–12% gradient gel and electroblotted onto polyvinylidene difluoride membrane (DuPont) using a semi-dry transfer cell. The membrane was then blocked with 5% (w/v) bovine serum albumin, and incubated overnight with the primary antibodies: 11β-HSD1 (Abcam AB39364, 1:2000) and HSP90 (BD Bioscience 610419, 1:1000). After washing, membranes were incubated with horseradish peroxidase-conjugated anti-rabbit secondary antibody (Cell Signaling Technology 7074s, 1:5000) for 60 min. Detection was performed with enhanced chemiluminescence.
Cohort 2–Measurement of Radiolabeled Metabolites in the Liver Tissue of Zucker Fatty Rats
To measure radiolabeled metabolites that may be present in the liver tissue, an additional cohort of lean strain ZF rats (2M/2F; 10 weeks old, Charles River; Strain 186), permitted to feed ad libitum prior to the study, were injected with [18F]AS2471907 via the tail vein. Rats were euthanized after circulation time of 30 min (1M/1F), or 60 min (1M/1F) and the left lateral or medial lobe liver was removed. Two to three grams of tissue from each liver was denatured and homogenized in equal volumes of cold methanol (∼4°C) and water on ice using a Polytron PT1200E tissue homogenizer (Luzern, Switzerland). The homogenized sample (0.5 mL) was then diluted with 4.5 mL saline and centrifuged at 4°C for 10 min at 14,000 rpm with an Eppendorf 5417R benchtop centrifuge (Hauppauge, NY, USA) to precipitate the proteins. The supernatant (1.0 mL) was analyzed by reverse phase analytical HPLC (column: Phenomenex Luna C18(2) analytical column (5 μm, 4.6×250 mm); mobile phase: 60% 0.1 M ammonium formate and 40% acetonitrile (v/v); flow rate: 1.5 mL/min) to determine the fractions of parent tracer and metabolites.
Cohort 3 – Cross-sectional studies in Zucker Fatty Lean and Obese Strain Rats
PET/CT
Lean strain ZF rats (3F/1M; F: 193 ± 13 g, M: 478 g; 10 weeks old, Charles River; Strain 186) and obese strain ZF rats (3F/2M; F: 403 ± 20 g, M: 754 ± 21 g; 10 weeks old, Charles River; Strain 185), permitted to feed ad libitum prior to the study, were injected with [18F]AS2471907 via tail vain. PET acquisition and image reconstruction parameters were identical to those used in Cohort 1. The liver, brain, and intrascapular BAT ROIs were drawn on summed PET images from 30 to 60 min and TACs generated. Visceral white adipose tissue (WAT) was drawn on the co-registered attenuation CT image, including the region from the bottom of the liver to the kidneys, and applied to the PET images to generate a visceral WAT TAC. An IDIF was extracted from the aortic arch and VT estimated using MA1 (liver, t* = 40 min; visceral WAT and intrascapular BAT, t* = 20 min; and brain t* = 10 min), as determined from test–retest data in Cohort 1. SUV and SUVR were also calculated. Pearson's correlations of VT to semi-quantitative SUV and SUVR measurements were explored. Corrections for ROI volume changes between lean and obese animals were calculated as SUVR × ROI volume (cm3), which gives a measure of aggregate 11β-HSD1 level in that organ. Significance testing was examined using unpaired t test with Welch's correction.
Stable-Isotope Tracing of Glycerol Metabolism in Adipose Tissue
Stable-isotope tracing of glucose and glycerol (fatty acid) metabolism was assessed in a subset of animals in Cohort 3: 4 lean strain (3F/1M; 371 ± 43 g; Charles River; Strain 186) and 3 obese strain (1F/2M; 643 ± 24 g; Charles River; Strain 185) ZF rats. After PET scanning, rats underwent surgery under general isoflurane anesthesia to place polyethylene catheters in the jugular vein and carotid artery (Instech Solomon PE90 and PE50, respectively). After 7 days of recovery (23 ± 12 days after PET scans), rats were fasted overnight. Following 5 min 3X prime, rats underwent a basal infusion of 100% [1,2,3,4,5,6,6-2H7]glucose (0.5 mg/kg/min) and [1,1,2,2,3-2H5]glycerol (0.25 mg/kg/min) through the arterial catheter for 115 min. Blood samples were obtained from the jugular venous catheter at 100, 110, and 120 min of the basal infusion. A hyperinsulinemic-euglycemic clamp was then initiated, with infusion of regular insulin in 1% artificial plasma through the arterial catheter at a rate of 4.0 mU/kg/min. Infusion of [1,1,2,2,3-2H5]glycerol infusion continued, but was lowered to a rate of 1.5 mg/kg/min, while infusion of 100% [1,2,3,4,5,6,6-2H7]glucose was replaced with 20% [1,2,3,4,5,6,6-2H7]glucose/80% [12C]glucose. Blood was drawn every 10–15 min, and the glucose infusion rate was varied until the 100 min time point to maintain euglycemia (100-120 mg/dL), as assessed using a handheld glucometer. After 120 min of the clamp, the study was terminated, catheters were tied off, and the rats were refed.
Gas chromatography-mass spectrometry (GC-MS) was used to measure plasma [2H5]glycerol and [2H7]glucose atom percent enrichment (APE; [2H5]glycerol/total glycerol, and [2H7]glucose/total glucose), as described previously, 31
APE was averaged separately over the 100, 110, and 120 min timepoints in the basal infusion and the clamp, and endogenous turnover was calculated as:

Results
Cohort 1 – Validation of PET Quantification of 11β-HSD1 levels in Zucker Fatty Rats
For test scans, rats received 11.7 ± 4.6 MBq of [18F]AS2471907 (mass dose: 0.17 ± 0.08 µg) and for retest scans rats received 14.4 ± 7.6 MBq of [18F]AS2471907 (mass dose: 0.07 ± 0.05 µg). Representative sagittal (Figure 1A) and axial (Figure 1B) SUV PET/CT images (30-60 min) show high uptake in the liver and moderate uptake in the intrascapular BAT and brain. Representative TACs are shown in Figure 1C for the liver, intrascapular BAT, visceral WAT, brain and aortic arch IDIF throughout the 60-min dynamic scan. A common feature of this radiotracer in preclinical imaging has been the relative flatness of the TACs from 30–60 min post-injection, reflecting equilibrium of the radioligand between the tissue and blood (Figure 1C).

Representative rat whole-body (A) sagittal and (B) axial [18F]AS2471907 PET/CT SUV (30-60 min) images visualizing the liver (purple arrow), brain (blue arrow) and intrascapular BAT (green arrow). Time activity curves (C) of the liver, intrascapular BAT, visceral WAT and brain and aortic arch image-derived input function (IDIF). Scale bar SUV 0-1.5.
Coronal and axial views of representative IDIFs generated for use in kinetic modeling analysis are shown in Figure 2 for the abdominal aorta (Figure 2A), aortic arch (Figure 2B), and infrarenal aorta (Figure 2C). The TAC for each IDIF is displayed in Figure 2D showing differences at later time points, particularly in the abdominal aorta, which increases over time due to spill-in artifacts from the liver, and thus is inappropriate as an IDIF region. The first five minutes of the IDIF TACs also demonstrate differences in the initial phase of the input function (Figure 2E). The infrarenal aorta IDIF has a lower initial peak and is much noisier from 0 to 2 min post injection, leading to shape differences compared to the aortic arch (Figure 2E, black arrow).
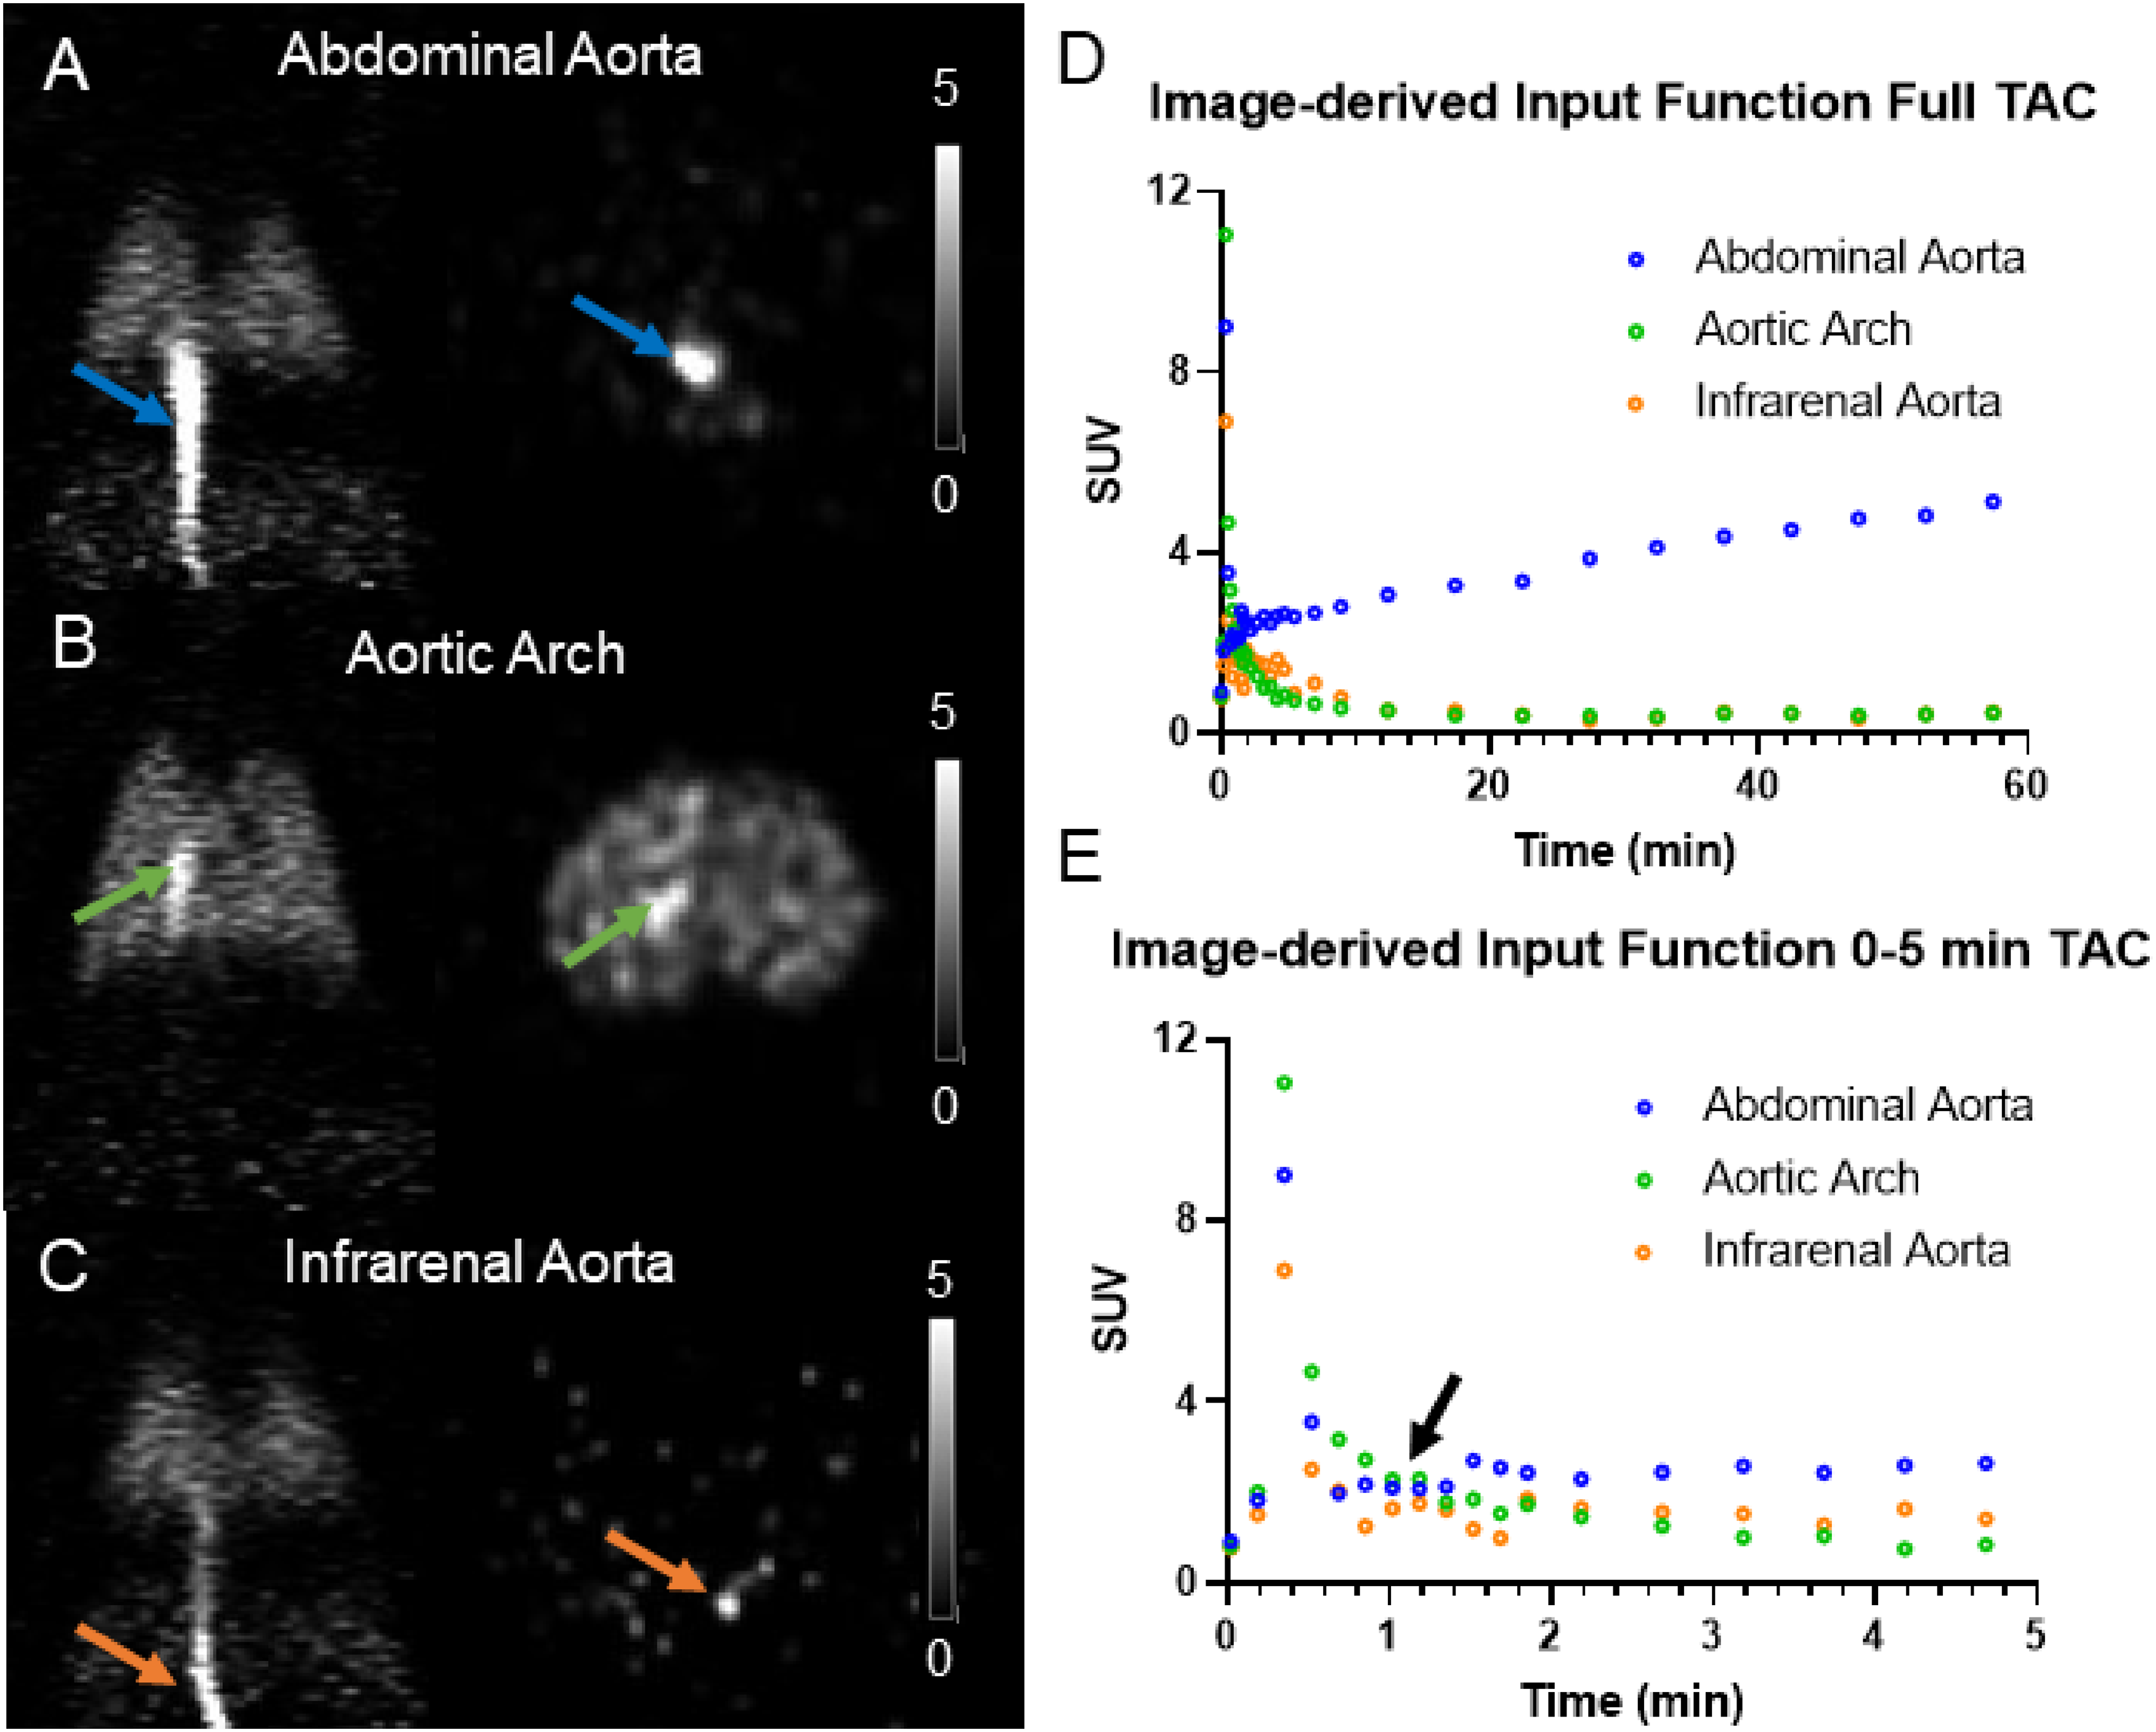
Representative rat coronal (left) and axial (right) [18F]AS2471907 PET SUV (0–30 s) images visualizing the IDIFs for (A) abdominal aorta (blue arrows), (B) aortic arch (green arrows) and (C) infrarenal aorta (orange arrows). Time activity curves for each IDIF for the (D) full 60-min dynamic scan and (E) the first five minutes of the IDIF TAC. Scale bar SUV 0-5.
Test–retest examination of the IDIFs also revealed that the aortic arch was more consistent between scans among all rats with the lowest aTRV of 28 ± 20% (TRV −12% ± 20%), compared to abdominal aorta (aTRV 47 ± 23%; TRV 14 ± 31%) and infrarenal aorta (aTRV 34 ± 24%; TRV −1 ± 44%) (Supplemental Figure S1 and Table S1). Based on these comparisons, the aortic arch was chosen as the appropriate region to generate the IDIF used to estimating parameters with kinetic modeling.
Mean parent fraction of [18F]AS2471907 in plasma was 89 ± 3% at 60 min post injection, as determined by HPLC analysis (Supplemental Table S2 and Figure S2). Therefore, no correction for metabolites was applied to the whole blood IDIF.
The one-tissue compartment model did not provide adequate fits for the liver, BAT, and brain TACs. The 2-tissue compartment model mostly provided adequate fits; however, when TACs were well fitted, the parameter estimates obtained were unrealistic with very high standard errors. Both MA1 and Logan graphical methods provided good fits and reasonable parameter estimates for all regions. Table 1 lists the values of VT, SUVR and SUV for the liver, intrascapular BAT and brain ROIs at baseline and retest scans. It is worth noting that the liver VT estimates have a wide range (∼2‒23 mL/cm3); however, a similarly wide range of VT estimates (∼5‒25 mL/cm3) was seen in the rats used for immunoblotting studies.
Quantitative distribution volume (VT, cm3/mL) and semiquantitative (SUV/SUVR) values from kinetic modeling and test-retest reliability for [18F]AS2471907 PET.
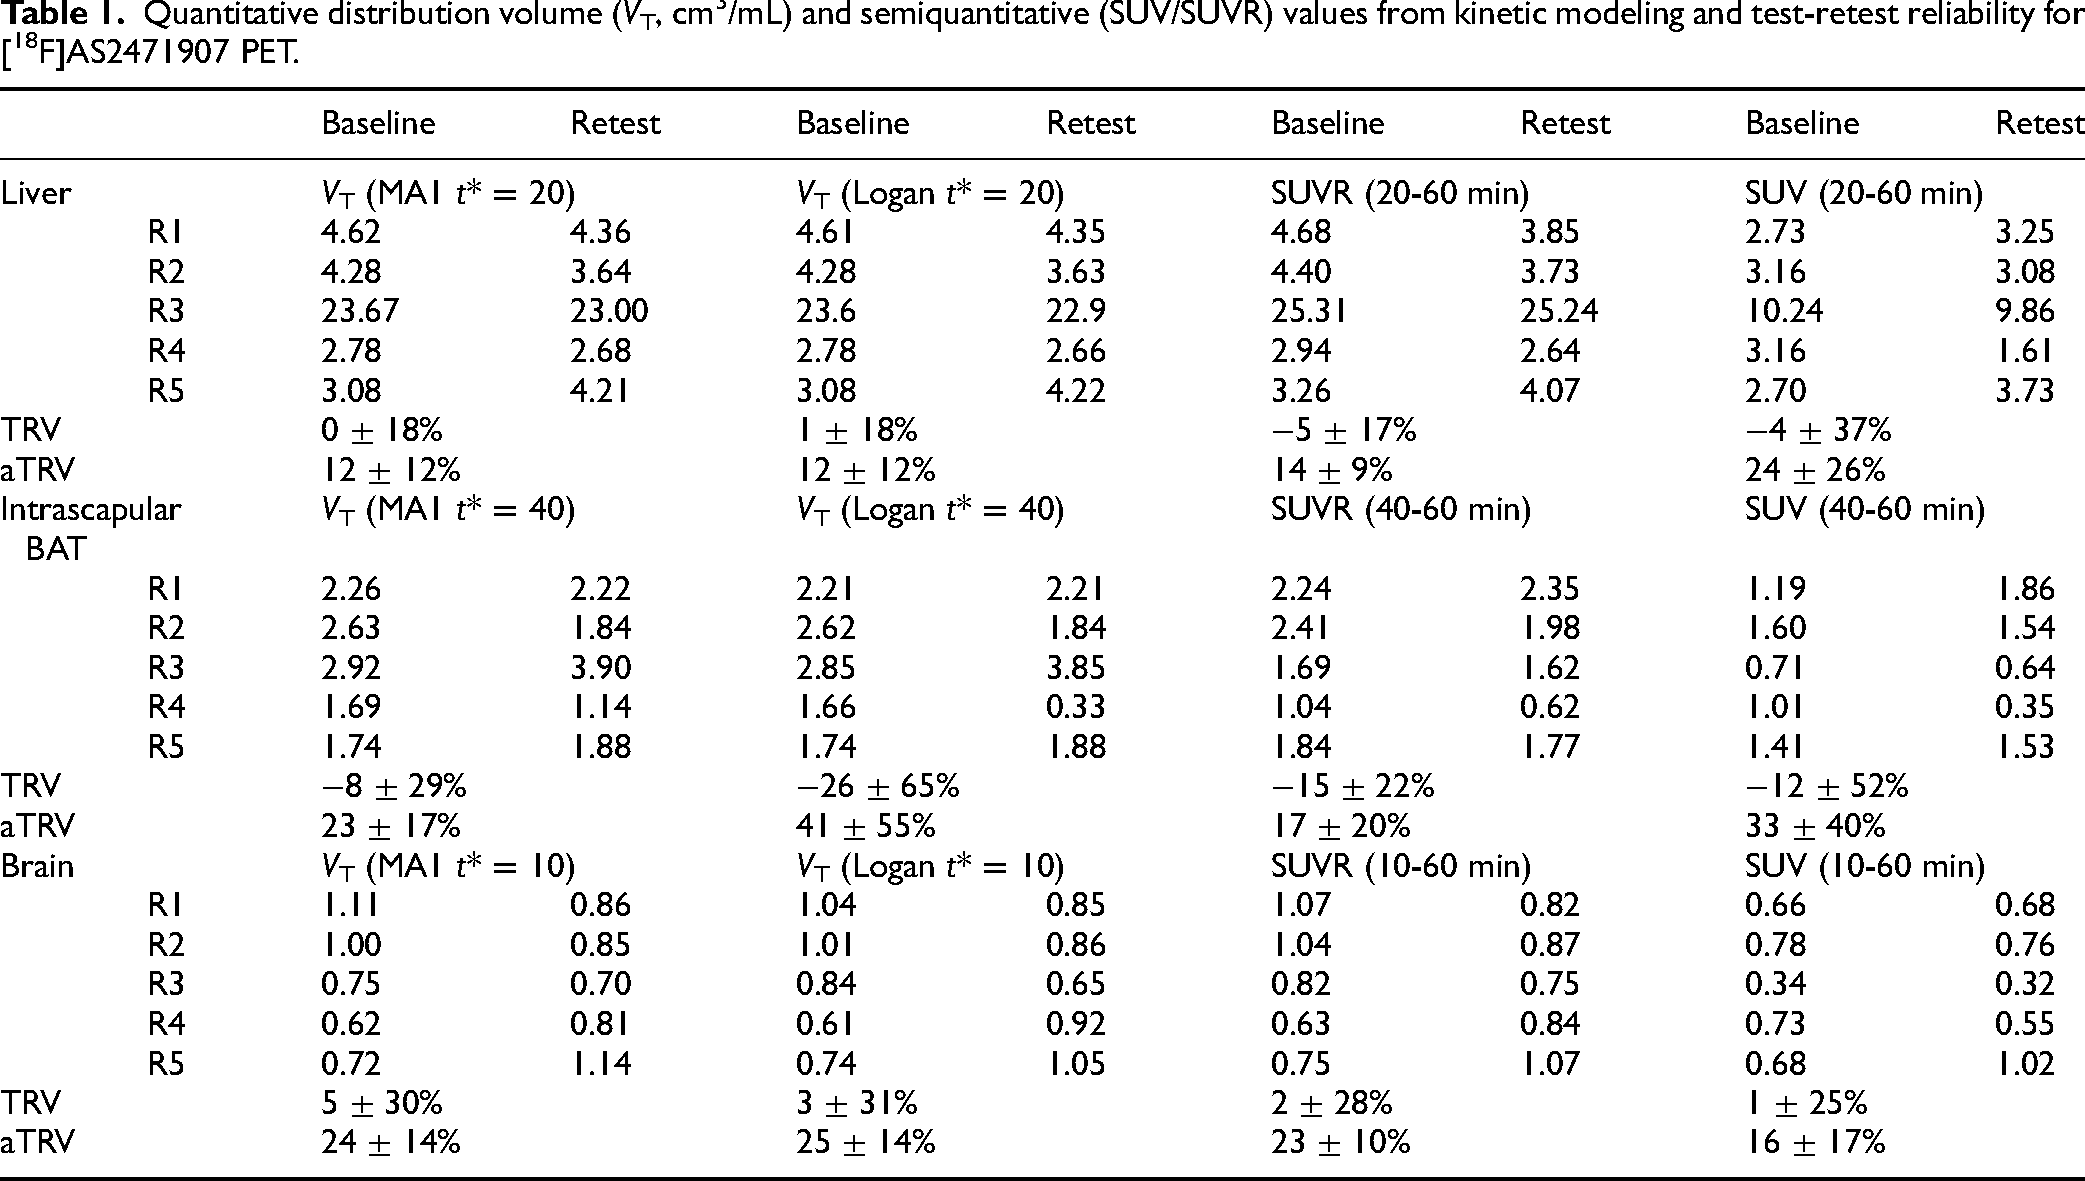
In the liver, VT estimates determined by MA1 with t* = 20 min provided the smallest TRV (0 ± 18%) and aTRV (12 ± 12%) compared to all other t* values. The same was true for the Logan graphical approach (t* = 20 min; TRV 1 ± 18%; aTRV 12 ± 12%). Semiquantitative values of the liver SUVR and SUV had TRV values of −5% ± 17% and −4% ± 37%, respectively (SUVR aTRV 14% ± 9%; SUV aTRV 24% ± 26%).
For intrascapular BAT, VT estimates determined by MA1 with t* = 40 min provided the smallest TRV (−8 ± 29%) and aTRV (23 ± 17%) compared to all other t* values. For Logan graphical approach (t* = 40 min), TRV was much higher (−26 ± 65%) with small variability in TRV (25-28%) between different t* values. Semiquantitative values of intrascapular BAT SUVR and SUV had TRV of −15% ± 22% and −12% ± 52%, respectively, while the aTRV was 17% ± 20% and 33% ± 40%, respectively.
In the brain, TRV was <5% for VT estimates determined by MA1 for any t*, and MA1 with t* = 10 min gave the smallest aTRV (24% ± 14%) compared to other t* values. The same was true for the VT estimates (<5% TRV) by Logan graphical approach with all t* values, with t* = 10 providing the smallest aTRV (25% ± 14%). TRV values were 2% ± 28% and 1% ± 25%, respectively, for the semiquantitative values of brain SUVR and SUV. In contrast to other organs, aTRV was smaller (16% ± 17%) for brain SUV than SUVR (23% ± 10%). Generally, similar TRV was found for SUV and SUVR across all regions. Compared to SUV, aTRV was smaller for SUVR in the liver and adipose tissue, suggesting the utility of correcting for differences in radioligand concentrations in the blood pool for accurate quantification.
Test and retest VT estimates were highly correlated to SUVR in the liver (R2 = 0.99) and brain (R2 = 0.95), but not in intrascapular BAT (R2 = 0.14) (Supplemental Figure S3). Test and retest VT estimates were well correlated to SUV in the liver (R2 = 0.98). However, when the rat with the highest uptake was removed, VT and SUV were not well correlated (R2 = 0.30). Test and retest VT estimates and SUV were not well correlated in intrascapular BAT (R2 = 0.02) and brain (R2 = 0.34) (Supplemental Figure S3). Taken together, these results suggest that, when the blood pool is taken into account the simplified methods could be appropriate for parameter estimates in the liver and brain, but kinetic modeling with MA1 may be required for parameter estimates in intrascapular BAT.
Ex-Vivo Measure of 1β-HSD1 Proteins Levels
In a subset of rats in Cohort 1, Western blot analysis of 11β-HSD1 was performed for the liver, intrascapular BAT, and brain, and results are shown in Figure 3A. Quantification of protein expression from Western blots corresponded well with in vivo estimates of 11β-HSD1 levels by PET imaging with [18F]AS2471907 (Figure 3B and C). Within each animal, the rank order of VT values was consistent with ex vivo estimates of protein content in each organ.

Ex vivo/in vivo correlation of 11β-HSD1 levels in Zucker fatty lean strain rat. (A) western blots for 11β-HSD1 and HSP90 in the liver, intrascapular BAT and brain; (B) quantification of western blot protein content; and (C) corresponding in vivo VT estimates in the same animals. L: liver, F: fat (BAT), B: brain of animals 1–4 (eg, L1/F1/B1: liver of animal 1, fat (BAT) of animal 1 and brain of animal 1).
Cohort 2 – Radiolabeled Metabolites in the Liver Tissue of Zucker Fatty Lean Strain Rats
For tissue metabolite studies, rats were injected with 4.8 ± 0.2 MBq of [18F]AS2471907 (mass dose: 0.65 ± 0.01 µg). Analysis and quantification by HPLC (Supplementary Figure 4) indicated radiolabeled metabolite accounted for only <2% (30 min) and <4% (60 min) of the radioactivity in the liver tissue. This confirms that radioactivity uptake in the liver is primarily due to the parent compound, not radiolabeled metabolites.
Cohort 3 – Cross-sectional studies in Zucker Fatty Lean and Obese Strain Rats
For Cohort 3, rats were injected with 11.4 ± 5.3 MBq of [18F]AS2471907 (mass dose: 0.09 ± 0.03 µg). In Cohort 3, MA1 method fitted all ROI TACs well in this cohort, except for one rat where MA1 did not provide reasonable VT estimates in both intrascapular BAT and visceral WAT. MA1 VT was highly correlated with SUVR in the liver (R2 = 0.95), intrascapular BAT (R2 = 0.86), visceral WAT (R2 = 0.88), and brain (R2 = 0.95) (Supplemental Figure S5). Given the high correlations between MA1 VT and SUVR, we included all nine rats by reporting SUVR and SUVR × ROI volume. Organ volumes were positively correlated with weight in the liver (R2 = 0.89; p < .001), intrascapular BAT (R2 = 0.56; p = .02), and visceral WAT (R2 = 0.62; p = .01). As reported previously in ZF rats,
32
a negative correlation with brain volume and weight was found (R2 = 0.49; p = .04). There were no significant differences in SUVR in the liver and intrascapular BAT but significantly lower SUVR in visceral WAT (lean: 1.46 ± 0.44; obese: 0.48 ± 0.23; p = .01, unpaired t-test with Welch's correction) and brain (lean: 0.61 ± 0.24; obese: 0.24 ± 0.23; p = .04) (Figure 4A to D). After corrections for ROI volume, only brain SUVR × ROI volume (lean: 1.15 ± 0.46; obese: 0.40 ± 0.14; p = .04) was significantly lower in obese versus lean rats

Group comparisons of SUVR for (A) the liver, (B) intrascapular BAT, (C) visceral WAT, and (D) brain. Group comparison of SUVR multiplied by organ volume to calculate aggregate specific binding signal in each organ for (E) the liver, (F) intrascapular BAT, (G) visceral WAT, and (H) brain. Animals are also labeled by sex: female (green dots) and male (blue dots).
Several parameters from stable isotope tracer studies of glucose metabolism were altered in obese versus lean rats. Glucose infusion rate (GINF) (100-120 min) was significantly lower in obese rats (lean: 9.8 ± 1.6 mg/kg/min; obese: 2.9 ± 0.3 mg/kg/min; p = .002, unpaired t-test with Welch's correction), consistent with systemic insulin resistance; while clamped plasma glucose (100-120 min) was not different (lean: 109.8 ± 4.4 mg/dL; obese: 114.0 ± 5.0 dL; p = .32). In obese rats, basal endogenous glucose production (EGP) was higher (lean: 7.4 ± 0.6 mg/kg/min; obese: 17.3 ± 1.6 mg/kg/min; p = .005), as well as clamp EGP (lean: 2.3 ± 0.3 mg/kg/min; obese: 16.3 ± 0.8 mg/kg/min; p = .002). EGP suppression was lower in obese rats (lean: 70 ± 5%; obese: 6 ± 10%; p = .004), demonstrating marked hepatic insulin resistance in the obese animals.
For stable isotope tracer studies of fatty acid metabolism, basal glycerol level was higher in obese rats (lean: 34.5 ± 3.0 µmol/kg/min; obese: 51.8 ± 3.4 µmol/kg/min; p = .002), as well as clamp glycerol (lean: 17.7 ± 3.5 µmol/kg/min; obese: 46.6 ± 4.8 µmol/kg/min; p = .002). Glycerol turnover suppression was lower in obese rats (lean: 48 ± 11%; obese: 10 ± 4%; p = .003), demonstrating adipose tissue insulin resistance.
Of the volume-corrected SUVR measures

Glucose and glycerol stable isotope parameters: (A) glucose infusion rate (GINF), (B) clamp glycerol turnover, and (C) glycerol turnover suppression, were significantly correlated with the brain SUVR × volume. Animals are labeled according to lean (green) and obese (orange) and female (circles) and male (squares).
Without adipose tissue volume correction, visceral WAT SUVR was negatively correlated with basal (R2 = 0.60, p = .04) and clamp EGP (R2 = 0.68, p = .02), and positively correlated with EGP suppression (R2 = 0.68, p = .02). In addition, visceral WAT SUVR was negatively correlated with basal (R2 = 0.70, p = .02) and clamp glycerol turnover (R2 = 0.69, p = .02), and positively correlated with glycerol turnover suppression (R2 = 0.60, p = .04).
Despite expanding visceral WAT volume, aggregate 11β-HSD1 levels are unchanged between lean and obese rats (Figure 4G), but still correlated with measures of whole body (glucose) and adipose tissue (glycerol) insulin sensitivity, suggesting an interplay of brain and visceral WAT 11β-HSD1 levels.
Discussion
In this study, we used a ZF rat model and PET imaging with the radioligand [18F]AS2471907 to determine appropriate kinetic modeling methods for quantitative analysis of imaging data in the brain and peripheral tissues, and assess changes in 11β-HSD1 levels during obesity in the liver, BAT, WAT and brain. To validate [18F]AS2471907 PET in preclinical models, TACs of [18F]AS2471907 were generated from multiple organs, and kinetic modeling was performed with IDIFs extracted from multiple locations. Negligible levels of radiolabeled metabolites in the blood and liver tissue allowed estimation of kinetic modeling parameters in the brain, liver, and adipose tissue depots with adequate test–retest variability, which was comparable to that in human brain [18F]AS2471907 PET studies. 21 Furthermore, quantitative parameter estimates from kinetic modeling corresponded with ex vivo measures of 11β-HSD1 protein expression (Figure 3). Optimized quantitative PET kinetic modeling methods were then used to assess differences in 11β-HSD1 levels between lean and obese strain ZF rats. Metabolic disease status was also confirmed with stable isotopes tracer studies of glucose and fatty acid metabolism. Overall, we demonstrate that [18F]AS2471907 PET can provide useful quantification of 11β-HSD1 levels in a rodent model of obesity.
Inspection of [18F]AS2471907 TACs in the liver, adipose tissue, and brain (Figure 1), indicated that, as expected, steady-state equilibrium was reached at variable times for different organs, which was also reflected in different optimal t* values for each organ in kinetic analysis using the for MA1 method (Table 1). Uptake into the liver and brain appeared to be rapid, while uptake into the adipose tissue was slower, as reflected by a t* of 40 min for adipose tissue in the MA1 analysis. This also contributed to the poorer relationship between SUVR and MA1 VT values in adipose tissue (Supplemental Figure S3).
Three locations for IDIF extraction were examined (Figure 2): the abdominal aorta, aortic arch, and infrarenal aorta. Previously, we implemented an abdominal aorta IDIF in in two Sprague-Dawley rats because it was relatively easy to visualize on early PET frames (0-30s) using a rapid bolus injection of the radioligand. 24 However, when imaging a larger cohort of animals in this study, a noticeable rise in abdominal aorta IDIFs during late scan times suggested significant spill-in from the liver, making it an inadequate choice for repeat measurement of an IDIF. The section of the abdominal aorta chosen for IDIFs is surrounded by the liver, an organ with very high radioligand uptake, causing spill-in to the aorta IDIF due to partial volume and tissue fraction effects. The aortic arch can be visualized in early PET frames (0-30s), albeit with early lung uptake background (Figure 2) due to the high vascularization of lung tissue. However, since there is very little specific binding of the radioligand in the lung tissue, there is no spill-in effect potentially hindering reliability and reproducibility of the IDIF in later time frames. Due to the limited field-of-view (FOV) of the PET scanner in the axial direction, the infrarenal aorta IDIF is at the edge of the PET scanner FOV. With poorer system sensitivity in this region, the IDIF becomes quite noisy, as can be seen in the unevenness of the infrarenal IDIF curve (Figure 2, black arrow). As a result, for this animal model, the aortic arch is the location where the most consistent IDIF can be extracted (Supplemental Figure S1 and Table S1). Unfortunately, arterial blood sampling was not performed to allow for the “gold standard” kinetic modeling analysis with full arterial input function and future studies will need to confirm the accuracy of the IDIF choice. Nonetheless, kinetic modeling estimates compared well with ex vivo protein measurements, increasing the confidence that the IDIFs and overall kinetic modeling methods produced useful quantitative results, particularly because accounting for radioligand blood concentrations using VT or SUVR, with blood as the reference region, rather than SUV was more consistent with ex vivo protein measurements.
For the validation of a novel radioligand in quantitative PET imaging application, knowledge of its radioactive metabolites in blood and tissue is important, particularly if the targets of interest are peripheral organs that are the primary site of metabolism (e.g., the liver). [18F]AS2471907 has very low radiolabeled metabolites both in blood and liver tissue. The unmetabolized parent radioligand fraction was >89% in blood throughout the duration of the PET scan in rats (Supplemental Table S2 and Figure S2), demonstrating high metabolic stability of the radioligand. As a result, very little radiolabeled metabolites were detected in the liver tissue, <1% in male rats, and <4% in females (Supplemental Figure S4), indicating that almost all the signal in the liver is from the parent compound, and thus making [18F]AS2471907 an ideal radioligand for examining 11β-HSD1 levels in the liver, and other peripheral organs.
The one-tissue compartment model did not provide adequate fits for the liver, adipose tissue, and brain TACs. The 2-tissue compartment model mostly provided adequate fits; however, when TACs were well fitted, the parameter estimates obtained were unrealistic with very high standard errors. This is consistent with our previous results from kinetic modeling of [18F]AS2471907 imaging data in Sprague-Dawley rats. 24 The MA1 and Logan graphical analysis both provided appropriate fits at multiple t* values, with MA1 providing lower aTRV in all organs and thus the kinetic model of choice in the current study. The aTRV values of MA1, VT or SUVR, were between 12%–24% (Table 1), comparable to those of MA1 VT in the human brain study (10-27%) using [18F]AS2471907. 21 The ZF lean rats gained on average 4% body weight between test and retest scans. Therefore, aTRV seen here mostly reflects the inherent variability of any imaging technique, rather than physiological variation due to growth between scans, especially since the aTRV values are similar to that of the human brain study.
In this study, we chose t* values that would provide the lowest TRV and aTRV. Future studies may consider optimizing the choice of t* values where TRV is not necessarily lowest in order to enhance group differences where differential diagnosis may be the desired outcome.
SUVR had higher correlation with MA1 VT than SUV for both the test and retest scans (Supplemental Figure S3). In the cohort undergoing longitudinal scanning there appeared to be one rat as outlier with high liver VT. However, similar liver VT estimates (20-25 mL/cm3) were seen in the subset of rats undergoing both scanning and ex vivo 11β-HSD1 validation (Figure 3). Given the overall data presented inclusion of the single rat with high liver VT value does not appear to skew the correlation analysis. Indeed, removal of the animal with high liver VT value still resulted in high correlation between VT and SUVR, as can be seen from the inset in each plot (Supplemental Figure S3).
Results from examination of protein expression levels by Western blot corresponded well with in vivo estimates of 11β-HSD1 levels by [18F]AS2471907 PET imaging (Figure 3). Protein levels in the liver assessed ex vivo demonstrated consistency with the range of liver VT estimates (5-25 mL/cm3) seen in rats throughout the study. Consistency in the rank order of protein expression (liver > intrascapular BAT > brain) with VT estimates was also evident across organs in each animal. In the present study protein expression in visceral WAT was not examined in lean strain ZF rats, and will need to be assessed in future studies.
Results from the initial validation study indicated that [18F]AS2471907 PET is an appropriate tool to assess 11β-HSD1 levels (Cohorts 1 and 2). Therefore, we performed a preliminary study in lean and obese strain ZF rats (Cohort 3). Brain SUVR of [18F]AS2471907 was significantly lower in obese compared to lean rats (Figure 4). Visceral WAT SUVR was also significantly lower in obese rats; however, given the large increase in visceral WAT mass present in ZF obese strain rats, SUVR × volume was used as a measure of aggregate 11β-HSD1 levels in visceral WAT. When this metric was used, no difference was found in 11β-HSD1 levels in visceral WAT between the lean and obese rats. Visceral WAT is thought to be the main contributor to the generation of nonadrenal peripheral cortisol via 11β-HSD1 enzyme activity. Our results suggest no changes in aggregate 11β-HSD1 levels in visceral WAT of obese versus lean rats. In a study examining 11β-HSD1 enzyme activity in the same lean and obese strain ZF rat model, increased 11β-HSD1 enzyme activity was found in omental WAT of obese rats. 5 This suggests the possibility that although the levels of 11β-HSD1 enzyme are unchanged in omental WAT, activity of the enzyme may be increased, leading to increase in nonadrenal cortisol production.
Obesity results in slightly lower brain volumes, which has been confirmed in ZF rat models 32 and human studies of obesity. 33 After correction for brain volumes, SUVR × volume (aggregate 11β-HSD1) in the brain was still significantly lower in obese rats, suggesting that overall brain 11β-HSD1 levels are reduced. This mirrors what was seen in the human brain, with [18F]AS2471907 uptake negatively correlating with increasing body mass index. 23
Interestingly, our present study found no difference in the liver 11β-HSD1 levels (SUVR or SUVR × volume) between lean and obese rats, although a previous study observed reduced liver enzyme activity in a ZF model, 5 supporting at least in a ZF rat model of obesity, that the liver does not appear to be a primary nonadrenal source of cortisol regeneration. Similar findings have been presented in both human and rodent studies of 11β-HSD1 enzyme activity.5,9,10,14 Future studies combining [18F]AS2471907 PET imaging with stable isotope tracers of cortisol and cortisone 13 in rat models of obesity and metabolic disease would further illuminate the relationship between 11β-HSD1 enzyme levels and enzyme activity.
The role of 11β-HSD1 in local glucocorticoid regulation and thus glucose metabolism has important implications to the pathophysiology of metabolic diseases. To explore these relationships, we performed insulin-mediated glucose infusions in both lean and obese rats. Interestingly, only brain SUVR and SUVR × volume correlated with GINF and higher 11β-HSD1 enzyme levels in lean animals were associated with higher GINF (Figure 5). There is evidence that intracellular glucose 6-phosphate directly regulates 11β-HSD1 activity. 34 Therefore, alterations in glucose metabolism due to insulin resistance may be directly responsible for adjusting the set point of 11β-HSD1 levels and activity. 35
Glucocorticoids are important regulators of adipose tissue lipolysis. We explored the relationship between [18F]AS2471907 binding and adipose tissue lipolysis as assessed by glycerol turnover in basal and insulin-suppressed states. Like glucose metabolism, brain SUVR × volume was significantly correlated with glycerol turnover, the most direct readout of in vivo lipolysis (Figure 5). Lower brain 11β-HSD1 enzyme levels in obese rats were correlated with both higher glycerol turnover during clamp and lower insulin-mediated suppression of glycerol turnover. Obesity and fatty liver disease are associated with increased lipolysis from visceral WAT. 36 While the link between adipose tissue glucocorticoid action and hepatic insulin resistance has been studied in transgenic and knock-out mice,6,37 further study of the relationship between organ specific (e.g., brain vs. visceral WAT) 11β-HSD1 abundance is warranted.
Conclusions
We demonstrated that [18F]AS2471907 PET can provide useful quantification of 11β-HSD1 levels in the brain and peripheral organs in a rodent model of obesity. Validation consisted of several analyses not previously studied in preclinical [18F]AS2471907 PET. These included IDIF extractions from multiple locations, test–retest scans to assess reproducible quantification of 11β-HSD1, assessment of blood and tissue radiometabolites, comparison of in vivo and ex vivo 11β-HSD1 protein expression, PET imaging to assess differences in 11β-HSD1 between lean and obese ZF rats; and finally, correlating 11β-HSD1 protein levels to metabolic disease status.
Overall, obesity is associated with decreased brain 11β-HSD1 levels, which in turn are correlated with measures of both glucose and fatty acid metabolism. Future studies in rodents and humans combining [18F]AS2471907 PET imaging with stable isotope tracers of cortisol and cortisone would further illuminate the relationships between 11β-HSD1 enzyme levels, enzyme activity, and insulin-mediated glucose and fatty acid metabolism.
Supplemental Material
sj-docx-1-mix-10.1177_15353508241301584 - Supplemental material for Quantification of Multi-Organ 11β-Hydroxysteroid Dehydrogenase Type 1 Enzyme Levels in a Zucker Fatty Rat Model: A PET Imaging Study
Supplemental material, sj-docx-1-mix-10.1177_15353508241301584 for Quantification of Multi-Organ 11β-Hydroxysteroid Dehydrogenase Type 1 Enzyme Levels in a Zucker Fatty Rat Model: A PET Imaging Study by Jason Bini, PhD, Jordan Strober, PhD, Michael Kapinos, BS, Ming-Qiang Zheng, PhD, Songye Li, PhD, Jim Ropchan, PhD, Nabeel Nabulsi, PhD, Yiyun Huang, PhD, Rachel J. Perry, PhD, Daniel F. Vatner, MD, PhD and Richard E. Carson, PhD in Molecular Imaging
Footnotes
Acknowledgments
The authors appreciate the excellent technical assistance of the Yale PET Center staff.
Data Availability
Supporting data are available upon request by contacting the corresponding authors.
Declaration of Conflicting Interests
The authors declared no potential conflicts of interest with respect to the research, authorship, and/or publication of this article.
Ethical Approval
All animal studies were conducted under the approval of the Yale Institutional Animal Care and Use Committee (#2022-11547).
Funding
This work was supported by a training grant from the NIDDK (K01DK118005).
Supplemental Material
Supplemental material for this article is available online.
References
Supplementary Material
Please find the following supplemental material available below.
For Open Access articles published under a Creative Commons License, all supplemental material carries the same license as the article it is associated with.
For non-Open Access articles published, all supplemental material carries a non-exclusive license, and permission requests for re-use of supplemental material or any part of supplemental material shall be sent directly to the copyright owner as specified in the copyright notice associated with the article.