
Abstract
Erlotinib is a necessary anticancer treatment for non-small cell lung cancer (NSCLC) patients yet it causes severe side effects such as skin rash. In this study, researchers compared the untargeted compound profiles before and after erlotinib administration to observe changes in blood metabolites in NSCLC patients. The levels of 1005 substances changed after taking erlotinib. The levels of 306 and 699 metabolites were found to have increased and decreased, respectively. We found 5539 substances with peak area differences based on the presence of skin rash. Carbohydrate, amino acid, and vitamin metabolic pathways were altered in response to the onset of erlotinib-induced skin rash. Finally, this study proposed using plasma metabolites to identify biomarker(s) induced by erlotinib, as well as target molecule(s), for the treatment of dermatological toxic effects.
Introduction
Lung cancer has the highest mortality rate of any cancer in the world. 1 Non-small cell lung cancer (NSCLC) is a group of histological subtypes that account for approximately 85% to 90% of all lung cancers. 2 Lung squamous cell carcinoma and lung adenocarcinoma are the most common subtypes of NSCLC. Despite the availability of several treatment options for lung cancer, such as curative intent surgery, radiation, and chemotherapy, there were an estimated 2 million new lung cancer cases and 1.7 million deaths in 2018, and the prognosis remained poor, with a 5-year survival rate of approximately 13%. 1
Erlotinib is a highly selective, orally administered drug that inhibits the tyrosine kinase of the epidermal growth factor receptor (HER1/EGFR). 3 It has been approved for the treatment of NSCLC patients in the United States. In NSCLC patients, erlotinib treatment significantly increases progression-free survival. 4 Erlotinib, on the other hand, has serious side effects such as skin rash, dry skin, diarrhea, and decreased liver function. 4
Metabolomics, a biomedical research strategy, is gaining traction as a method for discovering biomarkers for disease diagnosis and disease progression. Additionally, analysis of metabolites may help identify candidates for novel therapeutic interventions and understand disease mechanisms. 5 Metabolomics has also been applied in the investigation of cancer, particularly in terms of developing early biomarkers for diagnosis and understanding oncogenesis. 6 Because systemic drug treatment affects body metabolism, metabolomics can be a useful tool for investigating the human body’s responses to a drug across a wide range of spectral ranges, and may provide a basic understanding of the drug’s pharmacological actions.
The goal of this study was to look at changes in untargeted metabolite profiles before and after erlotinib administration. Liquid chromatography-mass spectrometry (LC-MS) was used to investigate plasma metabolites from NSCLC patients, and metabolic profiles were analyzed using the public databases Human Metabolome Database (HMDB) and MetaboAnalyst.
Methods
Patients
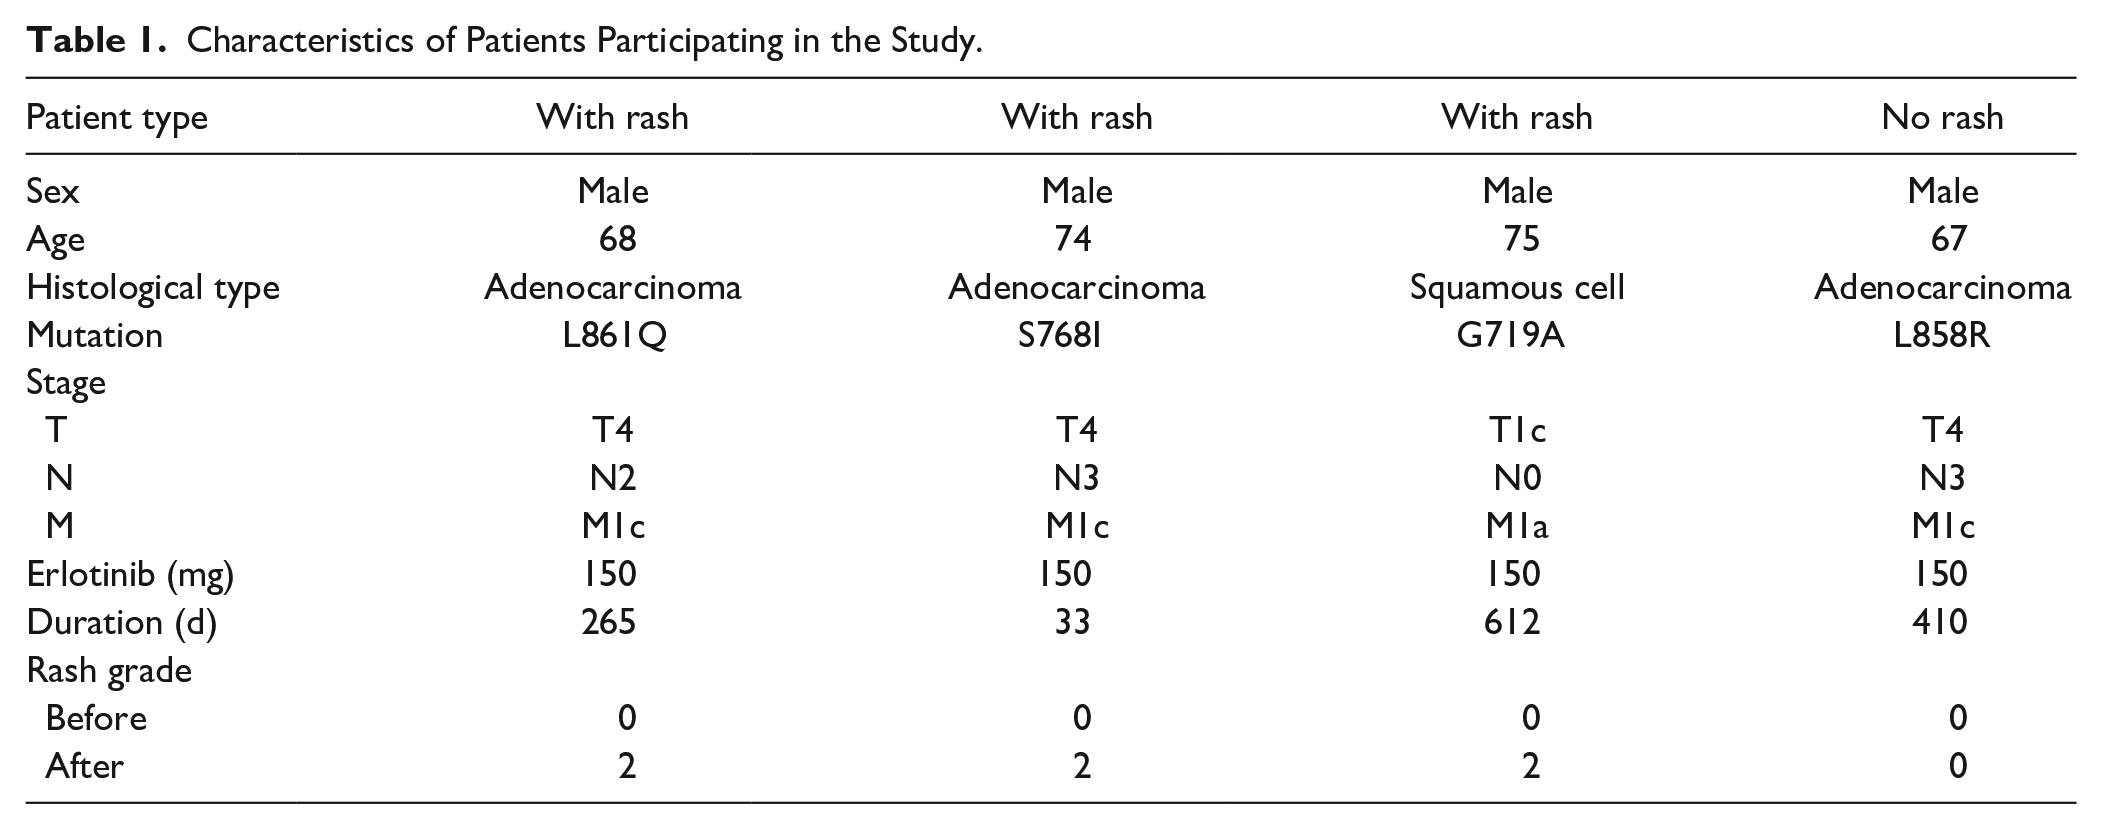
Four Korean patients with advanced NSCLC who were treated with erlotinib at Konyang University Hospital provided patient samples. Prior to sampling, none of the patients received chemotherapy or radiotherapy. Konyang University Hospital obtained appropriate Institutional Review Board permission, and all patients provided written informed consent (2017-10-028). NSCLC was diagnosed by examining lung tissue from the patients and the mutation type was determined by PNAClamp™ Mutation Detection Kit EGFR ver.2 (PANAGENE Inc., Daejeon, Korea) using real-time PCR system (Bioneer, Daejeon, Korea). Cancer stage was determined by the TNM system using eighth edition. 7 A total of 7 patients had agreed to participate in the study. One patient refused erlotinib treatment and was excluded from the analysis during this study. Two patients died during treatment with erlotinib and were excluded. Blood from patients in the study was obtained immediately prior to prescribing erlotinib. All patients were prescribed oral administration of 150 mg erlotinib but not any other anticancer drugs. The dose was not reduced during the prescription period and there were no administration interruptions. Post-dose blood samples were obtained at the patients’ next outpatient visit after their skin rash was assessed by Common Terminology Criteria for Adverse Events (CTCAE) version 5.0. Of the 4 patients in the study, 3 developed grade 2 skin rash after erlotinib administration. The other patient was assessed as grade 0 and was assigned to the no skin rash group (Table 1).
Characteristics of Patients Participating in the Study.
Blood Plasma Preparation
Blood samples were taken from the patients before and after they were given erlotinib. Whole blood was collected in lithium-heparin-coated Vacutainer tubes (BD Biosciences, Franklin Lakes, NJ, USA), and plasma was obtained by isolation of the supernatant obtained by centrifugation of the blood at 1500 × g for 15 minutes. The plasma was stored at −80°C until use.
Metabolomics Analysis
In this study, the metabolites were extracted by a modified Bligh and Dyer method from the plasma. The metabolomics analysis in this study was conducted following the metabolomics analysis method developed by the National Cancer Center Korea, which was established through the validation assessment of the LC-MS analysis. To isolate metabolites in plasma samples, 1 mL of water was added to 50 μL of plasma samples and vortexed. After adding 2 mL of methanol and 0.9 mL of dichloromethane and vortexing, the mixture was incubated on ice for 30 minutes. After the incubation, 1 mL of water and 0.9 mL of chloro-methanol were added to the sample, and centrifuged at 1000 × g for 10 minutes at room temperature. The supernatant of the centrifuged solution was dried using nitrogen gas and then re-suspended with 0.1% formic acid and used for LC-MS analysis. The instrument used for LC-MS analysis was a Shimadzu Nexera X2 system (Shimadzu, Kyoto, Japan) coupled with a Sciex Triple TOF 5600+ system (Sciex, Framingham, MA, USA). Separation was performed with an Atlantis T3 column (3 µm, 2.1 × 100 mm; Waters) and the sample was loaded on an Atlantis T3 sentry guard cartridge (3 µm, 2.1 × 10 mm; Waters, Milford, MA, USA). The mass detection range was set to 50 to 1200 m/z in one full scan, and the top 10 most abundant ions (mass tolerance, 50 mDa; collision energy, 35%) were selected from the measured values, and then LC-MS/MS was performed.
Aligned Mass Spectra and Data Preprocessing
Using the MarkerView software, a list of LC-MS peaks (peak files) was generated for each sample from a measurement file (wiff file) (Sciex, Tokyo, Japan). The following were the process parameters: Minimum retention time (RT): 0.00 minute, subtraction offset: 10 scans, subtraction multiplication factor: 1.3, noise threshold: 10, and minimum RT peak width: 5 scans. Following that, a peak table was generated by importing the peak files into the MarkerView software for all samples at the same time, with the following parameters: the peak table (aligned mass spectra) consisted of 1 peak area column per sample, and a mass value (m/z, mass-to-charge ratio) and RT (min) column common to all samples. The peak areas in the table were normalized using the “total area sums” option. Through multiplication by a scaling factor per sample, the normalization produced the same total peak area for every sample in the peak table. The logarithms of the normalized non-zero peak areas were then computed.
Discovery of Possible Discriminative Low-Mass Ions (LMIs)
The logarithmic peak areas were used to identify LMIs with exceptional discriminative ability (eg, distinguishing between the before and after treatment groups). The following were the simple procedures for assessing individual LMI. (1) For each LMI, a discrimination threshold was determined with an increment of 0.01, with the highest sum of sensitivity and specificity. The thresholds were averaged when more than 1 adjacent threshold demonstrated the same discrimination performance. Furthermore, discrimination ability was determined in cases of perfect discrimination by analyzing the difference between the maximum and minimum thresholds.
Statistical Analysis
For MS peak analysis, quantitative data were analyzed using one-way ANOVA with post-hoc comparison (Scheffe’s test), and differences in average peak area between groups were analyzed through False Discovery Rate (FDR) correction (Benjamini and Hochberg method). MetaboAnalyst enrichment analysis and functional analysis (MetaboAnalyst 5.0, https://www.metaboanalyst.ca/) were used to investigate the relationship between metabolic pathways and metabolomic profiles. For identification of putative metabolites, the public database Human Metabolome Database (HMDB, http://www.hmdb.ca/) was used.
Results
The Plasma Metabolite Levels That Increased in NSCLC Patients After Erlotinib Treatment
The procedure of this study is shown in Supplemental Data 1. First, we investigated the plasma metabolites that increased after erlotinib treatment in patients who had a skin rash. Three patients developed a skin rash after receiving erlotinib treatment, and their metabolite profiles were examined using blood plasma. We performed heatmap analysis with 80 metabolites showing the largest change (Figure 1). After erlotinib treatment, the levels of 306 metabolites increased. Table 2 shows the 10 most highly increased metabolites in lung cancer patients after erlotinib treatment. The m/z and retention time suggested that compounds be estimated based on their chemical properties. Erlotinib levels increased the most in patients (m/z: 394.1745 and retention time: 9.67 minutes), followed by triamcinolone levels (m/z: 395.1777 and retention time: 9.67 minutes). Figure 2A depicts an erlotinib-induced plasma metabolite with a m/z of 380.1577 and a retention time of 8.97 minutes. Before and after erlotinib treatment, the peak areas of this compound were 3.07 0.17 and 4.99 0.23, respectively. Erlotinib treatment increased the compound’s peak area from 2.73 0.32 to 3.81 0.23.
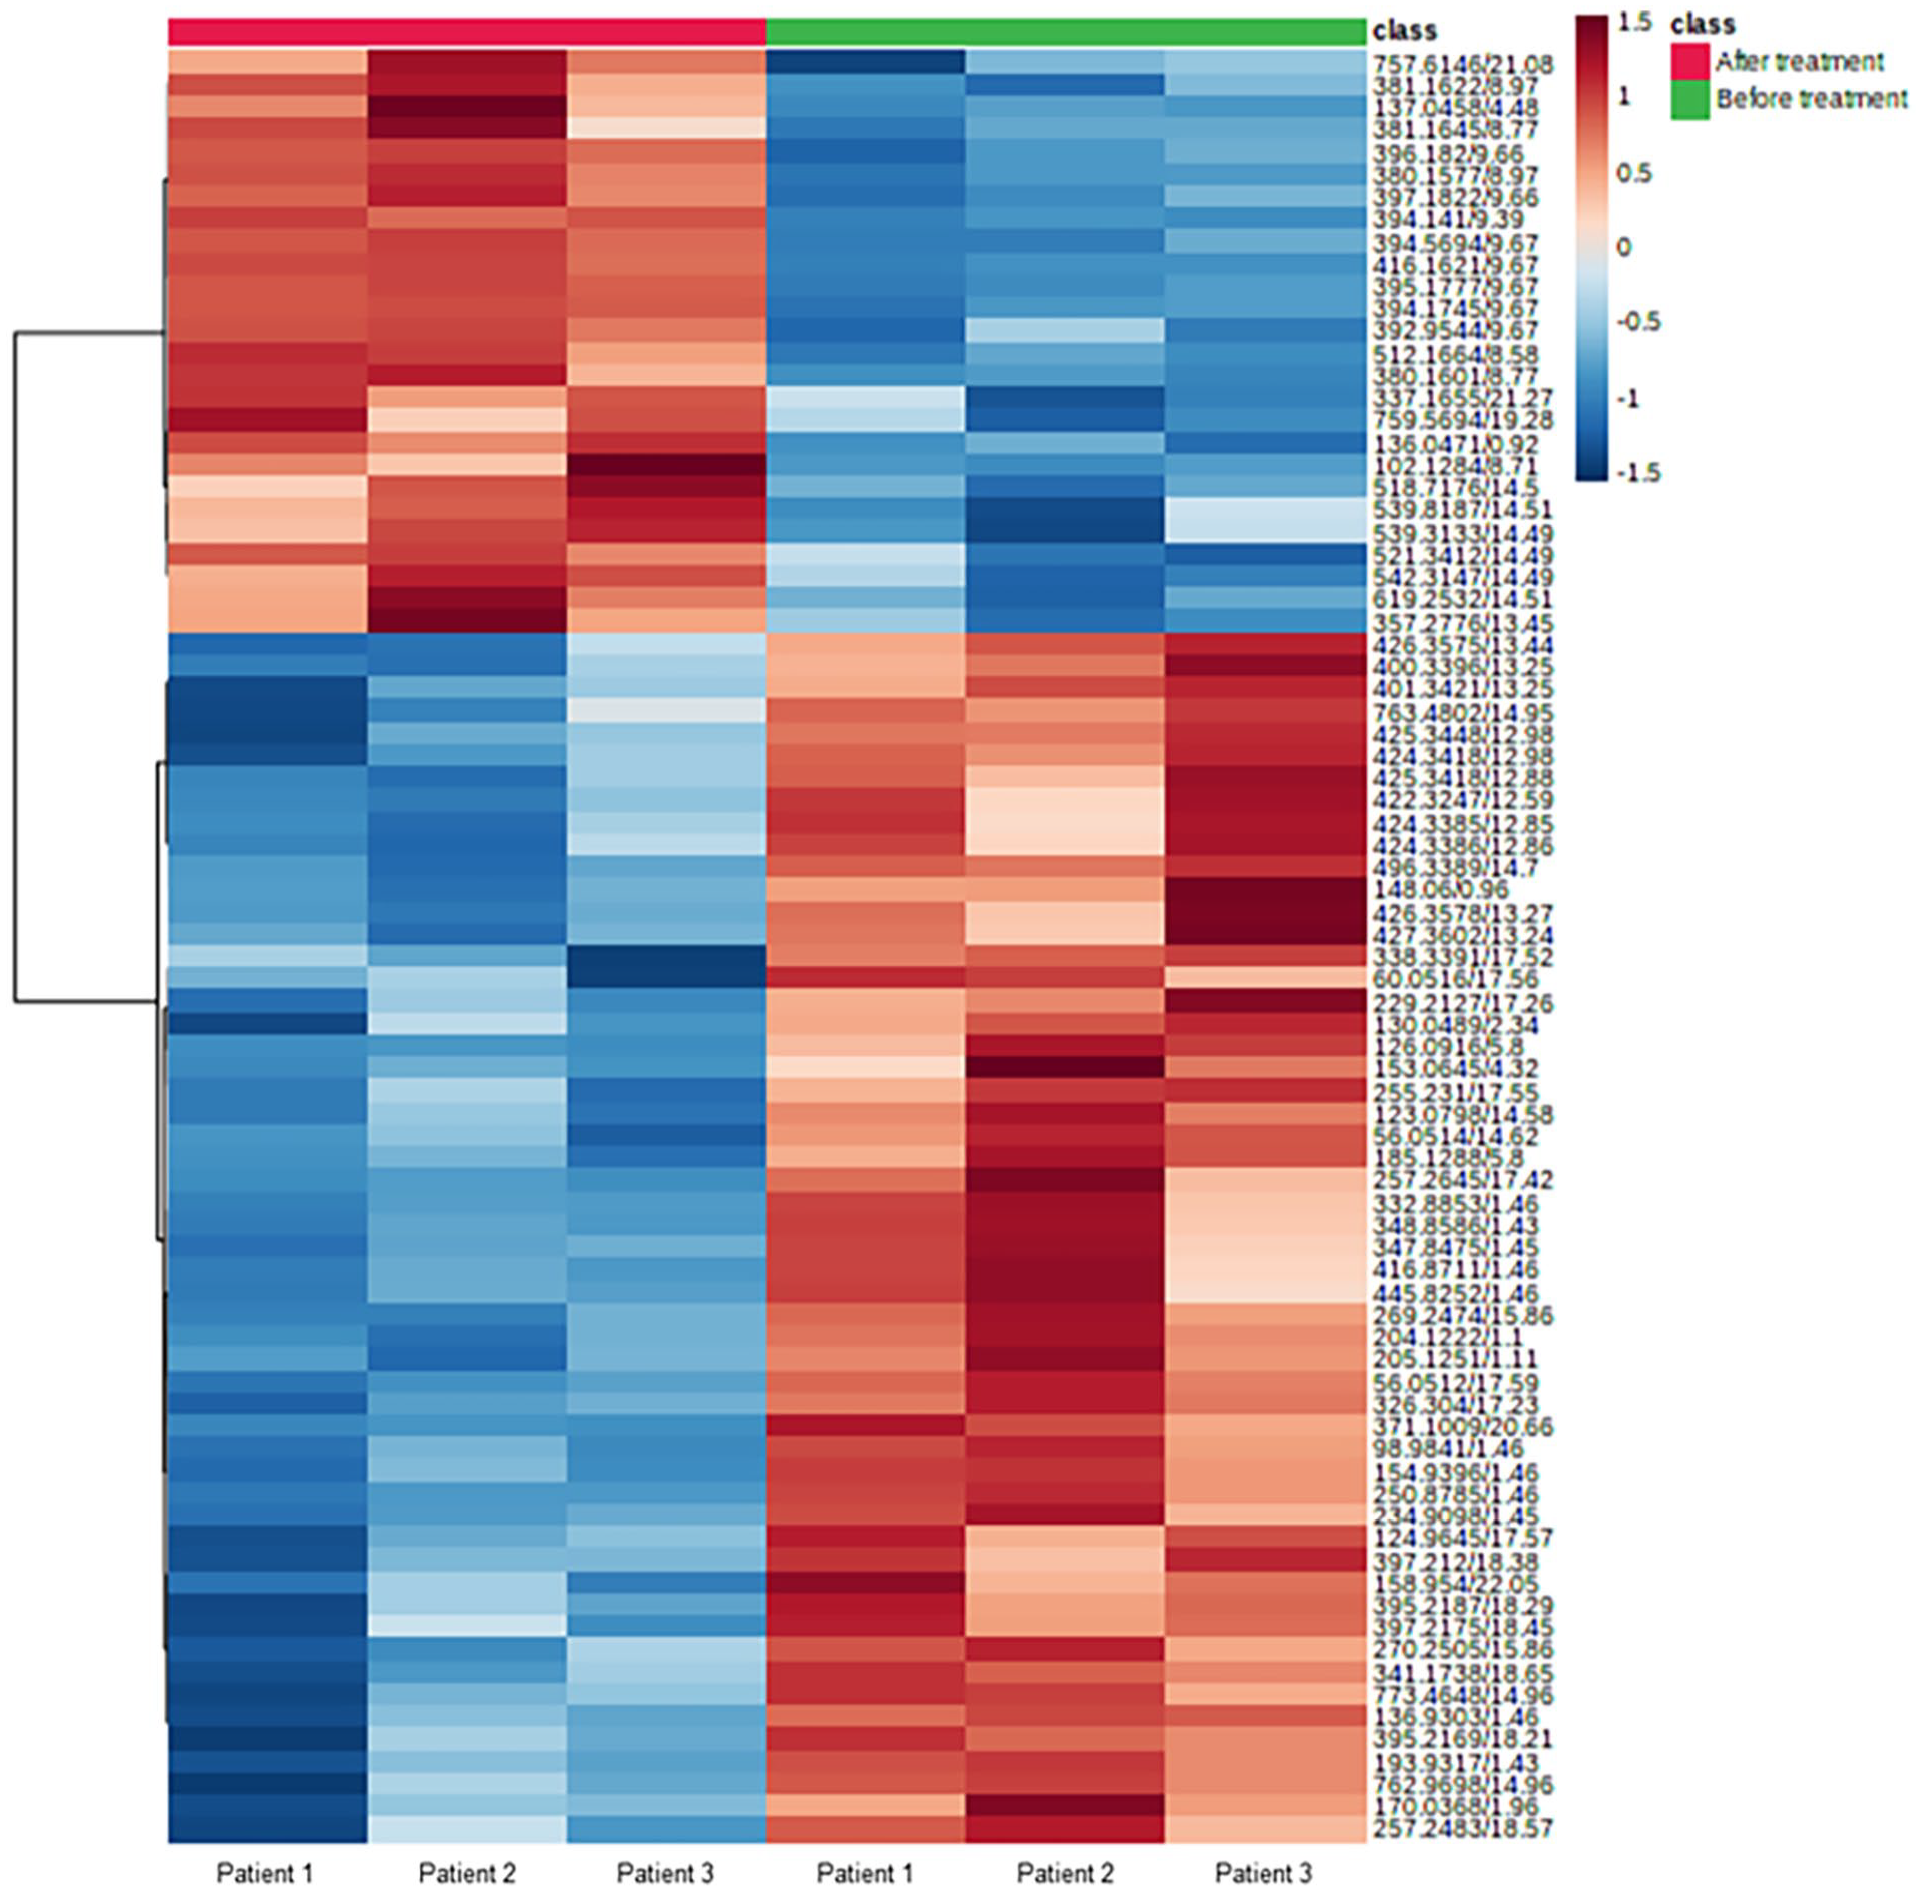
Heatmap analysis highlighting 80 metabolites showing the largest change in plasma between before and after administration of erlotinib in non-small cell lung cancer patients with skin rash. Each group is shown in green (Before treatment, n = 3) and red (After treatment, n = 3). Data in this figure was sum normalized and log transformed. Euclidean was used for distance measure and Ward was used for clustering in this heatmap.
List of 10 Substances With Increased Levels in the Plasma of Patients With Skin Rash After Administration of Erlotinib.

Only compounds with δ values under 50 were presented in the list.
Abbreviation: RT, retention time (min).

Increase in plasma metabolite levels after administration of erlotinib in non-small cell lung cancer patients with skin rash. (A) 380.1577 m/z and 8.97 minutes retention time. (B) 410.1702 m/z and 8.56 minutes retention time.
The Plasma Metabolite Levels That Decreased in NSCLC Patients After Erlotinib Treatment
Erlotinib treatment reduced the levels of 699 plasma metabolites in total. Table 3 shows the 20 substances with the greatest decrease in plasma levels after erlotinib treatment. The compound with the greatest decrease in levels had a m/z of 250.8785 and a retention time of 1.46 minutes, and it was identified as either 2,6-dibromophenol or 2,4-dibromophenol. Before erlotinib treatment, the peak area of a compound with a m/z of 153.0645 and a retention time of 4.32 minutes was 4.31 0.39; however, it decreased to 3.40 0.07 after erlotinib treatment (Figure 3A). Before erlotinib treatment, the peak area of a compound with a m/z of 185.1288 and a retention time of 5.80 minutes was 4.52 0.17; however, it decreased to 3.78 0.11 after erlotinib treatment (Figure 3B). Before erlotinib treatment, the peak area of a compound with a m/z of 401.3421 and a retention time of 13.25 minutes was 4.48 0.15, but it decreased to 3.76 0.19 after treatment (Figure 3C).
List of 10 Substances With Decreased Levels in the Plasma of Patients With Skin Rash After Erlotinib Treatment.

Only compounds with δ values under 50 were presented in the list.
Abbreviation: RT, retention time (min).

Decrease in plasma metabolite levels after administration of erlotinib in non-small cell lung cancer patients with skin rash. (A) m/z 153.0645, 4.32 minutes retention time. (B) m/z 185.1288, 5.80 minutes retention time. (C) m/z 401.3421, 13.25 minutes retention time.
Differences in Metabolite Profiles Before and After Erlotinib Treatment in NSCLC Patients
MetaboAnalyst was used to conduct enrichment analysis on the metabolic pathways using putative metabolites obtained from the plasma of NSCLC patients. The analysis of plasma metabolites with elevated levels after erlotinib treatment revealed that phenylacetate metabolism, lipid metabolism (linoleic acid and steroid), and amino acid metabolism (aspartate, arginine, and proline) were all altered (Figure 4A). The analysis using plasma metabolites with decreased levels after erlotinib treatment revealed that vitamin metabolism (thiamine, vitamin B6, riboflavin, and carnitine), lipid metabolism (triacylglycerol, -oxidation of very long chain fatty acids), carbohydrate metabolism (trehalose, glycolysis, and lactose), and energy metabolism (mitochondrial electron transport and transfer of acetyl groups into mitochondria) were altered (Figure 4B).
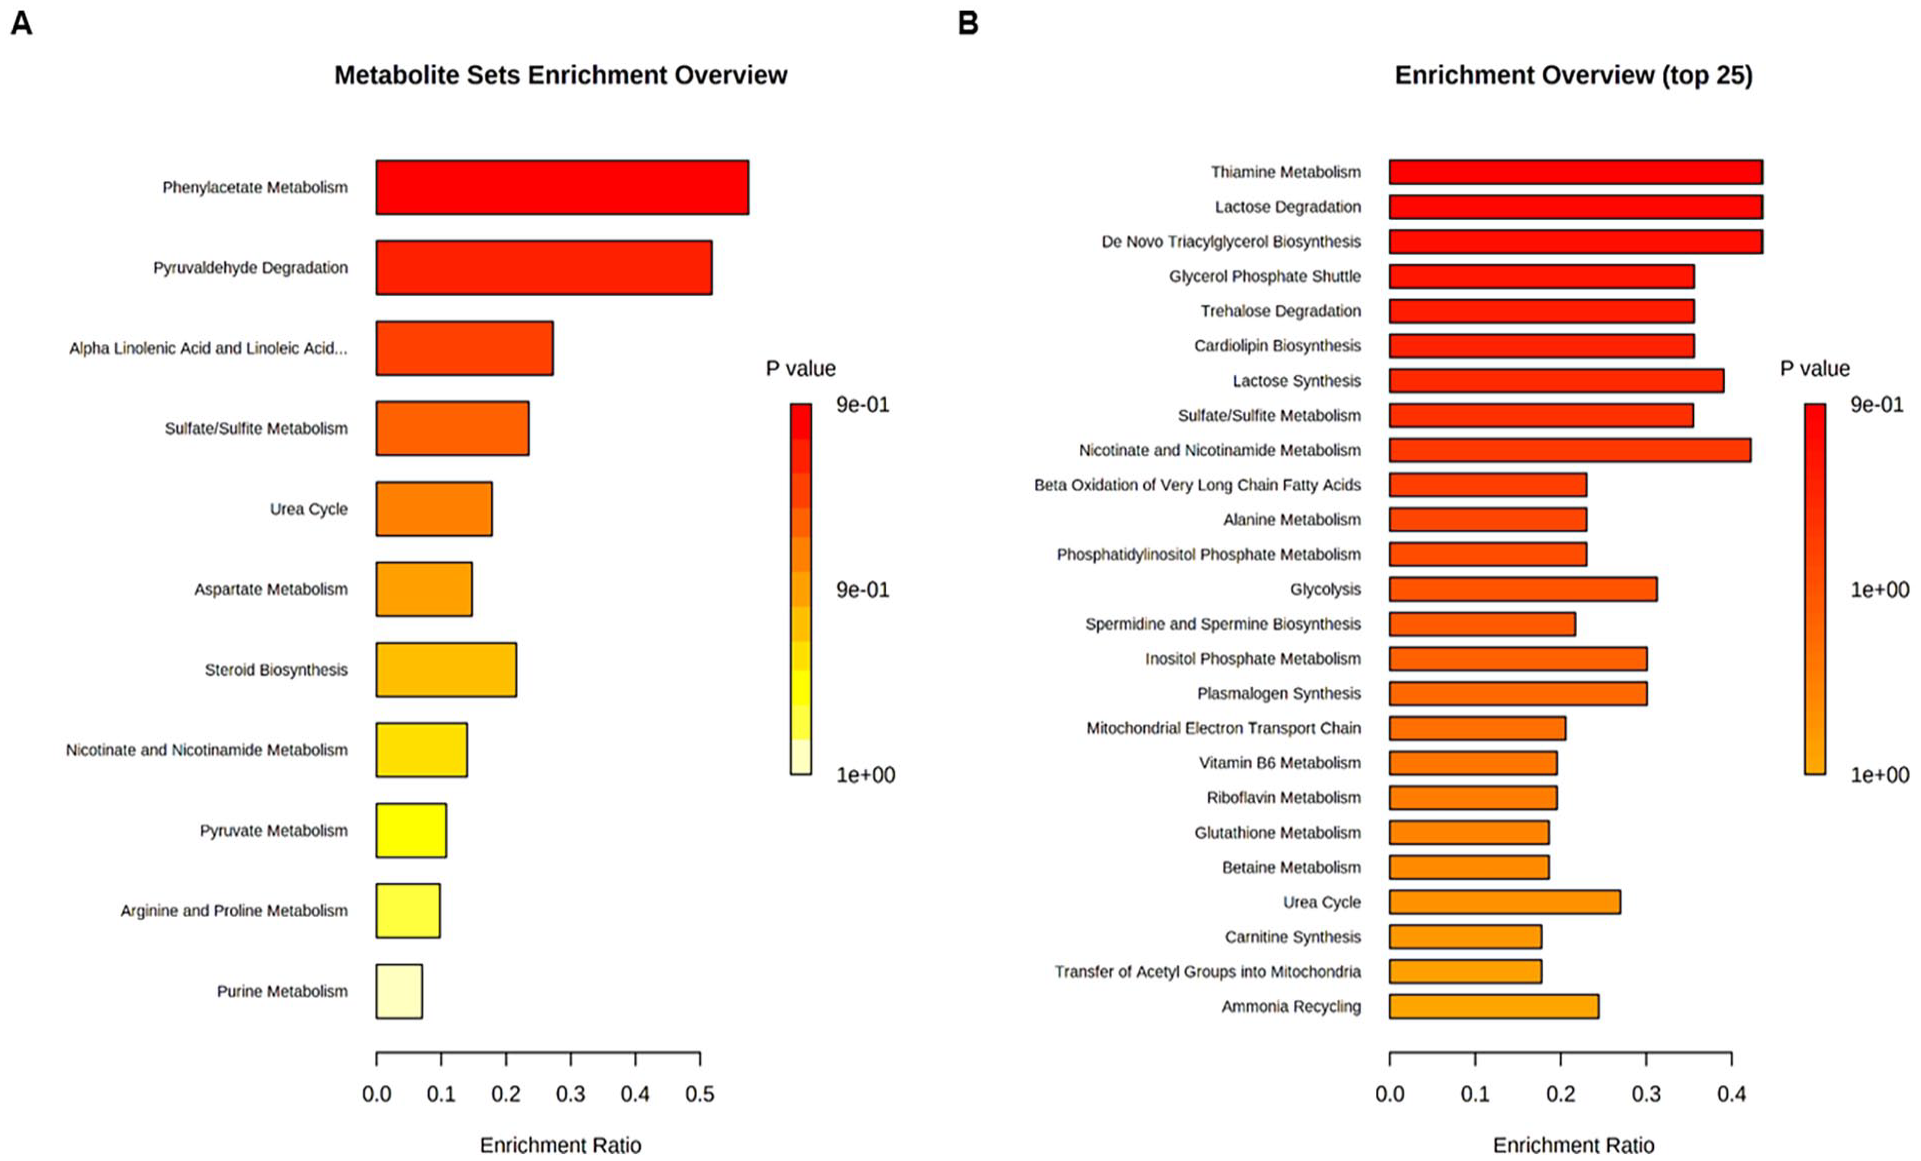
Metabolite enrichment analysis comparing metabolite expression levels before and after erlotinib treatment. There is significant variation in metabolites before and after erlotinib treatment (P-value < .05) in plasma of non-small cell lung cancer (NSCLC) patients. (A) Metabolic pathways with increased metabolite levels in the plasma after erlotinib treatment in NSCLC patients. (B) Metabolic pathways with decreased metabolite levels in the plasma after erlotinib treatment in NSCLC patients.
Plasma Metabolites Showing Higher Levels in Patients With Skin Rash Than in Patients Without Skin Rash
Patients with NSCLC were divided into 2 groups based on the presence or absence of a skin rash following erlotinib treatment. Three patients developed a skin rash after receiving erlotinib, while only 1 patient did not develop a skin rash. We compared the levels of plasma metabolites in the 2 groups to identify the substance(s) associated with erlotinib-induced skin rash. A total of 2442 substances were found in significantly higher concentrations in the plasma of patients with skin rash than in the plasma of patients without skin rash. We performed heatmap analysis with 80 metabolites showing the largest change and showed in Figure 5. We enlisted 10 substances that showed the largest peak area differences between the patients with skin rash and the patient without skin rash after erlotinib treatment (Table 4). The peak area of the metabolite with an m/z of 585.2676 and a retention time of 19.12 minutes in the plasma of patients with skin rash was 4.20 ± 0.62, while that in the plasma of the patient without skin rash was 2.34 (Figure 6A). The peak area of the metabolite with an m/z of 583.2584 and a retention time of 21.17 minutes in the plasma of patients with skin rash was 3.53 ± 0.15, while that in the plasma of the patient without skin rash was 2.84 (Figure 6B). In the plasma of patients with skin rash, the peak area of the metabolite with a m/z of 542.3187 and a retention time of 13.48 minutes was 3.91 ± 0.01, while it was 3.23 in the plasma of patients without skin rash (Figure 6C).
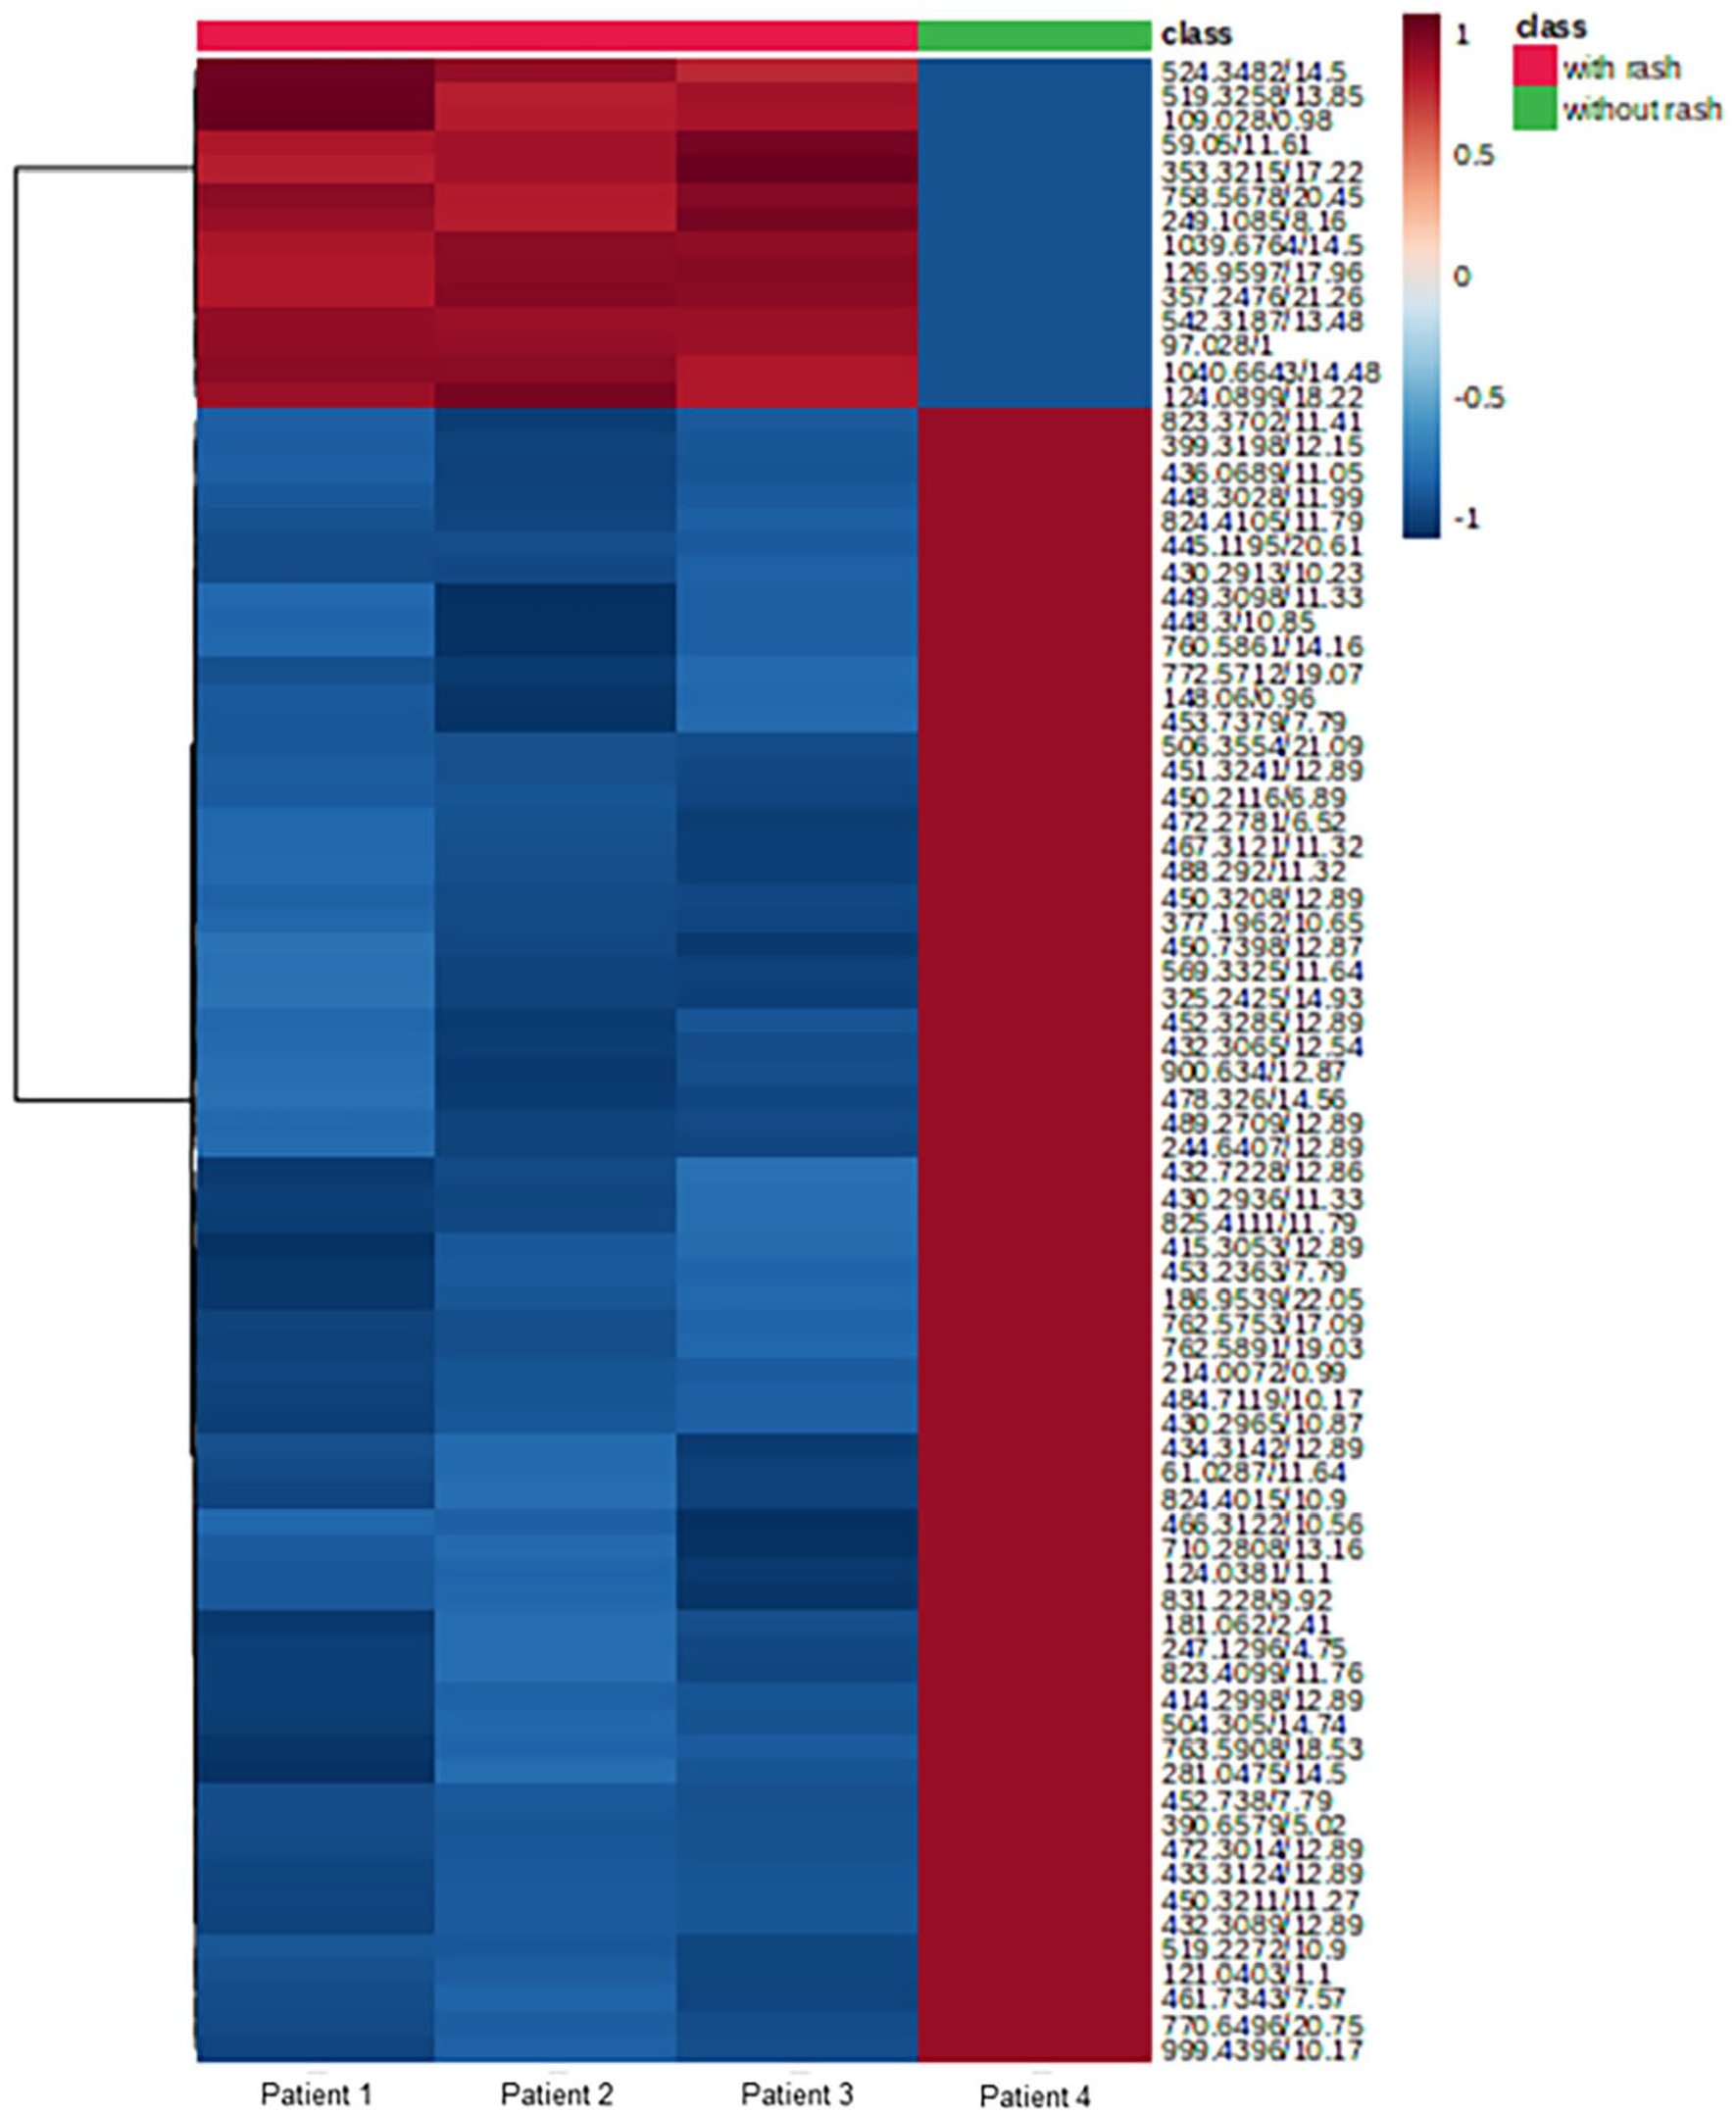
Heatmap analysis highlighting 80 metabolites showing the largest change in plasma of patients with skin rash induced by erlotinib than in the plasma of the patients without skin rash. Each group is shown in green (without rash, n = 1) and red (with rash, n = 3). Data in this figure was sum normalized and log transformed. Euclidean was used for distance measure and Ward was used for clustering in this heatmap.
List of 10 Substances With Increased Levels in the Plasma of Patients With Skin Rash After Erlotinib Compared With Those in the Plasma of Patients Without Skin Rash, With the Largest Peak Area Differences.

Only compounds with δ values under 50 were presented in the list.
Abbreviation: RT, retention time (min).
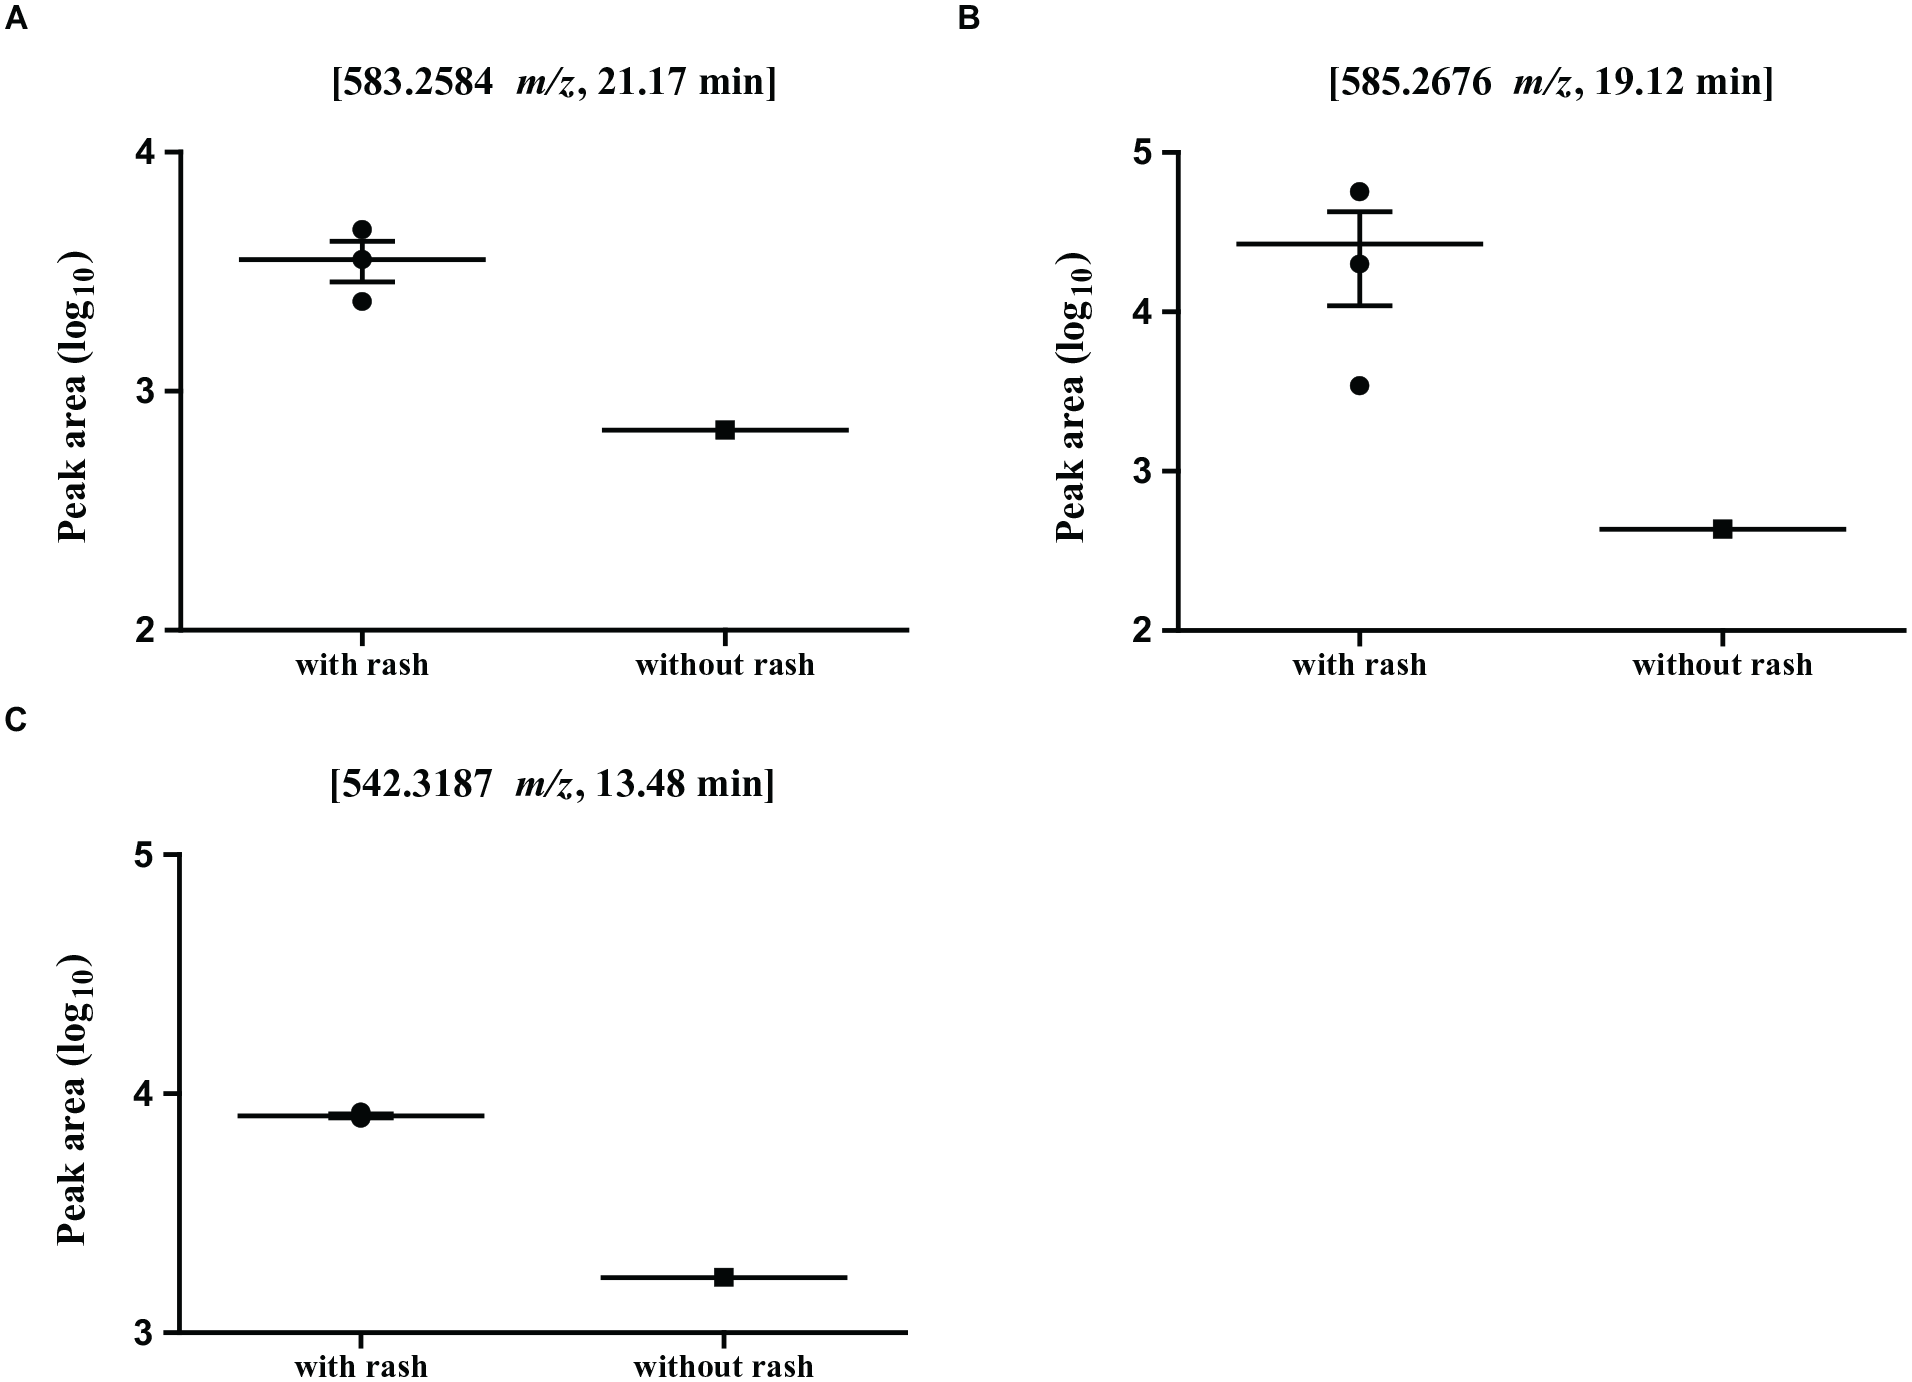
Metabolites presenting higher levels in the plasma of patients with skin rash induced by erlotinib than in the plasma of the patients without skin rash. (A) m/z 585.2676, 19.12 minutes retention time. (B) m/z 583.2584, 21.17 minutes retention time. (C) m/z 542.3187, 13.48 minutes retention time.
Plasma Metabolites Showing Lower Levels in Patients With Skin Rash Than in the Patient Without Skin Rash
A total of 3097 substances were found in significantly lower concentrations in the plasma of patients with skin rash than in the plasma of patients without skin rash. We selected 10 substances that demonstrated the greatest peak area differences between patients with skin rash and patients without skin rash following erlotinib treatment (Table 5). In patients with skin rash, the peak area of the plasma metabolite with a m/z of 284.0571 and a retention time of 8.89 minutes was 3.19 ± 0.12, while it was 4.86 in patients without skin rash (Figure 7A). In patients with skin rash, the peak area of the plasma metabolite with a m/z of 831.2280 and a retention time of 9.92 minutes was 2.29 ± 0.09, while in patients without skin rash, it was 3.82. (Figure 7B). The peak area of the plasma metabolite with a m/z of 414.2946 and a retention time of 11.26 minutes in patients with skin rash was 3.09 ± 0.21, while it was 4.44 in patients without skin rash’s plasma (Figure 7C). The peak area of the plasma metabolite with a m/z of 569.3325 and a retention time of 11.64 minutes was 2.61 ± 0.08 in patients with skin rash and 3.73 in patients without skin rash (Figure 7D).
List of 10 Substances With Decreased Levels in the Plasma of Patients With Skin Rash After Erlotinib Compared With Those in the Plasma of Patients Without Skin Rash, With the Largest Peak Area Differences.

Only compounds with δ values under 50 were presented in the list.
Abbreviation: RT, retention time (min).

Metabolites presenting lower levels in plasma from patients with skin rash induced by erlotinib than in plasma from patients without skin rash. (A) m/z 284.0571, 8.89 minutes retention time. (B) m/z 831.2280, 9.92 minutes retention time. (C) m/z 414.2946, 11.26 minutes retention time. (D) m/z 569.3325, 11.64 minutes retention time.
The Differences in Metabolic Profiles Between NSCLC Patients Treated With Erlotinib Based on the Presence or Absence of Skin Rash
MetaboAnalyst was used to conduct enrichment analysis on the metabolic pathways using putative metabolites obtained from the plasma of NSCLC patients. After erlotinib treatment, the metabolites ketone body, porphyrin, betaine, and lysine metabolism were significantly different in the analysis using the metabolites with increased levels between patients with skin rash and patients without skin rash (Figure 8A). Carbohydrate (lactose, trehalose, galactose, fructose, mannose, glycolysis, gluconeogenesis, starch, sucrose, and glucose-alanine cycle), amino acid (homocysteine and cysteine), and vitamin (vitamin K, pantothenate, and CoA) metabolism were significantly different after erlotinib treatment in the analysis using metabolites with reduced levels between the patients with skin rash (Figure 8B).
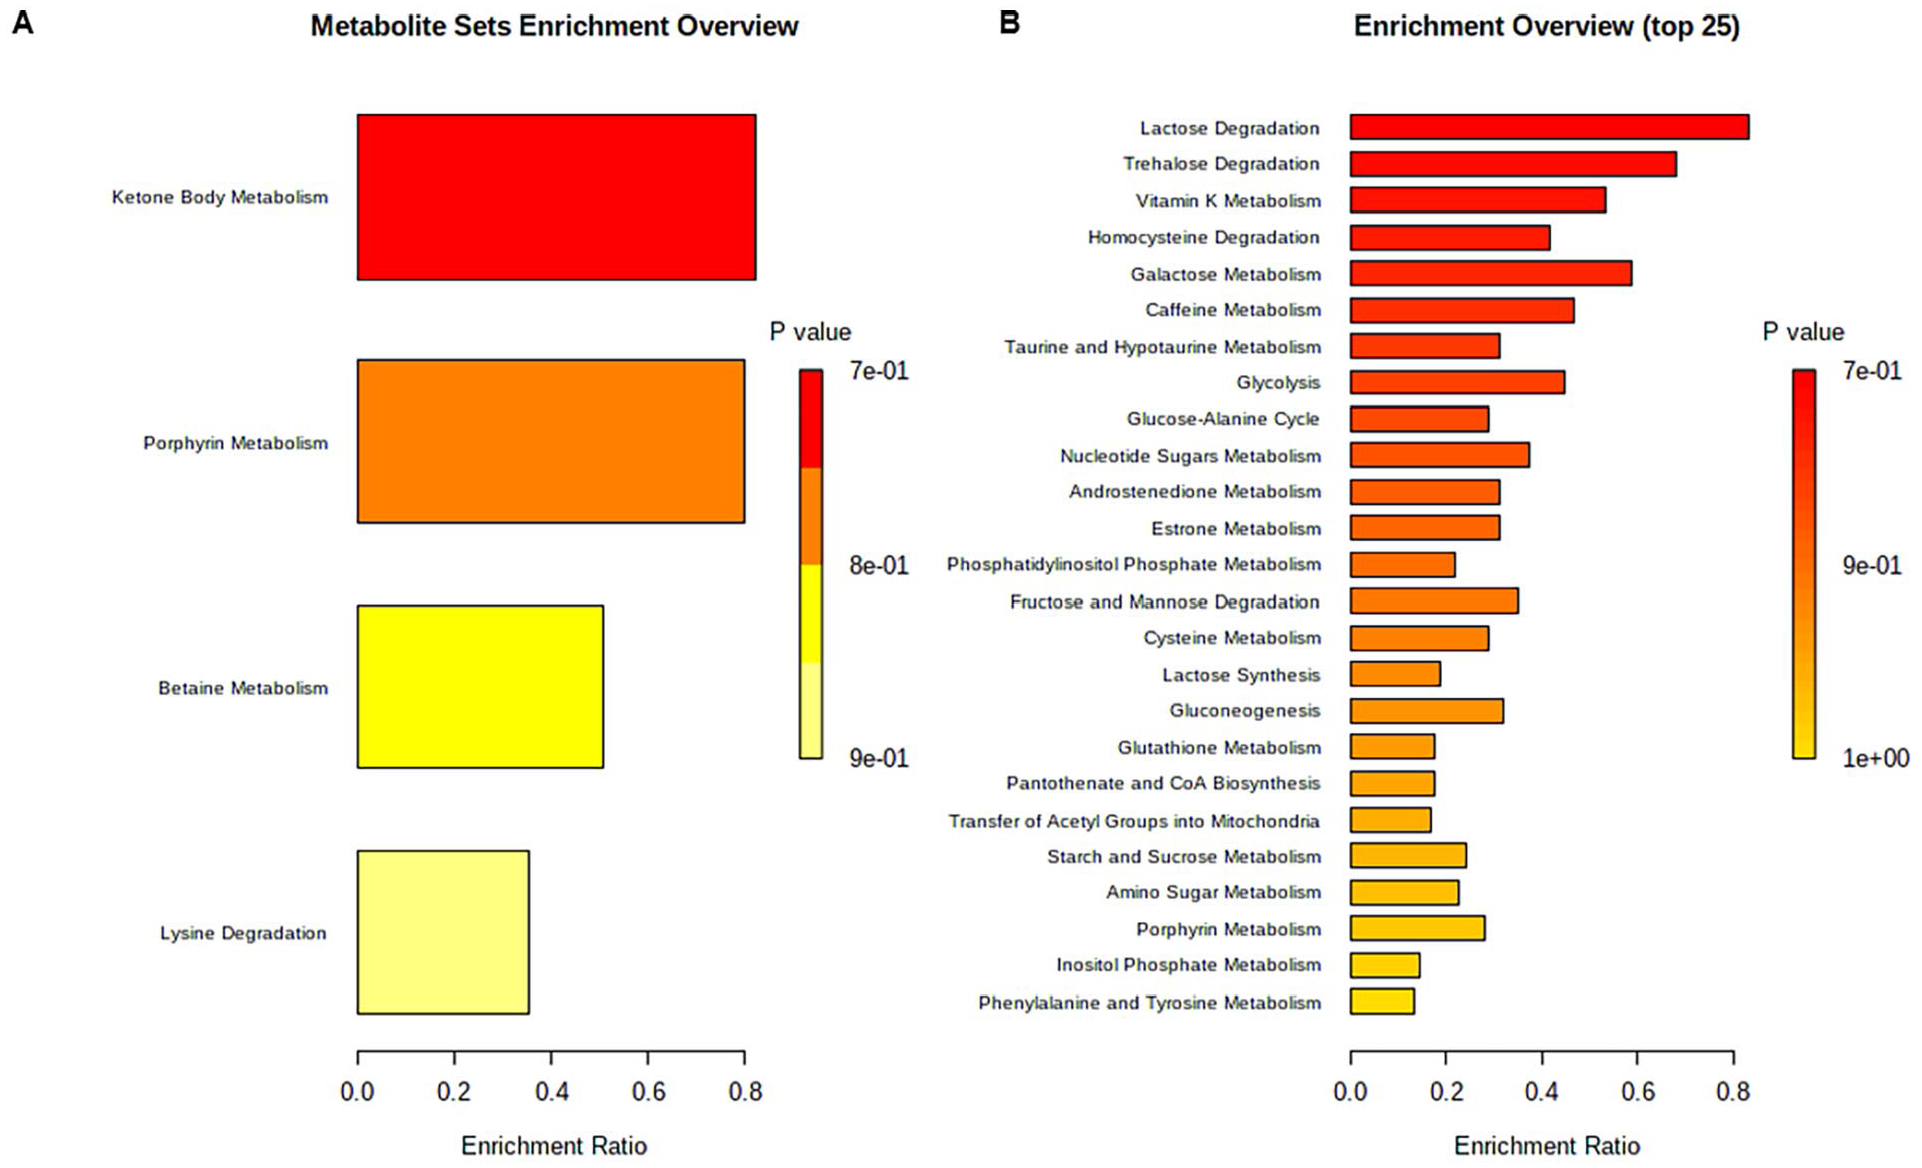
Metabolite enrichment analysis comparing samples of patients with or without skin rash. There is significant variation of metabolites between the samples of NSCLC patients with the presence or absence of skin rash after erlotinib treatment (P < .05). (A) Metabolic pathways with increased metabolites in the plasma of patients presenting with skin rash after erlotinib treatment compared with those in the plasma of the patient without skin rash. (B) Metabolic pathways with decreased metabolites in the plasma of patients with skin rash after erlotinib treatment compared with those in the plasms of the patient without skin rash.
Discussion
Metabolomics has been used to discover cancer biomarkers as well as an analytical tool to study cancer pathophysiology. 8 Researchers have attempted to apply their knowledge of metabolites involved in lung cancer to the diagnosis, treatment, and prevention of tumors. 9 The changes in metabolites of NSCLC patients have also been studied, and some metabolic pathways have been proposed as the targets. 10 NSCLC alters metabolic pathways such as glucose, amino acid, protein, and fatty acid metabolism.8,11 -13
This study aimed to examine the metabolic changes of NSCLC patients after administrating erlotinib. After erlotinib administration, the levels of 1005 substances changed in total. Among them, the levels of 306 substances increased, while the levels of 699 substances decreased. The compound and 394.1745 m/z with 9.67 minutes retention time showed the highest levels among the increased substances. Given that the chemical was identified as erlotinib during analysis, it’s not surprising that it was most prevalent in patients following chemotherapy. The next most elevated compound had a m/z of 395.1777 and a retention time of 9.67 minutes. Droperidol or s-(Arabinosylamino)-3-(glucosylamino) propanenitrile appeared to be the compound with a m/z of 380.1577 and a retention time of 8.97 minutes, whose levels were also increased by the erlotinib treatment. Queuosine was identified as another compound with a m/z of 410.1702 and retention time of 8.56 minutes, whose levels increased after erlotinib. In contrary, erlotinib reduced N1-methyl-pyridone-5-carboxaminde, N-(3-acetamidopropyl) pyrrolidin-2-one, and 7-ketocholesterol, which had m/z of 153.0645 and a retention time of 4.32 minutes, 185.1288 and a retention time of 5.80 minutes, and 401.3421 and a retention time of 13.25 minutes, respectively.
According to our findings, erlotinib treatment primarily altered glucose, fatty acid, and energy metabolism. Cancer is characterized by changes in energy metabolism. The Warburg effect is characterized by abnormal glucose consumption in cancer cells, as well as increased glycolysis and lactate excretion. 14 Previous metabolomics studies have revealed that altered glycolysis was observed in the serum of NSCLC patients compared to healthy controls.12,13 Energy metabolism changes are accompanied by dysregulation of lipid and amino acid metabolism. 15
Erlotinib treatment altered carbohydrate and lipid metabolism pathways in NSCLC patients (Figure 4). The change in energy metabolism after erlotinib treatment may reflect the pharmaceutical effect and efficacy of anti-cancer treatment. We also discovered that erlotinib altered the metabolic pathways for taurine and carnitine. According to a system biology study using epigenetics, lung adenocarcinoma alters the DNA methylation of genes involved in taurine metabolic pathways. 16 Surprisingly, alterations in taurine metabolism were found in the plasma of NSCLC patients who responded to chemotherapy with pemetrexed in combination with either cisplatin or carboplatin. 16 We also discovered that erlotinib treatment affected the betaine metabolic pathway in patients, which was elevated in the blood of lung cancer patients. 6 Although the pathogenic role of metabolic pathways in carcinogenesis is unknown, these parameters can be used as metabolic biomarkers of oncogenesis and indicators of chemotherapy response.
The most common side effect of erlotinib is skin rash; however, the pathogenesis of this side effect is not fully elucidated. Although the adverse effects of erlotinib have been proposed as an indicator of chemotherapy responsiveness, patients report quality-of-life impairment and discomfort as a result of the skin side effects. 17 In the blood of patients with skin rash, the concentration of carboxamide and carnitine derivatives decreased after erlotinib administration. Carnitine inhibits the expression of inducible nitric oxide (iNOS) in Raw274.7 cells, which are macrophages, and carboxamide has anti-inflammatory properties that modulate the expression of interferon alpha.18,19 Overproduction of nitric oxide and cytokines and chemokines due to macrophage hyperactivity has been proposed as a hypothesis for the development of the skin rash side effect of erlotinib. 20
Therefore, the reduction of metabolites with anti-inflammatory properties by erlotinib suggests a possible mechanism of the side effect. In this study, we also compared the metabolite profiles of patients with and without skin rash. As a result, 5539 substances were found to be differentially expressed depending on the onset of skin rash after erlotinib treatment. After erlotinib administration, the levels of 2442 substances decreased and those of 3097 substances increased in the plasma of NSCLC patients without cutaneous side effects, compared to those in patients with skin rash. Among the substances, those with a m/z of 585.2676 and a retention time of 19.12 minutes, as well as those with a m/z of 583.2584 and a retention time of 21.17 minutes, had lower plasma levels in patients with skin rash. Based on the HMDB analysis, these were identified as bilirubin and biliverdin (Table 5). Because bile salts suppress inflammatory responses by inhibiting leukocyte migration, decreased plasma bilirubin levels may cause skin problems in erlotinib patients. 21 Metabolites with m/z of 284.0571 and a retention time of 8.89 minutes, 831.2280 and a retention time of 9.92 minutes, 414.2946 and a retention time of 11.26 minutes, and 569.3325 and a retention time of 11.64 minutes had lower levels in the plasma of patients with skin rash (Figure 7). 8-Hydroxy-deoxyguanosine was identified as the compound with a m/z of 284.0571 and a retention time of 8.89 minutes (8-OHdG). 8-OHdG reduces cytokine production and thus modulates inflammation. 16 These results suggest that the different metabolite expressions between the patients according to the incidence of cutaneous side effects might change inflammatory reactions leading to skin rash in response to erlotinib treatment.
Enrichment analysis revealed that the metabolic pathways (lactose, glycolysis, fructose, and mannose) had different profiles depending on the occurrence of skin rash. These metabolic pathways are primarily concerned with energy metabolism. Several studies have found that energy metabolism changes in inflammation-mediated cutaneous disorders like atopic dermatitis and psoriasis. It has been discovered that the metabolic profiles of amino acids, acylcarnitine, and phosphatidylcholine in the skin of atopic dermatitis patients differ from those in healthy controls. 22 Homocysteine and arginine levels in psoriasis patients’ plasma are elevated. 23 Another study found that the taurine metabolic pathway was altered in the serum of psoriasis patients. 14 Although abnormal immune hyperactivity triggered by the damage of skin cells has been suggested as a pathogenetic mechanism of erlotinib-induced skin side effects, it is different from the pathogenesis of the autoimmune diseases, atopic dermatitis, and psoriasis. Therefore, this study proposes that the necessity to investigate whether substances in these metabolic pathways are involved in the autoimmune skin disorders and/or EGFRI-induced skin rashes, and their role in the pathogenesis.
We also discovered that there were differences in the metabolic pathways of amino acids, phosphatidylcholine, homocysteine, arginine, and taurine between the patients based on the presence or absence of skin rash. We also discovered that vitamin metabolism may be affected. Surprisingly, enrichment analysis revealed the vitamin K metabolic pathway.
Erlotinib induced skin rash has characteristics such as acneiform rash, xeroderma, and paronychia and different degree of symptoms can be observed. 24 Currently, the usage of steroids is routinely advised to treat the skin disease. However, a lack of understanding about steroid use might exacerbate the condition and lead to side effects. 24 There are increasing reports of the positive effects of Korean or Chinese medicines in controlling the side effects of EGFR-TKIs such as erlotinib or improving their efficacy. 25 According to the systematic review specifically done on EGFR-tyrosine kinase inhibitors (TKIs), herbs such as Renshen, Huangqi, and Yiyiren, as well as their extracts such as ginsenosides, ginseng polysaccharide, ginseng alcohols, panaxytriol, astragaloside, astragalus polysaccharides, and Coix seed oil, proved that they can not only improve immune system function, but may also have a direct EGFR-TKIs inhibitory effect. 26 A recent randomized controlled trial (RCT) study focused on the skin rash found that honeysuckle can reduce the cutaneous side effect caused by EGFR-TKIs. 27 Another clinical study where patient took herbal medicine with EGFR-TKIs reported synergistic effects showing anti-cancer effect with less side effect in NSCLC patients. 28 These reports suggest that herbal medicines which can increase patient’s immunity as well as clear body heat may have beneficial pharmacological by enhancing anticancer activity and suppressing side effects during EGFR-TKIs treatment. However, further studies are needed to elucidate the pharmacologic mechanisms of enhanced efficacy, validate clinical efficacy, and determine safety when combining traditional Korean medicine treatments with EGFR-TKIs.
The main limitation of this study is that we performed the study in 1 patient who did not develop a skin rash. Erlotinib has a high incidence of skin rash as a side effect, so it was not possible to obtain patients without skin rash to calculate statistical significance in this study. The next limitation is that this study predicted metabolites in the blood but did not identify them. To minimize this limitation, the chemical shift scale (δ) was measured to propose the most potentially relevant substances. Final limitation is that we did not control for patient diet or pharmaceutical intake, which may have resulted in changes in the metabolome unrelated to the skin rash or erlotinib administration. The subjects in this study were outpatients and did not make any adjustments other than taking erlotinib. Therefore, it is possible that there may be coincidental differences in the concentration of compounds derived from the occurrence of skin rashes or the ingestion of drugs or foods unrelated to the administration of erlotinib. Patients who developed skin rash had higher blood levels of licorice saponin E2 and K2, and glycyrrhizin than patients who did not develop skin rash. These substances are the components of licorice and widely used in traditional Korean and Chinese medicine. 29 Although these compounds were found to be higher in patients who developed skin rashes, it is unclear if these compounds caused the side effects. Alternatively, it is possible that the patients were taking the herbs to treat skin-related side effects or lung cancer. In patients without the skin rash caused by erlotinib, blood levels of acridones, a class of organic compounds known as citbismine A and acrimarine J, were higher than in patients with skin rash. These are compounds found in citrus, which the patient had likely ingested. 30 Interestingly, the concentration of ginsenoside F5 in the plasma of this patient was higher than those with skin rash, which is a compound found in Panax ginseng. 31 Therefore, it is possible that the use of ginseng may have had a beneficial effect on the erlotinib-induced skin rash. These uncontrolled drug and food intakes may have interfered with the investigation of the plasma metabolome. Nonetheless, this study may provide a molecular basis for the development of erlotinib-induced skin rash.
Conclusions
Although inflammatory responses have been proposed as the primary pathologic mechanisms of skin rash after erlotinib, the detailed pathogenesis and systemic mechanisms of the adverse responses have yet to be clarified. This research could pave the way for further research into the molecular pathology of drug side effects and the development of treatments for them. Other EGFR-targeted chemotherapies, such as afatinib and osimertinib, have been shown to have similar toxic effects on the skin, though the pathogenesis is unknown. This untargeted metabolomics research contributes to a molecular understanding and management of the side effects of anti-EGF therapies.
Supplemental Material
sj-docx-1-ict-10.1177_15347354231198090 – Supplemental material for Comparison of Plasma Metabolites From Patients With Non-Small Cell Lung Cancer by Erlotinib Treatment and Skin Rash
Supplemental material, sj-docx-1-ict-10.1177_15347354231198090 for Comparison of Plasma Metabolites From Patients With Non-Small Cell Lung Cancer by Erlotinib Treatment and Skin Rash by Won Kil Lee, Jisoo Myong, Eunbin Kwag, Younmin Shin, Ji Woong Son, Byong Chul Yoo, Byoung-Soo Kim, Hwa-Seung Yoo and Jeong June Choi in Integrative Cancer Therapies
Footnotes
Declaration of Conflicting Interests
The author(s) declared no potential conflicts of interest with respect to the research, authorship, and/or publication of this article.
Funding
The author(s) disclosed receipt of the following financial support for the research, authorship, and/or publication of this article: This work was supported by a National Research Foundation of Korea (NRF) grant funded by the Korean government (MSIT) [grant number 2018R1D1A1B07050474] and the Ministry of Health & Welfare, Republic of Korea [grant number HI19C1046].
Data Availability
The data used to support the findings of this study are included within the article.
Supplemental Material
Supplemental material for this article is available online.
References
Supplementary Material
Please find the following supplemental material available below.
For Open Access articles published under a Creative Commons License, all supplemental material carries the same license as the article it is associated with.
For non-Open Access articles published, all supplemental material carries a non-exclusive license, and permission requests for re-use of supplemental material or any part of supplemental material shall be sent directly to the copyright owner as specified in the copyright notice associated with the article.