
Abstract
Purpose:
This study aimed to explore the role and molecular mechanism of brain and muscle ARNT-like protein 1 (BMAL1) in hepatocellular carcinoma (HCC), and the effect of melatonin on BMAL1 expression and apoptosis of HCC cells.
Methods:
We mainly used immunohistochemistry, western blot, cck-8 assays, flow cytometry, wound-healing assay, transwell assay, and RT-qPCR for this research.
Results:
The expression of BMAL1 protein was frequently up-regulated in the tissues and cell lines of HCC patients. Its high expression was significantly associated with tumor size, tumor differentiation degree, and shorter survival. In addition, cell functional experiments showed that BMAL1 could promote proliferation and migration, and inhibit apoptosis in HCC cell lines. Furthermore, the expression of BMAL1 was related to the endoplasmic reticulum stress (ERS) level. Knockdown of BMAL1 could inhibit the expression of ERS-related protein, while overexpression of BMAL1 led to the increase of ERS-related protein’s level. Low concentration of ERS led to the increase of BMAL1, and a certain degree of ERS in turn inhibited the expression of BMAL1. Melatonin promoted apoptosis of hepatoma cells by inhibiting the expression of BMAL1.
Conclusion:
BMAL1 plays a key role in HCC patients’ survival and tumor growth, which may be related to its interaction with ERS-related pathways. Melatonin can regulate ERS-related apoptosis resistance by inhibiting BMAL1 expression, promoting apoptosis of HCC cells.
Introduction
Liver cancer continues to be one of the most common malignant tumors worldwide. It ranks as the sixth leading cause of cancer-related incidence and third leading cause of cancer-related mortality respectively. An estimated 75% to 85% of all liver cancer patients are diagnosed with hepatocellular carcinoma (HCC), which is a prominent histological type of liver cancer. 1 However, many HCC patients presented with late-stage tumors at initial diagnosis, and their clinical outcome is generally very poor. Therefore, it is urgent to further understand the molecular mechanism of HCC tumor growth and metastasis.
Circadian rhythms are biological processes with ~24-hour oscillations, which help organisms better adapt to the environment. The latest research indicates that there are many diseases, including cancer, that have a close relationship with circadian rhythm disturbance in their occurrence and development.2-5 Core circadian transcription factors circadian locomotor output cycles kaput (CLOCK) and brain and muscle ARNT-like protein 1 (BMAL1) exist as heterodimers and are regulated by multiple feedback loops; they have been identified to be required for the maintenance of circadian rhythms. Some previous research has indicated that BMAL1 has an increased expression in thyroid cancer, pleural mesothelioma, and prostate cancer.6-8 However, the role of BMAL1 in HCC and its molecular mechanism in HCC progression remain unclear.
Unfolded or misfolded proteins accumulating in the ER lumen is a phenomenon known as endoplasmic reticulum stress (ERS). ERS triggers a series of protective cascade responses called the unfolded protein response (UPR). ERS and circadian clockwork signaling pathways have similar physiological roles in cell regulation, suggesting that the 2 pathways interact with each other. 9 Studies indicated that ERS is associated with circadian rhythm signals.10,11 One study showed that in Burkitt lymphoma, activation of UPR inhibits Bmal1, thereby inhibiting circadian oscillations and continuous protein synthesis, and promoting tumor progression. 12 However, the interaction between BMAL1 and ERS in liver cancer remains unclear.
Melatonin (N-acetyl-5-methoxy-tryptophan) is the main pineal gland-emanated hormone and a key regulator of circadian rhythm which has a wide range of physiological functions. Many studies have shown that as an effective cancer suppressor, melatonin has anti-cancer activities through anti-proliferation and pro-apoptotic effects.13-15 In addition, our previous studies have demonstrated that melatonin has anti-proliferation and pro-apoptosis effects in liver cancer by reversing ERS-induced apoptosis resistance.16-19 However, there is little research on the relationship between melatonin and BMAL1 in liver cancer.
In this study, we explore the biological function of BMAL1 and its relationship with ERS in liver cancer, as well as the effect of melatonin on the expression of BMAL1 and apoptosis of liver cancer cells. Herein, we show that melatonin may regulate ERS-related apoptosis resistance in HCC cells by inhibiting the expression of BMAL1, providing a new idea for the therapeutic schedule of liver cancer.
Materials and Methods
Reagent
Melatonin was purchased from Sigma (M5250, USA). The molecular weight of melatonin was 232.28 and its purity was more than 98%. We weighed 4.65 mg melatonin powder and dissolved it with 100 μL anhydrous ethanol to obtain a solution with a concentration of 200 mmol/L for subsequent experiments. Tunicamycin (TM) was purchased from Solarbio (T8480, China). The molecular weight of TM was 830.9. We weighed 1 mg TM powder, dissolved it with 48.1 μL DMSO to obtain a solution with a concentration of 25 mmol/L for subsequent experiments. Carbonyl cyanide 3-chlorophenylhydrazone (CCCP) was purchased from Solarbio (C6700, China). The initial concentration of the product is 50 mmol/L, which can be diluted directly according to the need. CCK-8 detection reagent (BB-4202) and Annexin V-FITC Apoptosis Detection Kit (BB-4101-2) were purchased from BestBio (China).
Clinical Samples
We collected 133 primary liver cancer tissues and paired adjacent non-tumor liver tissue samples from the First Affiliated Hospital of Anhui Medical University (year 2004-2010). The eligibility criteria for HCC patient recruitment were set as follows: ① histologically-confirmed HCC; ② no history of other malignant tumors; ③ receiving surgical resection; ④ no other treatment, such as radiotherapy and chemotherapy, was performed before radical treatment; ⑤ complete clinical information. Clinicopathological information, including age, sex, history of hepatitis or cirrhosis, tumor size, tumor differentiation, AFP level, and overall survival (OS) were recorded. In addition, we also obtained 7 pairs of fresh primary liver cancer tissues and adjacent non-tumor liver tissue samples in 2021 for Western blot. The study protocol was carried out according to the Declaration of Helsinki and was approved by Anhui Medical University’ Ethics Committee (NO.20040158), with written informed consent of all patients.
Tissue Microarray Immunohistochemistry
Immunohistochemistry was utilized to detect the expression level of BMAL1 (1:500, Abcam), GRP78 (1:100, Arigo Biolaboratories), IRE1ɑ (1:300, Abcam) on paraffin-embedded tissue microchips of liver cancer and adjacent non-tumor liver tissues. Cell staining intensity (0 for negative, 1 for weak intensity, 2 for moderate, and 3 for strong) and positive staining cell number (0 for <10%, 1 for 10%-25%, 2 for 26%-50%, 3 for 51%-75%, and 4 for >75%) are the 2 key indicators of the IHC score. We determined that the final IHC score is the product of these 2 indicators. We defined ≥6 as high expression and <6 as low expression. 20
Cell Culture
Human normal liver cell line (LO2) and human hepatoma cell lines (HepG2, MHCC-97H, Hep3B, SMMC-7721, BEL-7402) were purchased from the Chinese Academy of Sciences. The cells were cultured in DMEM high glucose medium (Gibco) containing 1% streptomycin (Gibco), 1% penicillin (Gibco), and 10% fetal bovine serum (FBS) (Gibco). The cells were cultured in a 37°C humidified incubator with 5% CO2. Fluid was changed and cells were cultured in time according to the cell growth status.
Knock-Down and Forced Expression of Target Genes
The overexpressed BMAL1 vector (BMAL1) and empty vector (EV) pEX-3 were obtained from the Genechem Co., Ltd (Shanghai, C10001). The cells were first planted in 6-well plates, and transfection began when the cell growth and fusion rate reached about 50%. Transfection was performed according to the Lipofectamine™ 2000 (Invitrogen) instructions. At 6 hours after transfection, the serum-free DMEM medium was changed to a complete medium containing 10% FBS and cells were cultured for 48 hours for subsequent experiments. Small interfering RNA (si-RNA) for the BMAL1 (si-BMAL1) were purchased from the GenePharma Co., Ltd (Shanghai, A10001). The sequence information is presented as follows: BMAL1 interference sequence 1: 5′-GUCCAGGAAAUUAGAUAAATT-3′. BMAL1 interference sequence 2: 5′-GGUGAAAUCUAUGGAAUAUTT-3′. BMAL1 interference sequence 3: 5′-GACCAAGGAAGUAGAAUAUTT-3′. Negative control (NC) sequence: 5′-UUCUCCGAACGUGUCACGUTT. We set different groups, among which Con group did not do any treatment, the Mock group only added transfection reagent, the NC group added transfection reagent and NC-siRNA, the experimental group added transfection reagent and different Si -BMAL1.
Cell Viability Analysis
We used CCK8 to measure cell viability. The cells were inoculated into 96-well plates at a dose of 100 μL (a density of 3 × 10⁴ cells/mL) per well, and CCK-8 detection reagent (10 μL/well) was added at 0, 24, 48, 72, and 96 hours after transfection, respectively. Each sample was analyzed in triplicate. After further incubation for 2 hours, the optical density (OD) at 450 nm was detected by a microplate reader. Cell viability = average OD value of the experimental group/average OD value of the control group × 100%.
Wound-Healing Assay
The transfected cells were inoculated into 6-well plate (5 × 10⁵/well). When the cell confluence reached 90%, the cells were scratched with 200 μL of a pipette tip and cultured in complete medium containing 10% FBS. Pictures were taken under the microscope at 0 and 24 hours after culture. Scratch healing rate = (0 hour cratch area−24 hours scratch area)/0 hour scratch area × 100%. Image J software was used for calculation and analysis.
Transwell Assay
Cells were collected and suspended in a medium containing 5% FBS. Then, cell suspension of 100 μL (cell density 5 × 10⁴/mL) was added to the upper chamber, and medium containing 20% FBS 600 μL was added to the lower chamber and cultured in an incubator containing 5% CO2 for 24 hours. The cells were stained with 0.1% crystal violet for 15 minutes, and then washed with distilled water 3 times. Cells were observed under a microscope and different areas were randomly selected for counting.
Flow Cytometry
Cell apoptosis was determined with an Annexin V-FITC Apoptosis Detection Kit (BestBio, BB-4101-2) following the manufacturers’ instructions. Briefly, HCC cells were planted in 6-well plates, washed with pre-cooled PBS for 2 times, and collected by centrifugation. Cells were resuspended with 400 μL 1× Annexin V binding solution at a concentration of approximately 106 cells/mL. After adding 5 μL Annexin V-FITC, cells were mixed and incubated at 4°C under dark conditions for 15 minutes. And then 5 μL PI staining solution was added and incubated at 4°C under dark conditions for 5 minutes. Data were obtained by Beckman CytoFLEXLX flow cytometry system (Beckman Coulter). After obtaining the data, CytExpert software was used for analysis.
Western Blot Analysis
The cells were placed in RIPA lysis solution containing PMSF on ice for 30 minutes and the cells were scraped. Protein supernatant was collected after centrifugation at 4°C, 14 000 r/min for 15 minutes. Protein quantification was performed using BCA kits. 4 × Loading buffer was added into the protein supernatant and then heated for 10 minutes at 100°C to prepare protein samples. The proteins were isolated by SDS-PAGE gel electrophoresis and transferred to PVDF membrane. The protein-loaded membranes were immersed in skim milk (5%) at 37°C for 1 hour. Next, it was incubated with specific primary antibodies at 4°C overnight. The antibodies included anti-BMAL1 (1:1000, Abcam), anti-GRP78 (1:500, Biogot Biotechnology), anti-PERK (1:1000, Cell Signaling Technology), anti-IRE1ɑ (1:1000, Abcam), anti-XBP1 (1:500, Abcam), anti-ATF6 (1:1000, Proteintech), anti-ATF4 (1:500, Proteintech), anti-BAX (1:1000, Abcam), anti-BCL-2 (1:1000, Abcam), anti-β-actin (1:1000, Abmart). β-actin was used in WB as the housekeeping protein. The corresponding secondary antibody (1:10 000, Beyotime) was incubated 2 hours at room temperature, and enhanced chemiluminescence reagent (ThermoFisher) was used to detect the protein band signal. Image J software was used for strip analysis and its gray value was calculated.
RT-qPCR
Trizol (Invitrogen) was used to extract total RNA and Nanodrop 2000 (Thermo Scientific) was used for the detection of RNA concentration. Complementary DNA (cDNA) was reversely transcribed using HiScript II Q RT SuperMix for qPCR (Vazyme) following the manufacturer’s instructions. For the RT-qPCR analysis, AceQ qPCR SYBR Green Master Mix (Vazyme) was used referring to the manufacturer’s instructions. The fold change of the target gene, known as relative expression level, was determined by a 2−△△Ct method. The expression level of the specific transcripts was normalized against that of β-actin. The primers for these transcripts are listed in the Supplemental Table 1.
Statistical Methods
The experimental data results were mainly displayed as mean ± SEM. GraphPad Prism 8.0 software was used for mapping and statistical analysis. The Chi-square test was used to determine the correlation between protein expression and clinical parameters. Kaplan Meier method was adopted to analyze overall survival. A 2-tailed t-test was used to analyze significant differences between 2 independent groups. One-Way ANOVA was used for multiple comparisons to analyze significant differences among >2 groups. P < .05 was considered of statistically significance. Each experiment was conducted 3 times.
Result
BMAL1 Expression is Increased in HCC Tissues and is Associated With Poor Survival of Patients
Immunohistochemistry and Western blot were performed to detect the expression of BMAL1 in HCC tissues. Figure 1A and B showed that the expression of BMAL1 in HCC tissues is significantly higher than that in paired adjacent non-tumor liver tissues (P < .01). Survival analysis revealed that patients with low BMAL1 expression had longer overall survival than those with high BMAL1 expression (P < .01)(Figure 1C). In addition, BMAL1 level was significantly correlated with tumor size (P = .0293) and tumor differentiation (P < .01), but not with age, gender, history of hepatitis or cirrhosis, and the level of AFP (P > .05 for all) (Table 1). Western blot results also showed BMAL1 protein expression levels were up-regulated in 7 pairs of fresh primary liver cancer tissues in comparison with adjacent non-tumor liver tissue (Figure 1D and E).
Correlation Between BMAL1 Expression and Clinicopathological Features of HCC Patients.

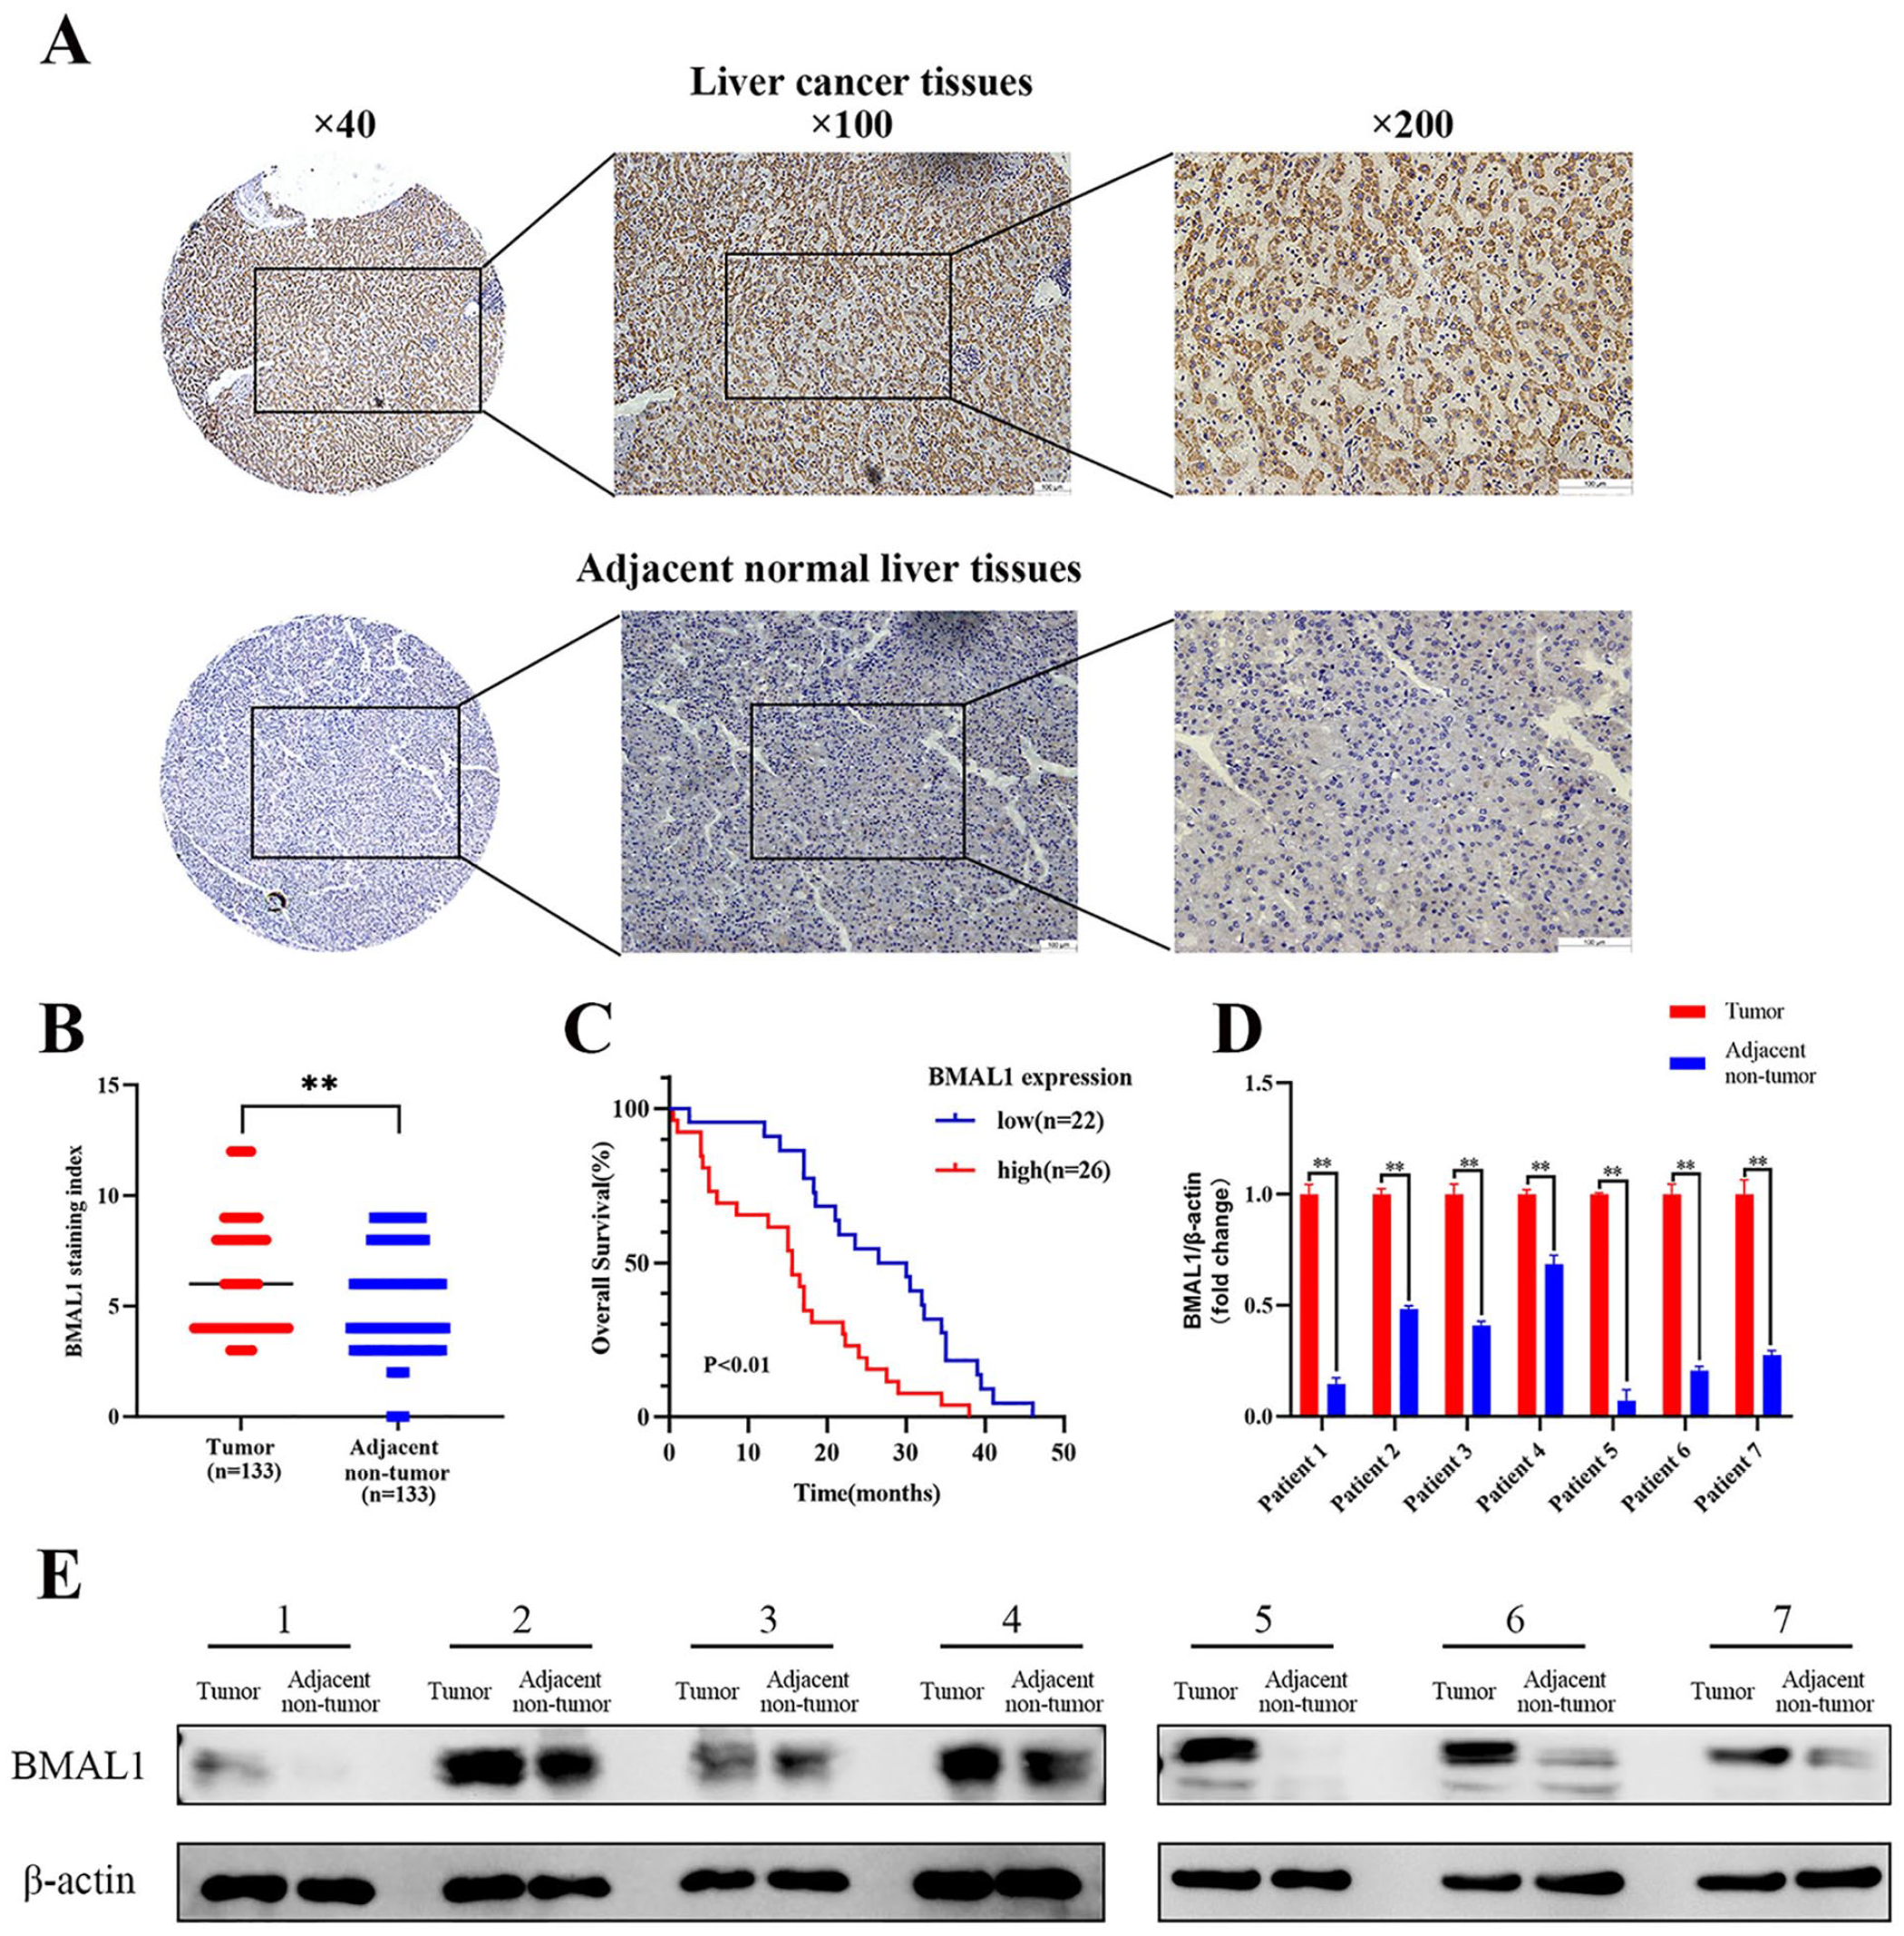
BMAL1 expression is increased in HCC tissues and is associated with poor prognosis in patients. (A) Immunohistochemical staining images of BMAL1 expression in liver cancer tissues and adjacent normal liver tissues. (B) Staining index of BMAL1 in liver cancer tissues and adjacent non-tumor tissues. (C) Kaplan-Meier survival curves of HCC tissues with high and low BMAL1 expression groups. The image (D) and quantification (E) of the relative levels of BMAL1 in liver cancer tissues and adjacent non-tumor liver tissue by Western blot.
BMAL1 Expression in HCC Cell Lines
To explore the role of BMAL1 in HCC, the expression of BMAL1 was detected in normal hepatic cell line (L02) and 5 hepatoma cell lines (HepG2, MHCC-97H, Hep3B, SMMC-7721, BEL-7402) by Western blot assay. The results demonstrated that the expression of BMAL1 in HCC cell lines was obviously higher than that in normal liver cells (P < .01 for all) (Figure 2A). According to the expression of BMAL1, we selected the HCC cell line HepG2, Hep3B with relatively high BMAL1 expression among the 5 HCC cell lines for siRNA mediated BMAL1 knockdown, and the MHCC-97H with relatively low BMAL1 expression was overexpressed by plasmid vector. The efficiency of BMAL1 overexpression was demonstrated in MHCC-97H cells compared with a EV group (Figure 2B). Furthermore, among the 3 siRNAs, si-BMAL1-3 in HepG2 and si-BMAL1-2 in Hep3B cells had the most significant knockdown effect (Figure 2C and D). Therefore, we selected these 2 kinds of siRNAs for further experiments.
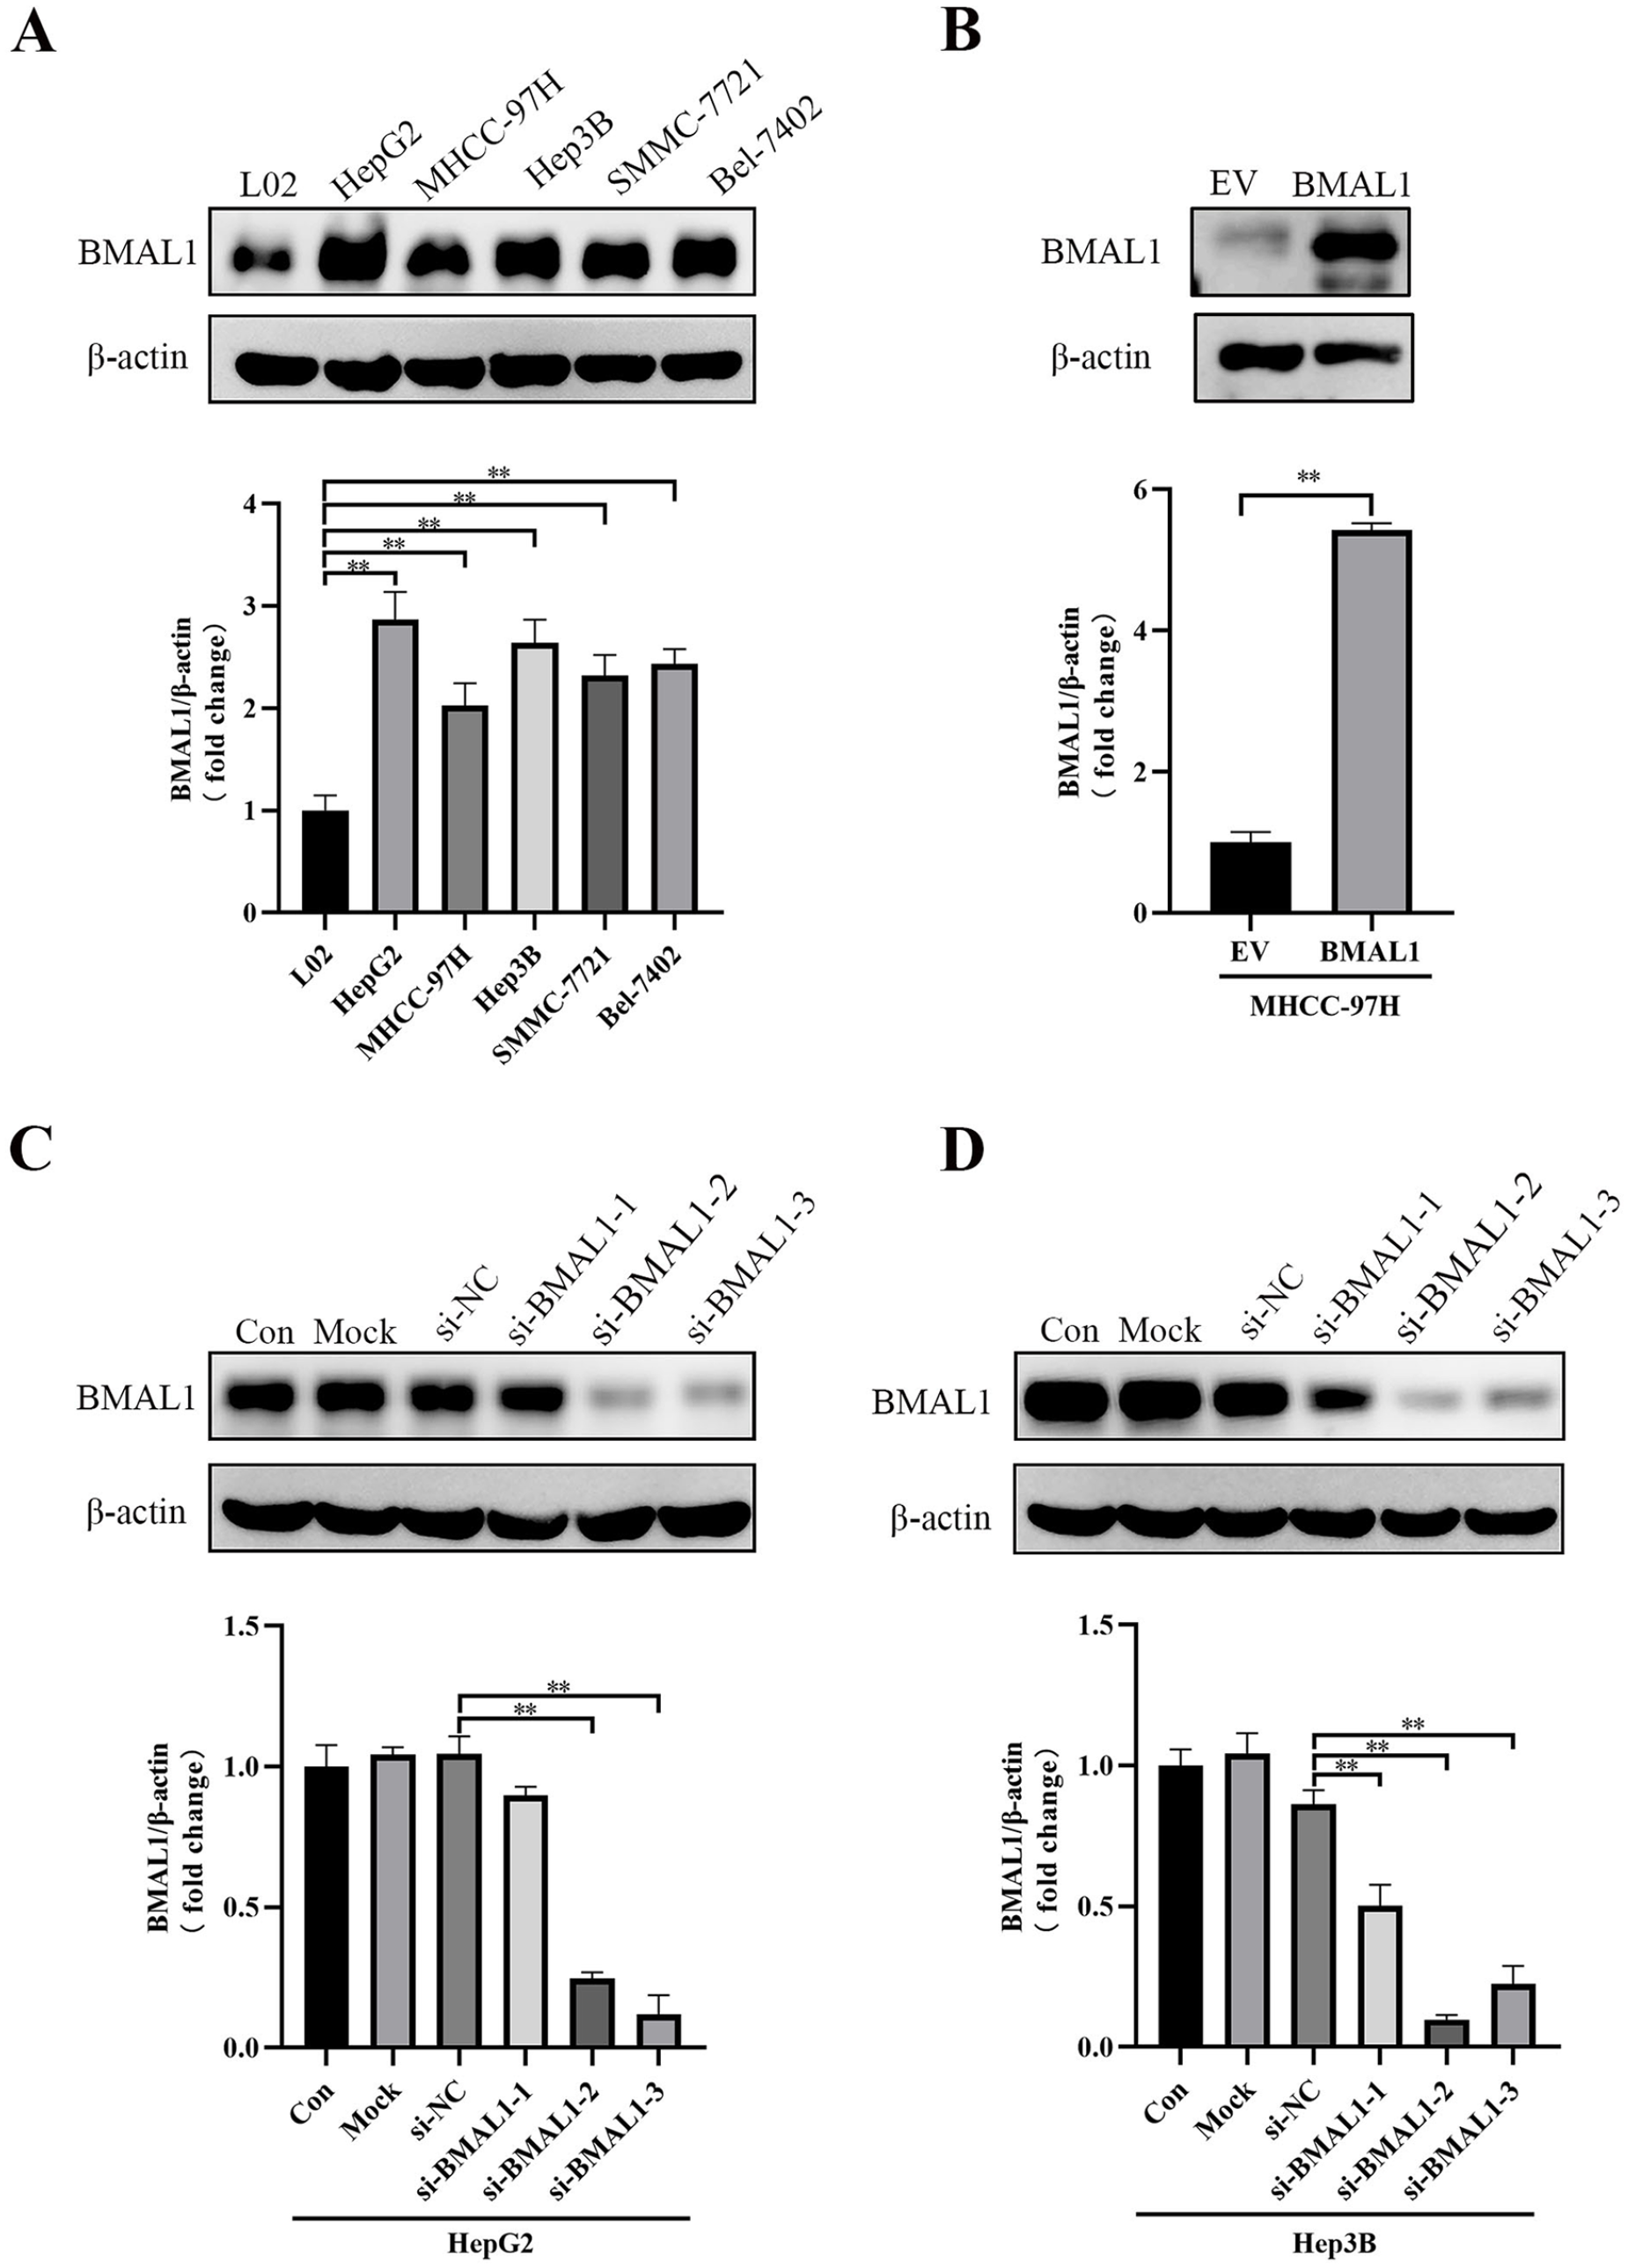
BMAL1 expression in HCC cell line. (A) Protein expression of BMAL1 in 1 normal hepatic cell line (L02) and 5 HCC cell lines (HepG2, MHCC-97H, Hep3B, SMMC-7721, BEL-7402). (B) Representative Western blots of BMAL1 expression in MHCC-97H cells transient transfected with expression vector; EV, empty vector. Representative images of western blotting and BMAL1 expression in HepG2 cell (C) and Hep3B cell (D) with RNA interfering. si-BMAL1-1, si-BMAL1-2, and si-BMAL1-3, siRNAs against BMAL1; Mock, Only transfection reagents are added.
BMAL1 Promotes HCC Cells Proliferation
To further evaluate the effect of BMAL1 on cell proliferation, CCK8 assay and colony-forming assay were used. CCK8 assays showed that BMAL1 knockdown significantly reduced cell proliferation in HepG2 and Hep3B cells while the growth rate of MHCC-97H cells with BMAL1 overexpression was faster than that of the control cells (Figure 3A and B). In addition, knockdown of BMAL1 inhibits colony formation, while overexpression of BMAL1 promotes colony formation (Figure 3C and D).
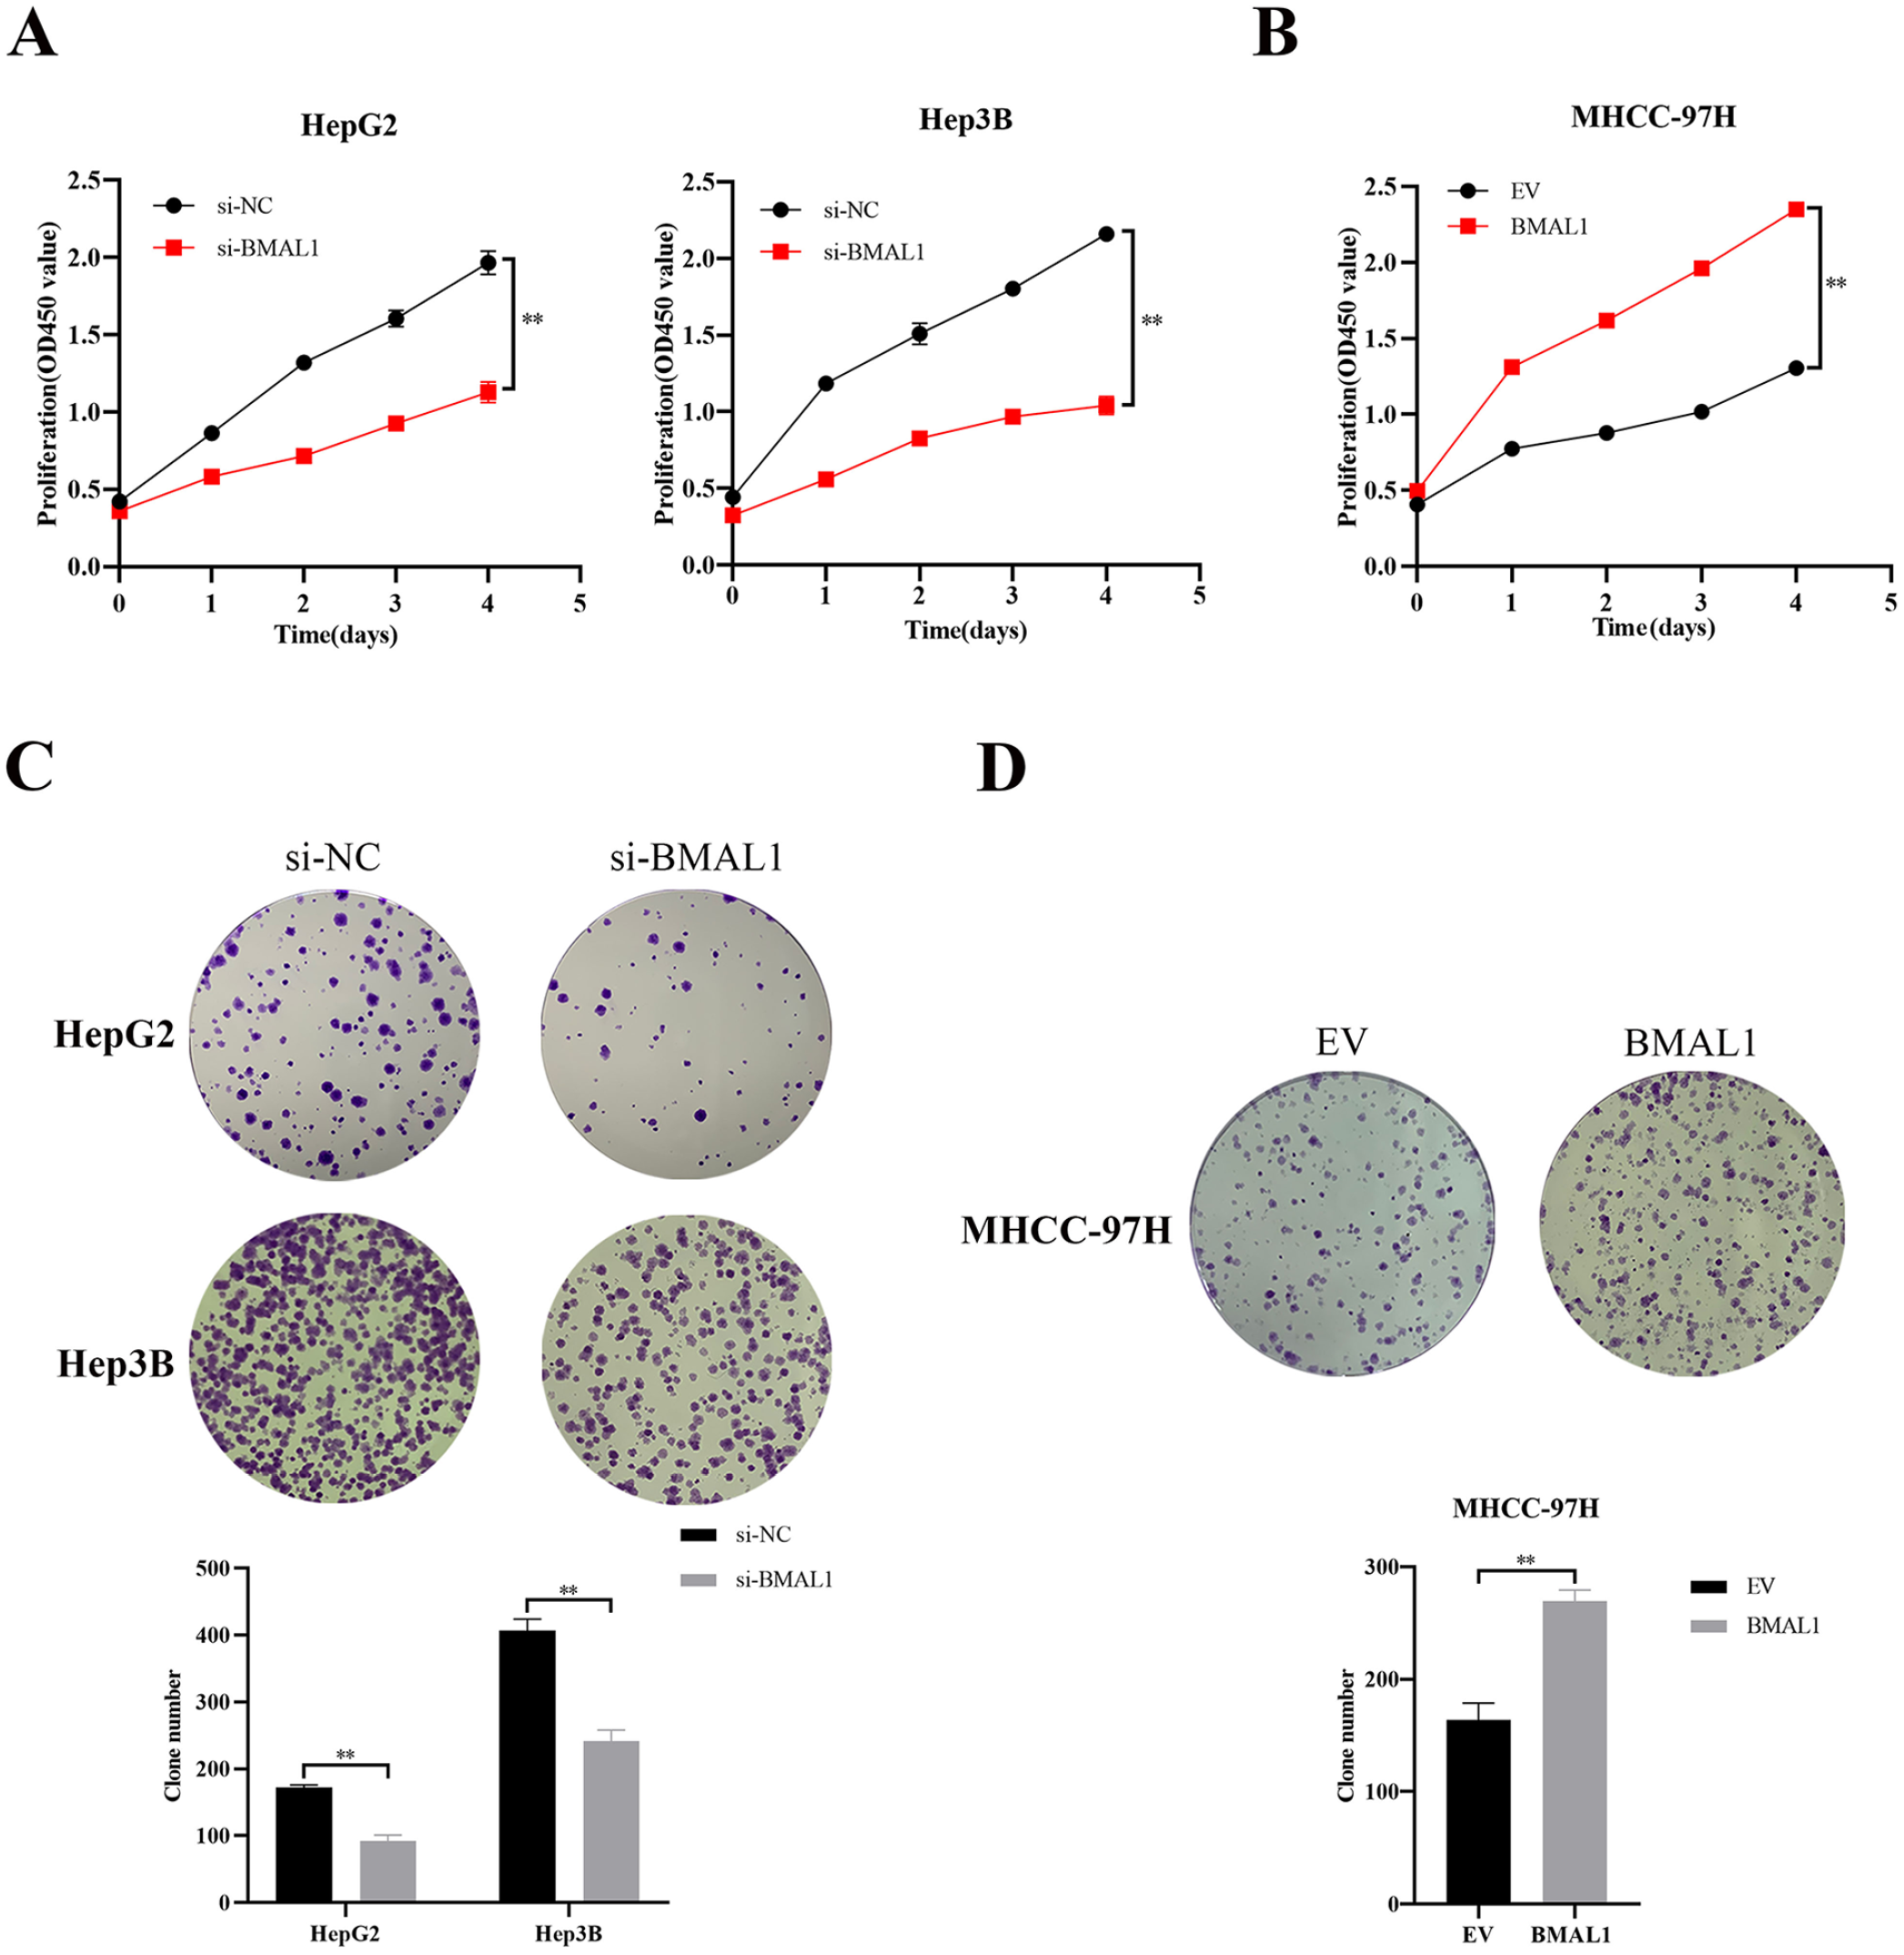
Effect of BMAL1 on HCC cells proliferation. (A and B) CCK-8 assay was used to detect the proliferation of 3 HCC cell lines after BMAL1 deletion or overexpression. (C and D) Colony formation assay was used to detect the growth of 3 HCC cell lines after BMAL1 deletion or overexpression.
BMAL1 Inhibits the Apoptosis of HCC Cells
To evaluate the effect of BMAL1 on cell apoptosis, flow cytometry and western blot were performed. Flow cytometry results revealed that BMAL1 knockdown increased apoptosis rate of HepG2 and Hep3B cells. In contrast, in MHCC-97H cells, CCCP (100 μmol/L), an uncoupler of oxidative phosphorylation in mitochondria, were used to induce apoptosis. We observed that the apoptosis of the BMAL1 overexpression group decreased (Figure 4A and B). Furthermore, western blot showed that in HepG2 and Hep3B cells, compared with NC group, knockdown of BMAL1 significantly reduced the expression of anti-apoptotic protein Bcl-2 and increased the expression level of the pro-apoptotic marker Bax, thus also decreased the Bcl-2/Bax ratio, while the Bcl-2/Bax ratio was increased in the BMAL1 overexpression group (Figure 4C and D).
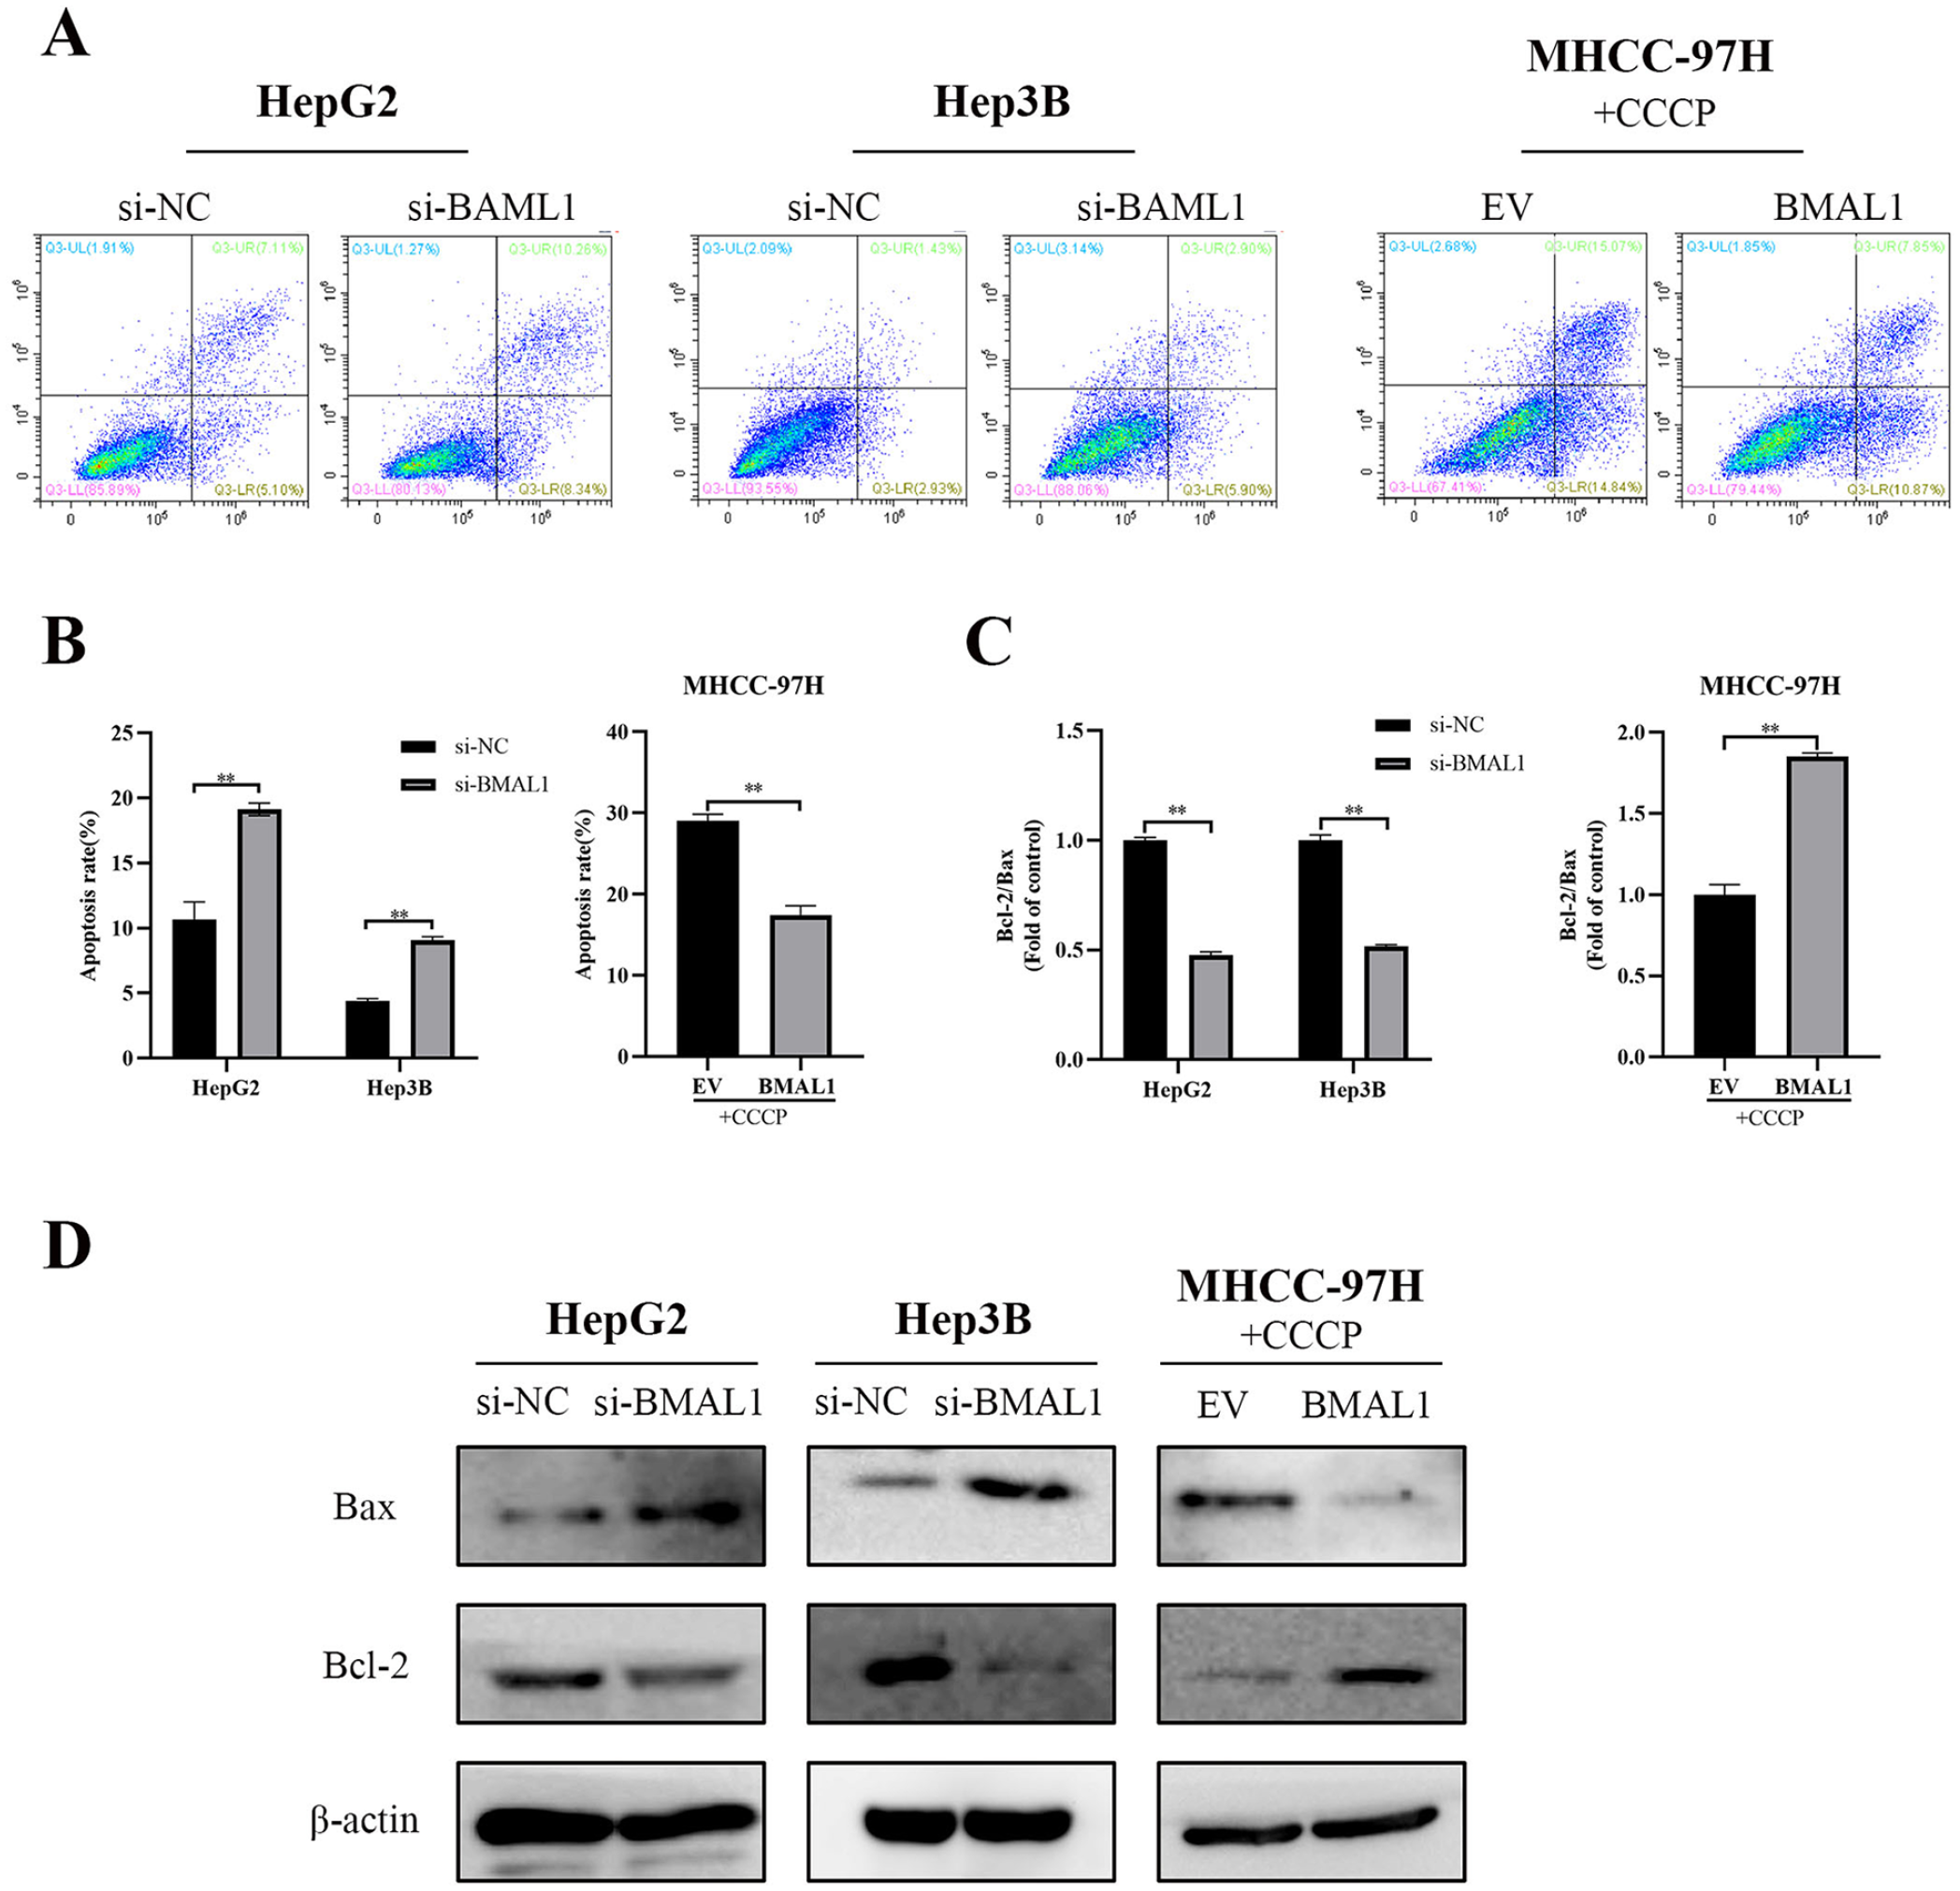
Effect of BMAL1 on HCC cells apoptosis. (A and B) Apoptosis rate of HepG2, Hep3B, and MHCC-97H cells transfected with siRNA or expression vector for 48 hours. MHCC-97H cells were also treated with CCCP (100 μmol/L) for 12 hours before apoptosis analysis. (C and D) Protein expression of BAX and Bcl-2 in HepG2, Hep3B, and MHCC-97H cells 48 hours after transfection with siRNA or expression vector.
BMAL1 Promotes HCC Cells Migration
The wound-healing test and Transwell assay were used to evaluate the effect of BMAL1 on cell migration. The wound-healing test showed that after knockdown of BMAL1, the healing rate of HepG2 and Hep3B cells was reduced. In MHCC-97H cells, the BMAL1 overexpression group grew faster after scratches (Figure 5A and B). Meanwhile, the migration ability of HepG2 and Hep3B cells declined after BMAL1 knockout in the Transwell assay. In MHCC-97H cells, BMAL1 overexpression enhanced cell migration (Figure 5C and D).

Effect of BMAL1 on HCC cells migration. (A and B) Wound-healing assay was used to examine the migration of HCC cells (original magnification, ×100). (C and D) Transwell assay was used to examine the migration of HCC cells.
Effects of BMAL1 on ERS-Related Pathways
Immunohistochemistry and Western blot were used to verify the effect of BMAL1 on ERS-related pathways. As shown in Figure 6A, the staining degree of GRP78 and IRE1ɑ in HCC tissues is appreciably higher than that in paired adjacent non-tumor tissue (P < .01 for both). Moreover, the positive expression of BMAL1 in HCC tissues was associated with the positive expression of GRP78 and IRE1ɑ (Table 2). Moreover, survival analysis showed that the overall survival of the patients with BMAL1+/GRP78+ double-positive expression and BMAL1+/IRE1ɑ+ double-positive expression was worse than that of the other patients (P < .01 for both) (Figure 6B).
Gene Co-occurrent Alteration Between BMAL1, GRP78, and IRE1ɑ.

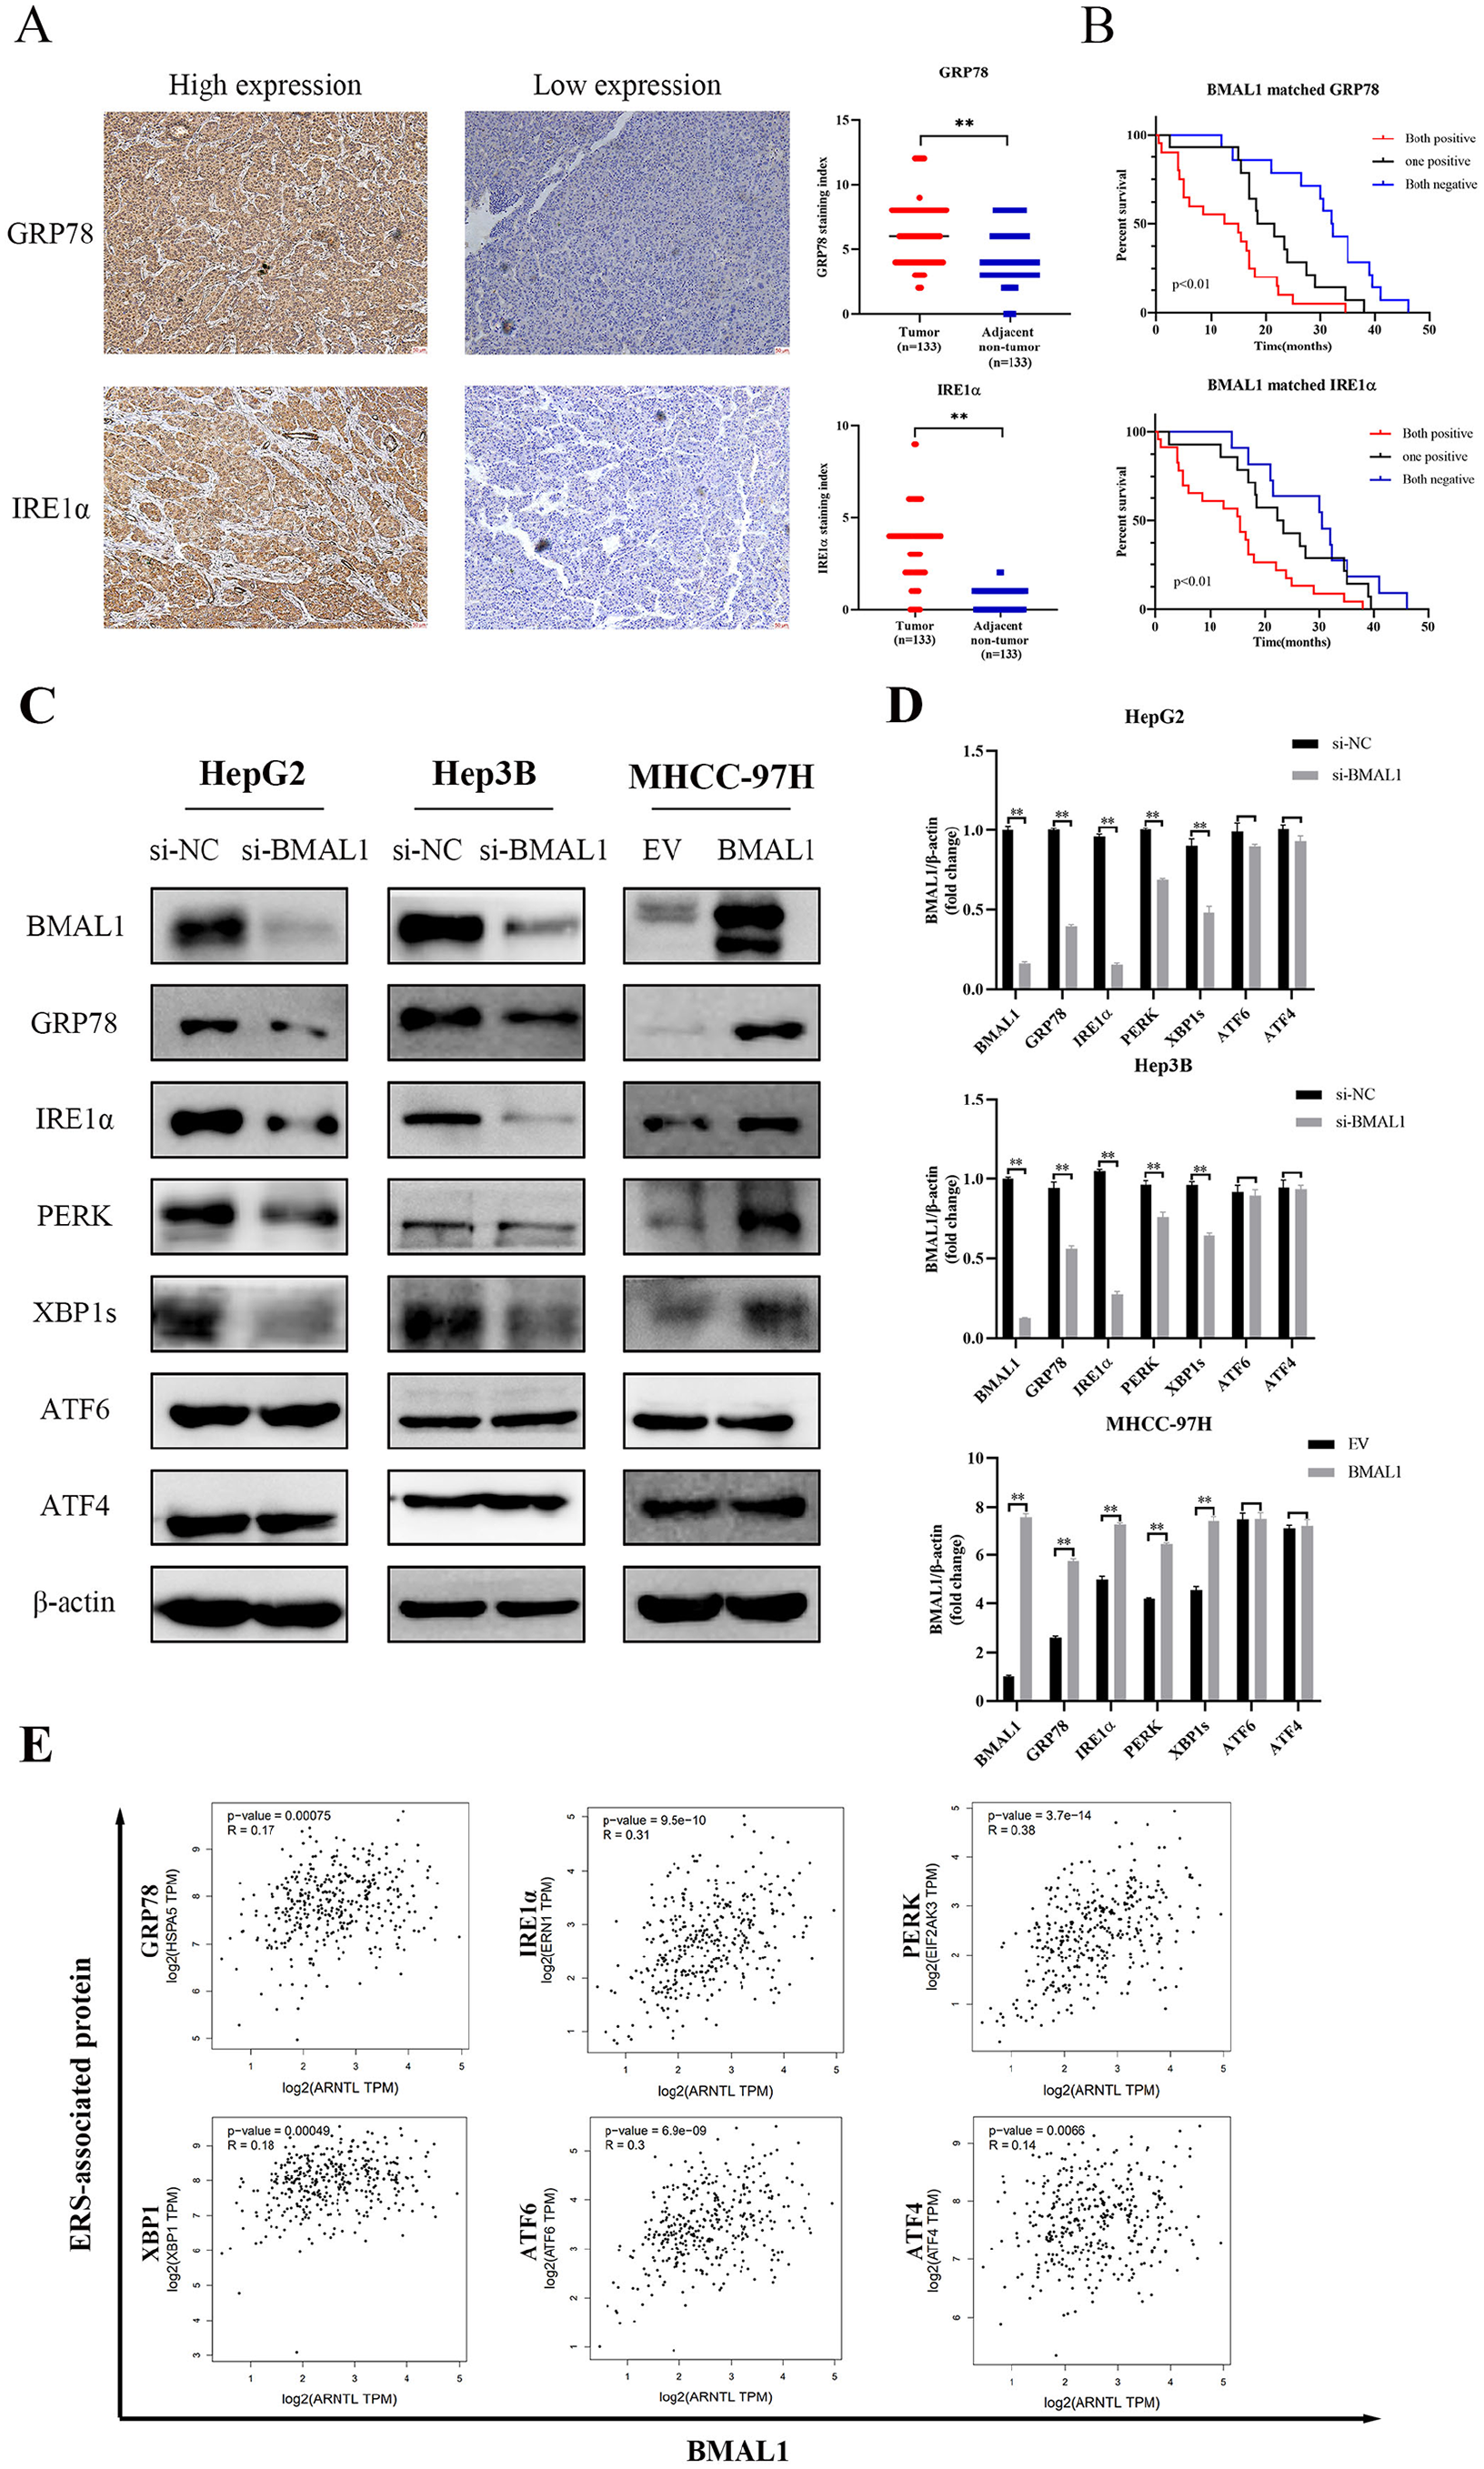
Effects of BMAL1 on ERS-related pathways. (A) Immunohistochemical staining images and index of GRP78 and IRE1ɑ expression in liver cancer tissues and adjacent normal liver tissues. (B) Kaplan-Meier survival curves of overall survival in related groups. (C and D) Protein expression of BMAL1 and ERS-related Protein in HepG2, Hep3B, MHCC-97H cells. (E) Correlation analysis between BMAL1 and ERS-related proteins based on TCGA database.
Apart from this, Western blot results indicated that the expression of GRP78, IRE1ɑ, PERK, and XBP1s was significantly decreased after BMAL1 knockdown by siRNA in HepG2 and Hep3B cells (P < .01 for all), while ATF6 and ATF4 were not down-regulated (P > .05 for all). In addition, BMAL1 was overexpressed in MHCC-97H, and the expression of GRP78, IRE1ɑ, PERK, and XBP1s was also increased (P < .01 for all), while ATF6 and ATF4 were not changed significantly (P > .05 for all) (Figure 6C and D).
Correlation analysis of the TCGA database showed that BMAL1 was positively correlated with GRP78 (R = .17), IRE1ɑ (R = .31), PERK (R = .38), XBP1 (R = .18), ATF6 (R = .3), and ATF4 (R = .14) (P < .01 for all) (Figure 6E). These results were generally consistent with our experimental results, suggesting that BMAL1 may exerted an effect in the occurred and developed periods of liver cancer by affecting ERS level.
Effects of ERS on BMAL1 Expression
The effects of ERS on BMAL1 expression were verified by Western blot and RT-qPCR. ERS was promoted by TM. As shown in Figure 7A to C, we used TM in different concentration (0, 0.3125, 0.625, 1.25, 2.5, 5 μmol/L) in the treatment of MHCC-97H cells. The expression of GRP78 and IRE1ɑ increased with the increase of TM concentration, while the expression of BMAL1 increased when the concentration of TM ≤1.25 μmol/L and decreased when the concentration of TM ≥2.5 μmol/L. The same results were observed in WB and RT-qPCR.

Effects of ERS on BMAL1 expression. (A and B) After treatment with different concentrations of TM, protein expression of BMAL1, GRP78, IRE1ɑ in MHCC-97H cells. (C) After treatment with different concentrations of TM, mRNA expression of BMAL1, GRP78, IRE1ɑ in MHCC-97H cells.
Effects of Melatonin on Expression of BMAL1 and Apoptosis of HCC Cells
Western blot and flow cytometry were both utilized to investigate the effect of MT on the expression of BMAL1 and apoptosis of HCC cells. Figure 8A and B showed that MT reduced the expression of BMAL1 in all 3 hepatoma cell lines, and with the increase of MT concentration, the expression of BMAL1 decreased and apoptosis increased. The MT concentration used in subsequent experiments was 10 to 5 mmol/L, which was the minimum concentration to reduce BMAL1 protein. In HepG2 and Hep3B, siRNA-mediated knockdown BMAL1, MT also reduced the expression of BMAL1, and si-BMAL1+MT further reduced the expression of BMAL1 (Figure 8C and D). Flow cytometry showed that in HepG2 and Hep3B cells, knockdown BMAL1 apoptosis is increased. In addition, the apoptosis rate of si-BMAL1+MT group was significantly increased (Figure 8E and F). Therefore, we concluded that MT can promote hepatoma cell apoptosis by reducing the expression of BMAL1.

Effect of melatonin on the expression of BMAL1 and apoptosis of BMAL1 gene knockout HCC cells. (A and B) Protein expression images and quantification of the relative levels of BMAL1, BAX, BCL-2 in HCC cells by western blotting. (C and D) Protein expression images and quantification of the relative levels of BMAL1 in HepG2 and Hep3B cells in si-NC, si-BMAL1, si-NC+MT, and si-BMAL1+MT groups. (E and F) Apoptosis rate of si-NC, si-BMAL1, si-NC+MT, and si-BMAL1+MT groups in HepG2 and Hep3B cell.
Discussion
There is some evidence of circadian disruption in cancers. However, there is little known about the role of the core circadian gene BMAL1 in HCC, the relationship between BMAL1 and ERS, and whether melatonin affects its expression. In this study, we found that: (1) Compared to adjacent non-tumor tissues, BMAL1 is up-regulated in liver cancer tissues, and BMAL1 level is correlated with ER stress activation and poor clinical prognosis in HCC patients. (2) Through knockdown and forced expression of BMAL1, we found that BMAL1 promoted cell proliferation and migration, but inhibited cell apoptosis. (3) BMAL1 is positively correlated with ERS related molecules, GRP78, IRE1ɑ, PERK, and XBP1s. After knockdown BMAL1, the expression of these molecules is also decreased, and after overexpression BMAL1, they are also increased. (4) Low concentration of ERS increased the expression of BMAL1, while high concentration of ERS inhibited the expression of BMAL1. (5) Melatonin promotes apoptosis of HCC cells by inhibiting the expression of BMAL1. These findings suggest that BMAL1, as a tumor promoter of HCC, may be a potential treatment target for HCC. In addition, BMAL1 may promote the occurrence and development of tumors by interacting with ERS-related pathways. The increase of BMAL1 in liver cancer leads to the increase of ERS, but when ERS increases to a certain extent, it conversely inhibits the expression of BMAL1. This keeps BMAL1 at a constant level with ERS, preventing persistent and intense ERS from promoting cell death. Melatonin regulates ERS-related apoptotic resistance in HCC cells by inhibiting BMAL1 expression.
Some previous studies have reported that BMAL1 is expressed to varying degrees in tumor and normal tissues, and has different effects in different tumors. As a tumor suppressor gene, BMAL1 has low expression in tumor tissues (eg, head and neck squamous cell carcinoma, 21 nasopharyngeal carcinoma, 22 glioblastoma, 23 colorectal cancer,24,25 and pancreatic cancer 26 ) compared with normal tissue. On the other hand, as a oncogenic gene, BMAL1 is highly expressed in thyroid cancer, 6 pleural mesothelioma, 7 and prostate cancer. 8 In liver cancer, Yuan et al 27 found that BMAL1 binds with NPAS2 to promote the survival of liver cancer cells. In addition, Sánchez et al 28 pointed out that the expression of BMAL1 in the liver of mice treated with diethylnitrosamine (DEN) increased, and melatonin treatment could inhibit the change of BMAL1 expression. The above studies indicate that BMAL1 participated in the occurrence and development of various types of tumors and plays different roles, and the diversity of roles may be associated with the changes of the environment in different tumors. In the current study, we found that BMAL1 was up-regulated in the tissues of HCC patients and was associated with ER-stress activation and poor clinical outcomes. In addition, we found that as an oncogene in HCC, cell proliferation and migration can be promoted by BMAL1 and cell apoptosis can be inhibited by BMAL1. These findings suggest that BMAL1 may be involved in HCC progression, which may serve as a potential therapeutic target. However, the role of BMAL1 in malignant tumors is still controversial, and further in vivo experiments may be needed to prove the role of BMAL1 in HCC.
Biological clock signaling pathways and ERS play a crucial role in regulating various biological processes. Multiple studies have shown that the biological clock regulates UPR pathways. Circadian rhythm and UPR mediate the translation response of hepatic steatosis under ERS. CPEB4 binds the clock and the UPR to protect the liver. 29 In patients with glioblastoma, low PER1 expression and high UPR are associated with poorer prognosis. 30 In NIH3T3 mouse fibroblasts, ER-stress activation has been shown to inhibit the transcription of both circadian clock and clock-controlled genes through an ATF4-dependent mechanism. 11 This study reveals that after BMAL1 knockdown, the expression of ERS related molecules GRP78, IRE1ɑ, PERK, and XBP1 also decreased, and after BMAL1 overexpression, they also increased, while ATF6 and ATF4 were not statistically significant. In addition, after liver cancer cells (MHCC-97H) were treated with TM of different concentration gradient, WB and RT-qPCR showed that low TM concentration increased BMAL1, while high TM concentration decreased BMAL1. Therefore, we propose that there is an interaction between BMAL1 and ERS, that is, in HCC cells, circadian rhythm is disturbed, BMAL1 expression is increased, and ERS related pathways are activated. Low concentrations of ERS increase the expression of BMAL1, and when ERS occurs to a certain intensity, it conversely inhibits the expression of BMAL1, ensuring that the mild ERS state is maintained to promote tumor survival. However, the mechanism by which BMAL1 activates ERS-related pathways needs to be clarified by our further experiments.
Melatonin as a key regulator of the body’s circadian rhythm. Evidence from various studies suggests that melatonin and core clock genes are of vital importance to the development of breast cancer. 31 Melatonin regulates circadian dysregulation in diethylnitrosamine-induced hepatocellular carcinoma mice. 28 Moreover, another study reported that, melatonin plays an anti-proliferative role in prostate cancer by resynchronizes dysregulated circadian rhythm circuitry. 8 In this study, we show that melatonin reduces BMAL1 expression in HCC cells via a dose-dependent manner. And apoptosis of HCC cells with BMAL1-knockdown is significantly increased after melatonin treatment. Our study suggests that melatonin may promote HCC cell apoptosis by inhibiting BMAL1 and regulating ERS-related resistance. The results obtained support the effectiveness of melatonin as a cancer suppressor and the circadian mechanism as an attractive target for therapeutic interventions in liver cancer. However, our study did not reveal the underlying mechanism of melatonin’s effect on BMAL1 expression and HCC, so further studies are needed.
Conclusion
This study demonstrated the pro-survival role of BMAL1 in HCC, and suggested that its function may be related to ERS interaction. Melatonin can regulate ERS-related apoptosis resistance by inhibiting BMAL1 expression, promoting apoptosis of HCC cells.
Supplemental Material
sj-docx-2-ict-10.1177_15347354221099539 – Supplemental material for Melatonin Reduces Apoptosis Resistance of Hepatocellular Carcinoma Cells by Inhibiting BMAL1
Supplemental material, sj-docx-2-ict-10.1177_15347354221099539 for Melatonin Reduces Apoptosis Resistance of Hepatocellular Carcinoma Cells by Inhibiting BMAL1 by Anqi Wang, Bei Zhou, Yue Zhu, Chaisheng Tan, Jing Xu, Jie Cui, Li Zhang and Guoping Sun in Integrative Cancer Therapies
Supplemental Material
sj-pdf-1-ict-10.1177_15347354221099539 – Supplemental material for Melatonin Reduces Apoptosis Resistance of Hepatocellular Carcinoma Cells by Inhibiting BMAL1
Supplemental material, sj-pdf-1-ict-10.1177_15347354221099539 for Melatonin Reduces Apoptosis Resistance of Hepatocellular Carcinoma Cells by Inhibiting BMAL1 by Anqi Wang, Bei Zhou, Yue Zhu, Chaisheng Tan, Jing Xu, Jie Cui, Li Zhang and Guoping Sun in Integrative Cancer Therapies
Footnotes
Acknowledgements
We thank the members of the Institute of Clinical Pharmacology of Anhui Medical University for technical assistance.
Author Contributions
Guoping Sun initiated the study and critically revised the manuscript and provided the final approval of the manuscript; Anqi Wang designed the study, conducted relevant experiments, and wrote the manuscript; Bei Zhou conducted data analysis and investigation; Yue Zhu and Chaisheng Tan collected samples and provided clinical information; Jing Xu critically revised and reviewed the manuscript; Jie Cui and Li Zhang helped perform the analysis with constructive discussions. All authors have read and approve the final manuscript.
Data Availability Statement
The datasets during and/or analyzed during the current study available from the corresponding author on reasonable request.
Declaration of Conflicting Interests
The author(s) declared no potential conflicts of interest with respect to the research, authorship, and/or publication of this article.
Funding
The author(s) disclosed receipt of the following financial support for the research, authorship, and/or publication of this article: This article was supported by the National Natural Science Foundation of China (No.81872047;82072751).
Supplemental Material
Supplemental material for this article is available online.
References
Supplementary Material
Please find the following supplemental material available below.
For Open Access articles published under a Creative Commons License, all supplemental material carries the same license as the article it is associated with.
For non-Open Access articles published, all supplemental material carries a non-exclusive license, and permission requests for re-use of supplemental material or any part of supplemental material shall be sent directly to the copyright owner as specified in the copyright notice associated with the article.