
Abstract
Objective
Titanium oxide (TiO2) acts as a photosensitizer in photodynamic therapy by mediating reactive oxygen species (ROS)-induced endoplasmic reticulum (ER) stress. This study aimed to investigate the effect of TiO2 on ER stress in liver cancer cells.
Methods
Normal human liver and human hepatocarcinoma cell lines were incubated with various concentrations of TiO2 nanotubes for 48 hours. Cell growth, apoptosis, cell cycle, and cellular ROS were detected. Expression levels of ER stress sensors (PERK and ATF6) and Bax were evaluated by western blot. The effect of TiO2 on liver cancer growth was also investigated in mice in vivo.
Results
TiO2 inhibited cell growth, increased apoptosis and cellular ROS levels, and arrested the cell cycle in G1 stage in liver cancer cells. TiO2 also increased PERK, ATF6, and Bax expression levels in liver cancer cells in dose-dependent manners. TiO2 had no significant effect on cell growth, apoptosis, ROS level, cell cycle distribution, or PERK, ATF6, or Bax expression in normal liver cells. TiO2 administration reduced tumor volume and increased PERK, Bax, and ATF6 expression levels in tumor tissues in vivo.
Conclusions
TiO2 nanoparticles increased ROS-induced ER stress and activated the PERK/ATF6/Bax axis in liver cancer cells in vitro and in vivo.
Keywords
Introduction
Liver cancer is one of the most common malignancies and a leading cause of cancer-related death worldwide. 1 Numerous studies have demonstrated that some pharmaceutical agents can induce liver cancer cell apoptosis by triggering reactive oxygen species (ROS)-mediated endoplasmic reticulum (ER) stress.2–4 However, liver cancer cell heterogeneity and drug resistance pose major obstacles to the treatment of liver cancer. Recent evidence has indicated that nanoparticles conjugated with pharmaceutical agents or genetic vectors can enhance drug sensitivity in cancer cells.5–7
Nanoscaled titanium oxide (TiO2) photocatalyst has been regarded as a potential photosensitizer in ultraviolet light-driven photodynamic therapy, and has been widely used in clinical cancer treatments based on its photocatalytic, biocompatible, and favorable mechanical properties.8–10 Photoexcited TiO2 affects cellular functions by driving ROS production and thus exerting nanotoxicity in cancer cells. 11 TiO2 particles can induce malignant cell apoptotic death via the production of ROS, 12 and ROS on the surface of TiO2 nanoparticles caused oxidative stress in adjacent cells or tissues, and preferentially damaged cancer cells.12,13 However, information about the therapeutic effect of TiO2 in liver cancer and its underlying mechanisms is still lacking.
ROS-induced accumulation of misfolded and unfolded polypeptides in the ER activates the adaptive intracellular stress response (unfolded protein response) to reduce ER stress by correcting or degrading misfolded polypeptides within the ER.14,15 The ROS-induced ER stress response can trigger cell apoptosis by inducing the expression of ER sensor proteins, including protein kinase RNA-like endoplasmic reticulum kinase (PERK), activating transcription factor 6 (ATF6), eukaryotic initiation factor (eIF) 1, and X-box binding protein 1, and their downstream signaling pathways, such as the PERK/eIF2α/ATF4/CCAAT enhancer‐binding protein homologous protein (CHOP) pathway.16,17 The ER stress response and the induction of these genes or pathways have been identified in many diseases such as oxidative-stressed liver, 18 breast cancer, 12 liver cancer, 19 and glioma cells. 20 Nanoparticle-induced ER stress is an early biomarker for nanotoxicity evaluation. 21 Moreover, ER stress-mediated cancer cell apoptosis has been reported to be involved in the cytotoxic effect of TiO2.
In this study, we investigated the toxicity and underlying mechanism of TiO2 in liver cancer cells to reveal its potential therapeutic application in patients with liver cancer.
Materials and methods
Cell lines and culture conditions
The human normal liver cell line L02 and human hepatocarcinoma cell line HepG2 were obtained from the American Type Culture Collection (Manassas, VA, USA). Cells were revivified and cultured in Dulbecco’s Modified Eagle Medium (DMEM; Gibco, Burlington, ON, Canada) supplemented with 10% fetal bovine serum (Gibco) in a humidified 5% CO2 incubator at 37°C.
Cellular TiO2 treatment
TiO2 nanoparticles were purchased from ACMEC Biochemical Co., Ltd. (Shanghai, China; cat. no. T446775-1g). Experimental TiO2 nanoparticles were stored in our laboratory, and TiO2 nanoparticles solution (50 µg/mL) was prepared in 75% ethanol. Solutions of TiO2 nanoparticles (400 µL) at concentrations of 0, 2.5, 5.0, 7.5, and 10 µg/mL in 75% ethanol were added to the bottom layer of 6-well plates (Costar Corning Inc., Corning, NY, USA) and incubated in an electric thermostatically controlled incubator at 60°C (DHP-9162, Shanghai Yiheng Technical Co., Ltd., Shanghai, China). Prior to cell treatment, dry plates were sterilized with ultraviolet light on a clean bench for 2 hours. For TiO2 treatment, 2 mL of cell cultures (density 1 × 10⁵ cells/mL) were added into the 6-well plates coated with TiO2 and maintained for 48 hours. Each experiment was performed in triplicate.
Cell counting analysis
Cells in logarithmic growth were treated with TiO2 for 48 hours, harvested, centrifuged at 151 × g for 5 minutes, and diluted with 2 mL DMEM (Gibco). The cells were then placed in plates and cell numbers were counted under an inverted microscope (×100, Axiovert 40C; Carl Zeiss, OberkochenWuertt, Germany). Cell number was calculated as the average cell number from four chambers × 104.
Cell cycle and Annexin V apoptosis assay
Cells were harvested from the 6-well plates using trypsin, after TiO2 treatment for 48 hours (Gibco). For cell cycle analysis, cells were harvested and labeled with propidium iodide (PI), followed by flow cytometry analysis (Becton Dickinson Immunocytometry Systems, San Jose, CA, USA). For cell apoptosis analysis, cells were washed with 1× phosphate-buffered saline (PBS) (pH 7.2), resuspended in 1 × Annexin V-binding buffer (BioLegend, San Diego, CA, USA), centrifuged at 97 × g for 3 minutes, and then resuspended in 100 μL 1 × Annexin V-binding buffer. Apoptotic cells and necrosis were detected by flow cytometry (Becton Dickinson Immunocytometry Systems) after staining with Annexin V-fluorescein isothiocyanate and 7-amino-actinomycin D (BioLegend).
Measurement of ROS
Cellular ROS levels were measured by 2′,7′-dichlorofluorescin diacetate (DCFDA) flow cytometric analysis. After treatment with TiO2 nanoparticles, the cells were incubated with 10 μM DCFDA staining solution (Beyotime Biotech, Nantong, China) at 37°C and 5% CO2 for 20 minutes. Cellular ROS levels were then measured using a BD flow cytometer (BD Biosciences, San Jose, CA, USA).
Animal model
The animal experiment protocols were approved by the Ethics Committee of Guangdong Second Provincial General Hospital. Male BALB/C nude mice (weight 15–20 g; Laboratory Animal Center of Southern Medical University, Guangzhou, China) were allowed to acclimatize for 5 days under specific-pathogen-free conditions with free access to food and water. A subcutaneous tumor model was created by injection of 4 × 10⁶ HepG2 cells per mouse. Fourteen days later, 30 tumor-bearing mice were divided randomly into two groups (n = 15 per group) and treated by intratumoral injection of 200 μL (nano sol in distilled water) of PBS (control group) or 1 mg/mL TiO2 nanomaterials. TiO2 administration was performed every 6 days. All mice were sacrificed 30 days later by intraperitoneal injection of a lethal dose of sodium pentobarbital. Death was confirmed by cessation of breathing and heartbeat. Tumor tissues were separated and tumor volume was measured. The samples were then fixed or frozen in liquid nitrogen for immunohistochemical and western blot analysis, respectively.
Immunohistochemistry
Fixed tumor tissues were transparentized, embedded in paraffin, and cut into 4-µm sections. Endogenous peroxidase activity was quenched and the sections were blocked with normal goat serum (Gibco) for 30 minutes. The sections were then incubated with specific primary monoclonal antibodies against ATF6 (dilution 1:250; Abcam, Cambridge, MA, USA) and phospho-PERK (dilution 1:200; Abcam) for 12 hours at 4°C, followed by incubation with horseradish peroxidase (HRP)-labeled goat anti-rabbit/rat IgG secondary antibody (dilution 1:1000, Santa Cruz Biotechnology, Santa Cruz, CA, USA) at room temperature for 4 hours. ATF6- and PERK-positive cells were visualized using diaminobenzidine staining and images were obtained using an Olympus microscope (BX51T-PHD-J11, ×400, Olympus Corporation, Tokyo, Japan) after counterstaining with hematoxylin. Isotype-matched IgG antibody was used as a negative control.
Western blot analysis
Total protein was isolated from the cells and tumor samples. Tumor tissues were minced, ground, and homogenized in ice-cold RIPA lysis buffer (Fermentas, Thermo Fisher Scientific, Waltham, MA, USA) containing phenylmethylsulfonyl fluoride (PMSF; 100:1). Cells were harvested using trypsin (Gibco) and subjected to ice-cold RIPA lysis buffer (Fermentas, Thermo Fisher Scientific) containing PMSF (100:1). Lysates were centrifuged at 10800 × g for 15 minutes at 4°C, followed by quantification using a Pierce BCA protein assay kit (cat. no. 23225; Thermo Fisher Scientific). Equal amounts of protein (100 μg per sample) were separated by 10% sodium dodecyl sulfate-polyacrylamide gel electrophoresis (CWBIO, Beijing, China) and transferred onto polyvinylidene difluoride membranes (Millipore Filter Corp., Watertown, MA, USA) at 16 W for 30 minutes. Proteins on the membranes were subjected to immunoblotting according to standard procedures, using primary antibodies against ATF6 (dilution 1:1000; Abcam), phospho-PERK (dilution 1:1000; Abcam), anti-Bcl-2 family protein (Bax, dilution 1:1500), glyceraldehyde 3-phosphate dehydrogenase (dilution 1:2000; Abcam), and goat anti-rabbit/rat IgG (dilution 1:5000; Santa Cruz). Secondary HRP-labeled goat anti-rabbit/rat IgG antibody (dilution 1:5000; Santa Cruz) was then added and the membranes were developed by enhanced chemiluminescence (Millipore Corp., Watertown, MA, USA). The band pattern was visualized and imaged using a WD-9413B gel imaging analyzer (Beijing Liuyi Instrument Factory, Beijing, China).
All statistical analyses were carried out using SPSS 17.0 (IBM, Armonk, NY, USA). All data were expressed as mean ±standard deviation of triplicate experiments or five samples. For multiple comparisons, normally distributed data sets with equal variances (Bartlett’s test) were analyzed by one-way analysis of variance (ANOVA) with post hoc Student–Newman–Keuls tests. Non-normally distributed data were analyzed using non-parametric Kruskal–Wallis followed by Dunn’s multiple comparison tests. P < 0.05 was considered statistically significant. Graphs were constructed using GraphPad Prism 6.0 (GraphPad Software Inc. La Jolla, CA, USA).
Results
TiO2 inhibited liver cancer cell growth
The effect of TiO2 on the growth of liver cancer cells was determined by cell counting analysis, using normal hepatic epithelial L02 cells as a control. TiO2 had no significant effect on the growth of L02 cells (Figure 1a). In contrast, plate-coated TiO2 nanotubes significantly inhibited the proliferation of liver cancer cells at concentrations of 5.0, 7.5, and 10 µg/mL (P < 0.05 or <0.01) (Figure 1b), suggesting that TiO2 inhibited liver cancer cell growth in a dose-dependent manner.

Influence of TiO2 nanotubes on cell growth. L02 (a) and HepG2 (b) cells were incubated in TiO2 nanotube-coated (2.5, 5.0, 7.5, and 10 µg/mL) 6-well plates for 48 hours at 60°C. Cell numbers were counted using cell counting chambers. Cells incubated in 6-well plates coated with 0 µg/mL TiO2 nanotubes were used as a control. *P < 0.05 and **P < 0.01 vs. 0 µg/mL (control).
TiO2 promoted the apoptosis of liver cancer cells by cell cycle arrest at G1 stage
Flow cytometry analysis showed not obvious effect of TiO2 on the apoptosis of L02 cells (Figure 2a). In contrast, plate-coated TiO2 significantly increased the percentage of apoptotic liver cancer cells in a dose-dependent manner (P < 0.05) (Figure 2b). TiO2 thus promoted the apoptosis of liver cancer cells but had little effect on normal liver cells. Regarding cell cycle analysis, TiO2 treatment had no significant effect on cell cycle progression in L02 cells (Figure 3a), but significantly increased the percentage of G1 stage and decreased the percentage of S phase HepG2 cells (P < 0.05) (Figure 3b). These results revealed that TiO2 promoted the apoptosis of liver cancer cells by blocking the cell cycle in G1 phase.

L02 (a) and HepG2 (b) cells were cultured in 6-well plates for 48 hours, then apoptosis of L02 cells and HepG2 cells was detected by flow cytometry. TiO2 increased the percentage of apoptotic liver cancer cells. Annexin V-positive cells were considered as apoptotic liver cancer cells. Cells incubated with 0 µg/mL TiO2 were used as a control. *P < 0.05 and **P < 0.01 vs. 0 µg/mL (control). AAD, 7-amino-actinomycin D.
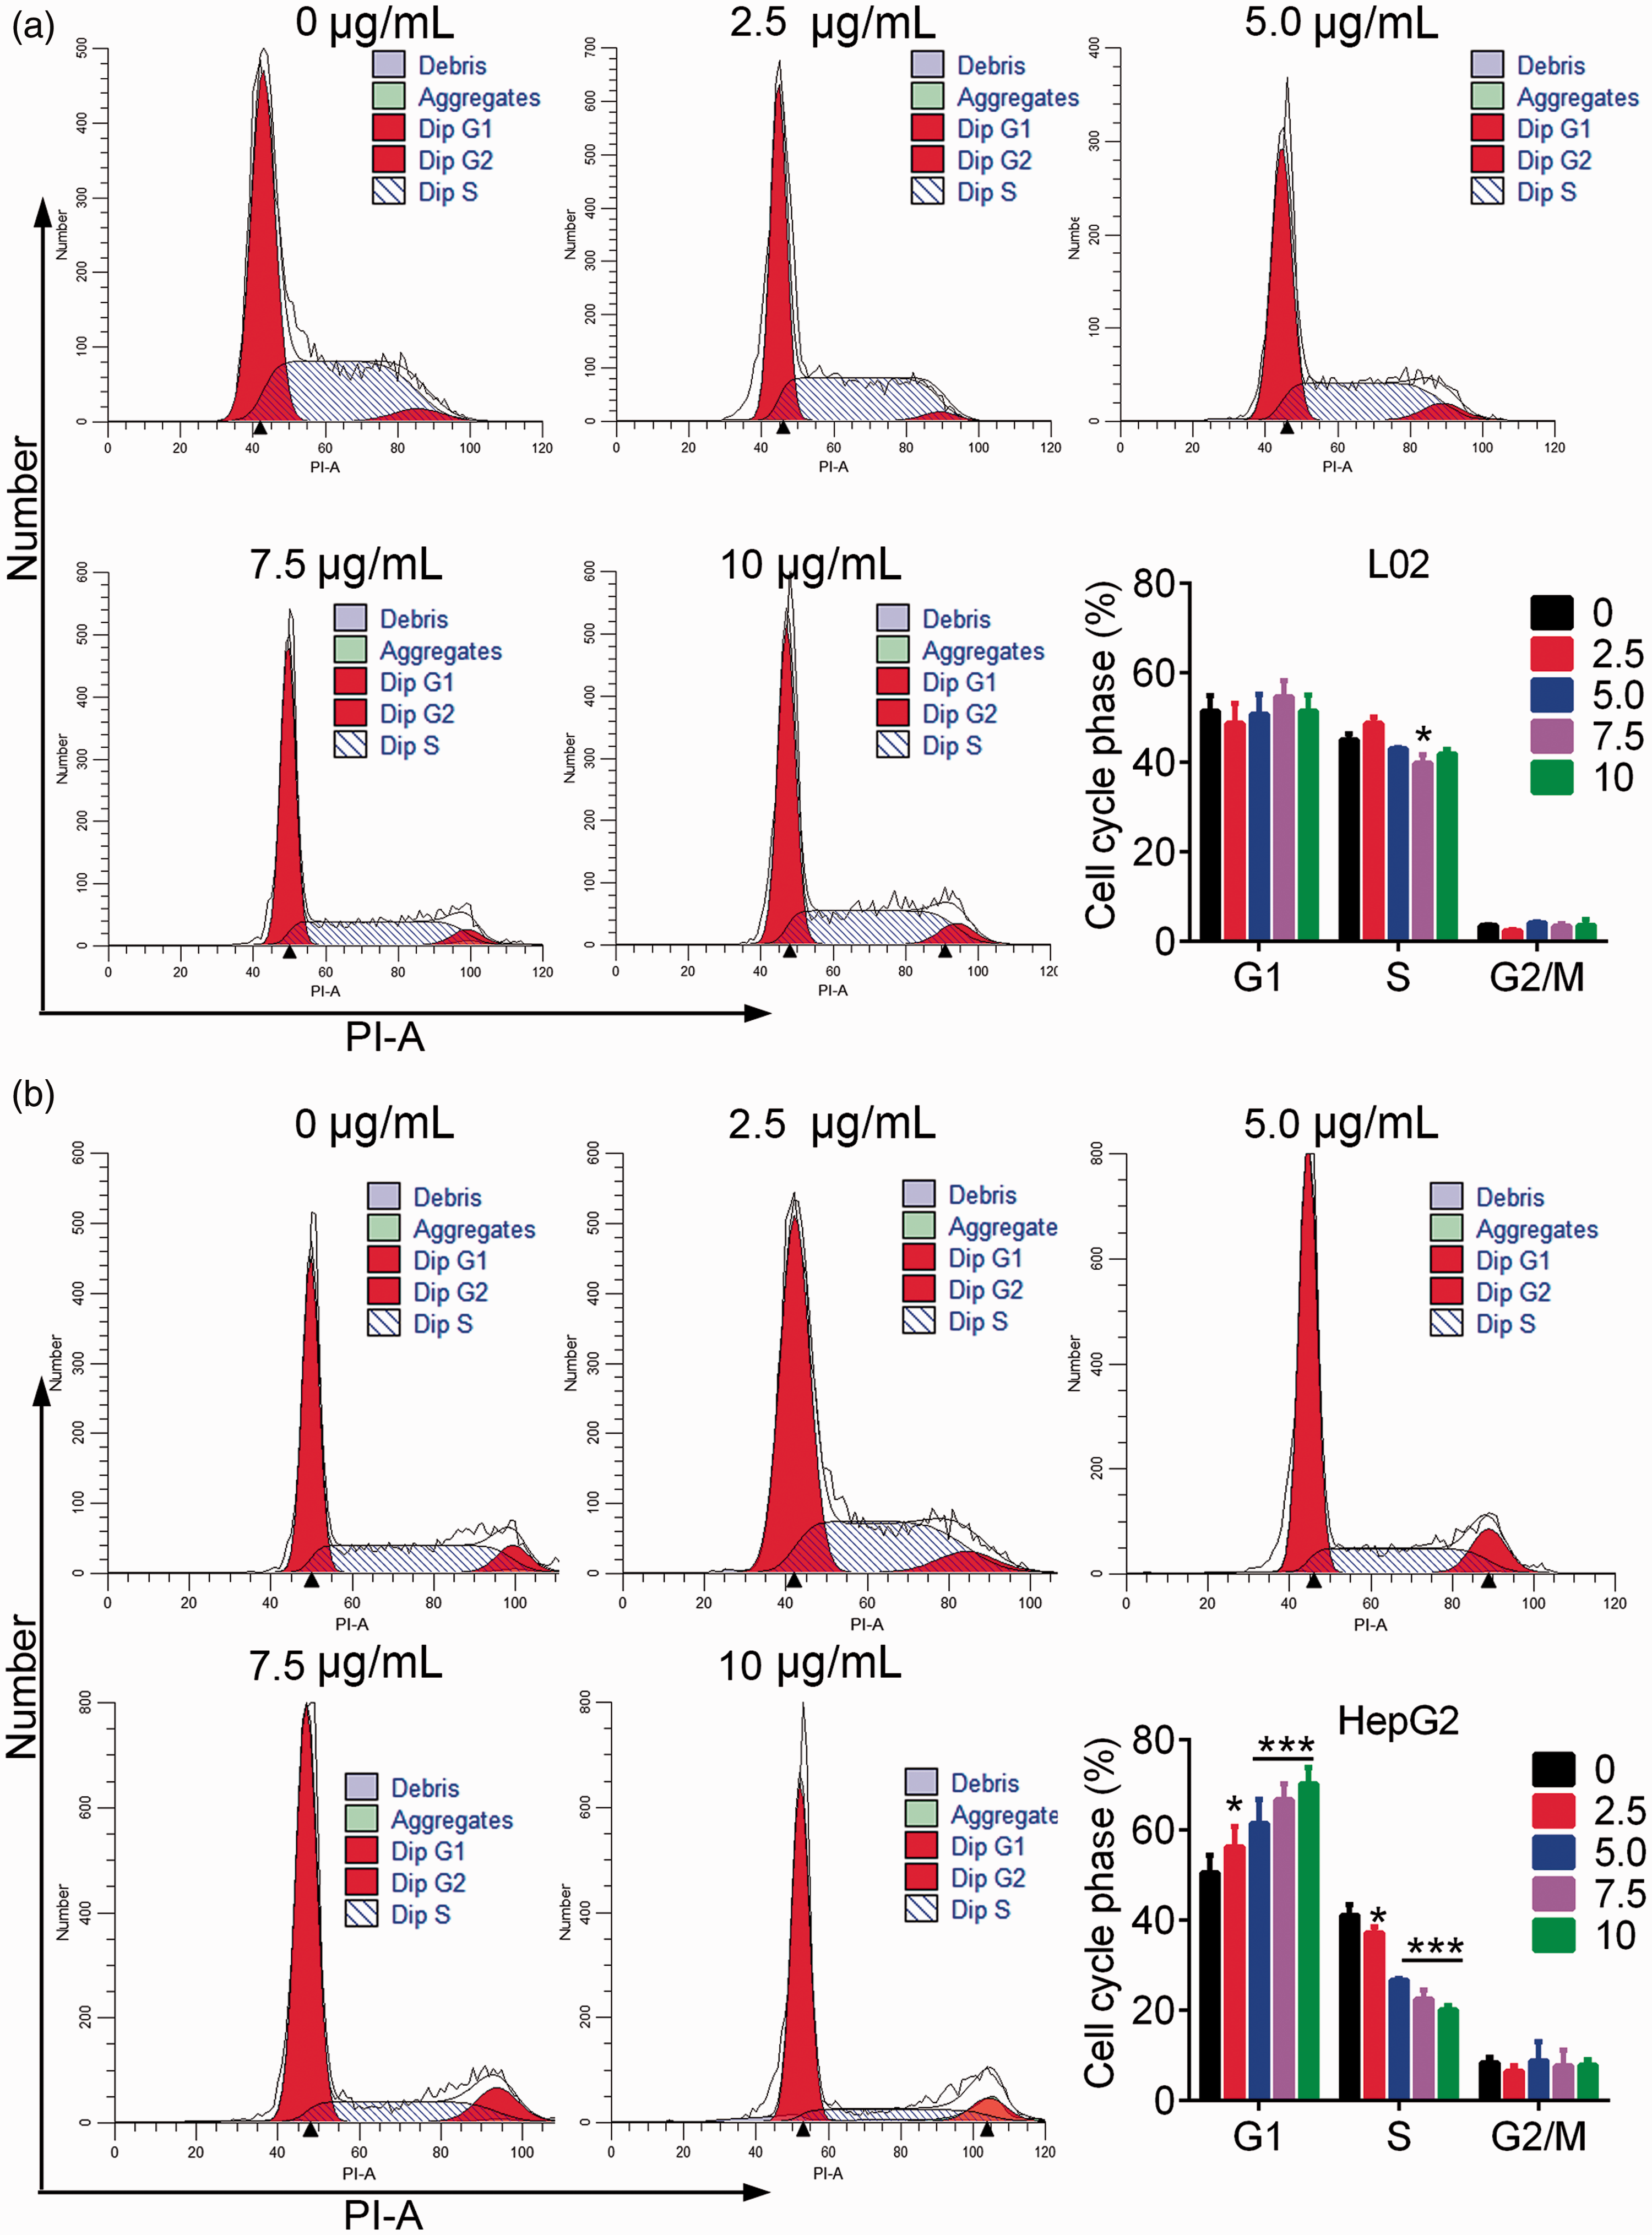
L02 (a) and HepG2 (b) cells were incubated in TiO2 for 48 hours and analyzed by flow cytometry with propidium iodide. TiO2 induced liver cancer cell cycle arrest in the G1 phase. Cells incubated with 0 µg/mL TiO2 were used as a control. *P < 0.05, **P < 0.01, and ***P < 0.001 vs. 0 µg/mL (control). PI-A, propidium iodide area; Dip, diploid.
TiO2 increased ROS accumulation in liver cancer cells
We investigated the effect of TiO2 on oxidative stress in liver cancer cells by measuring ROS levels by DCFDA flow cytometry. ROS levels in L02 cells were unaffected by TiO2 treatment, but ROS levels in liver cancer cells were significantly increased by TiO2 in a dose-dependent manner (P < 0.001) (Figure 4), indicating that TiO2 treatment enhanced oxidative stress in liver cancer cells.
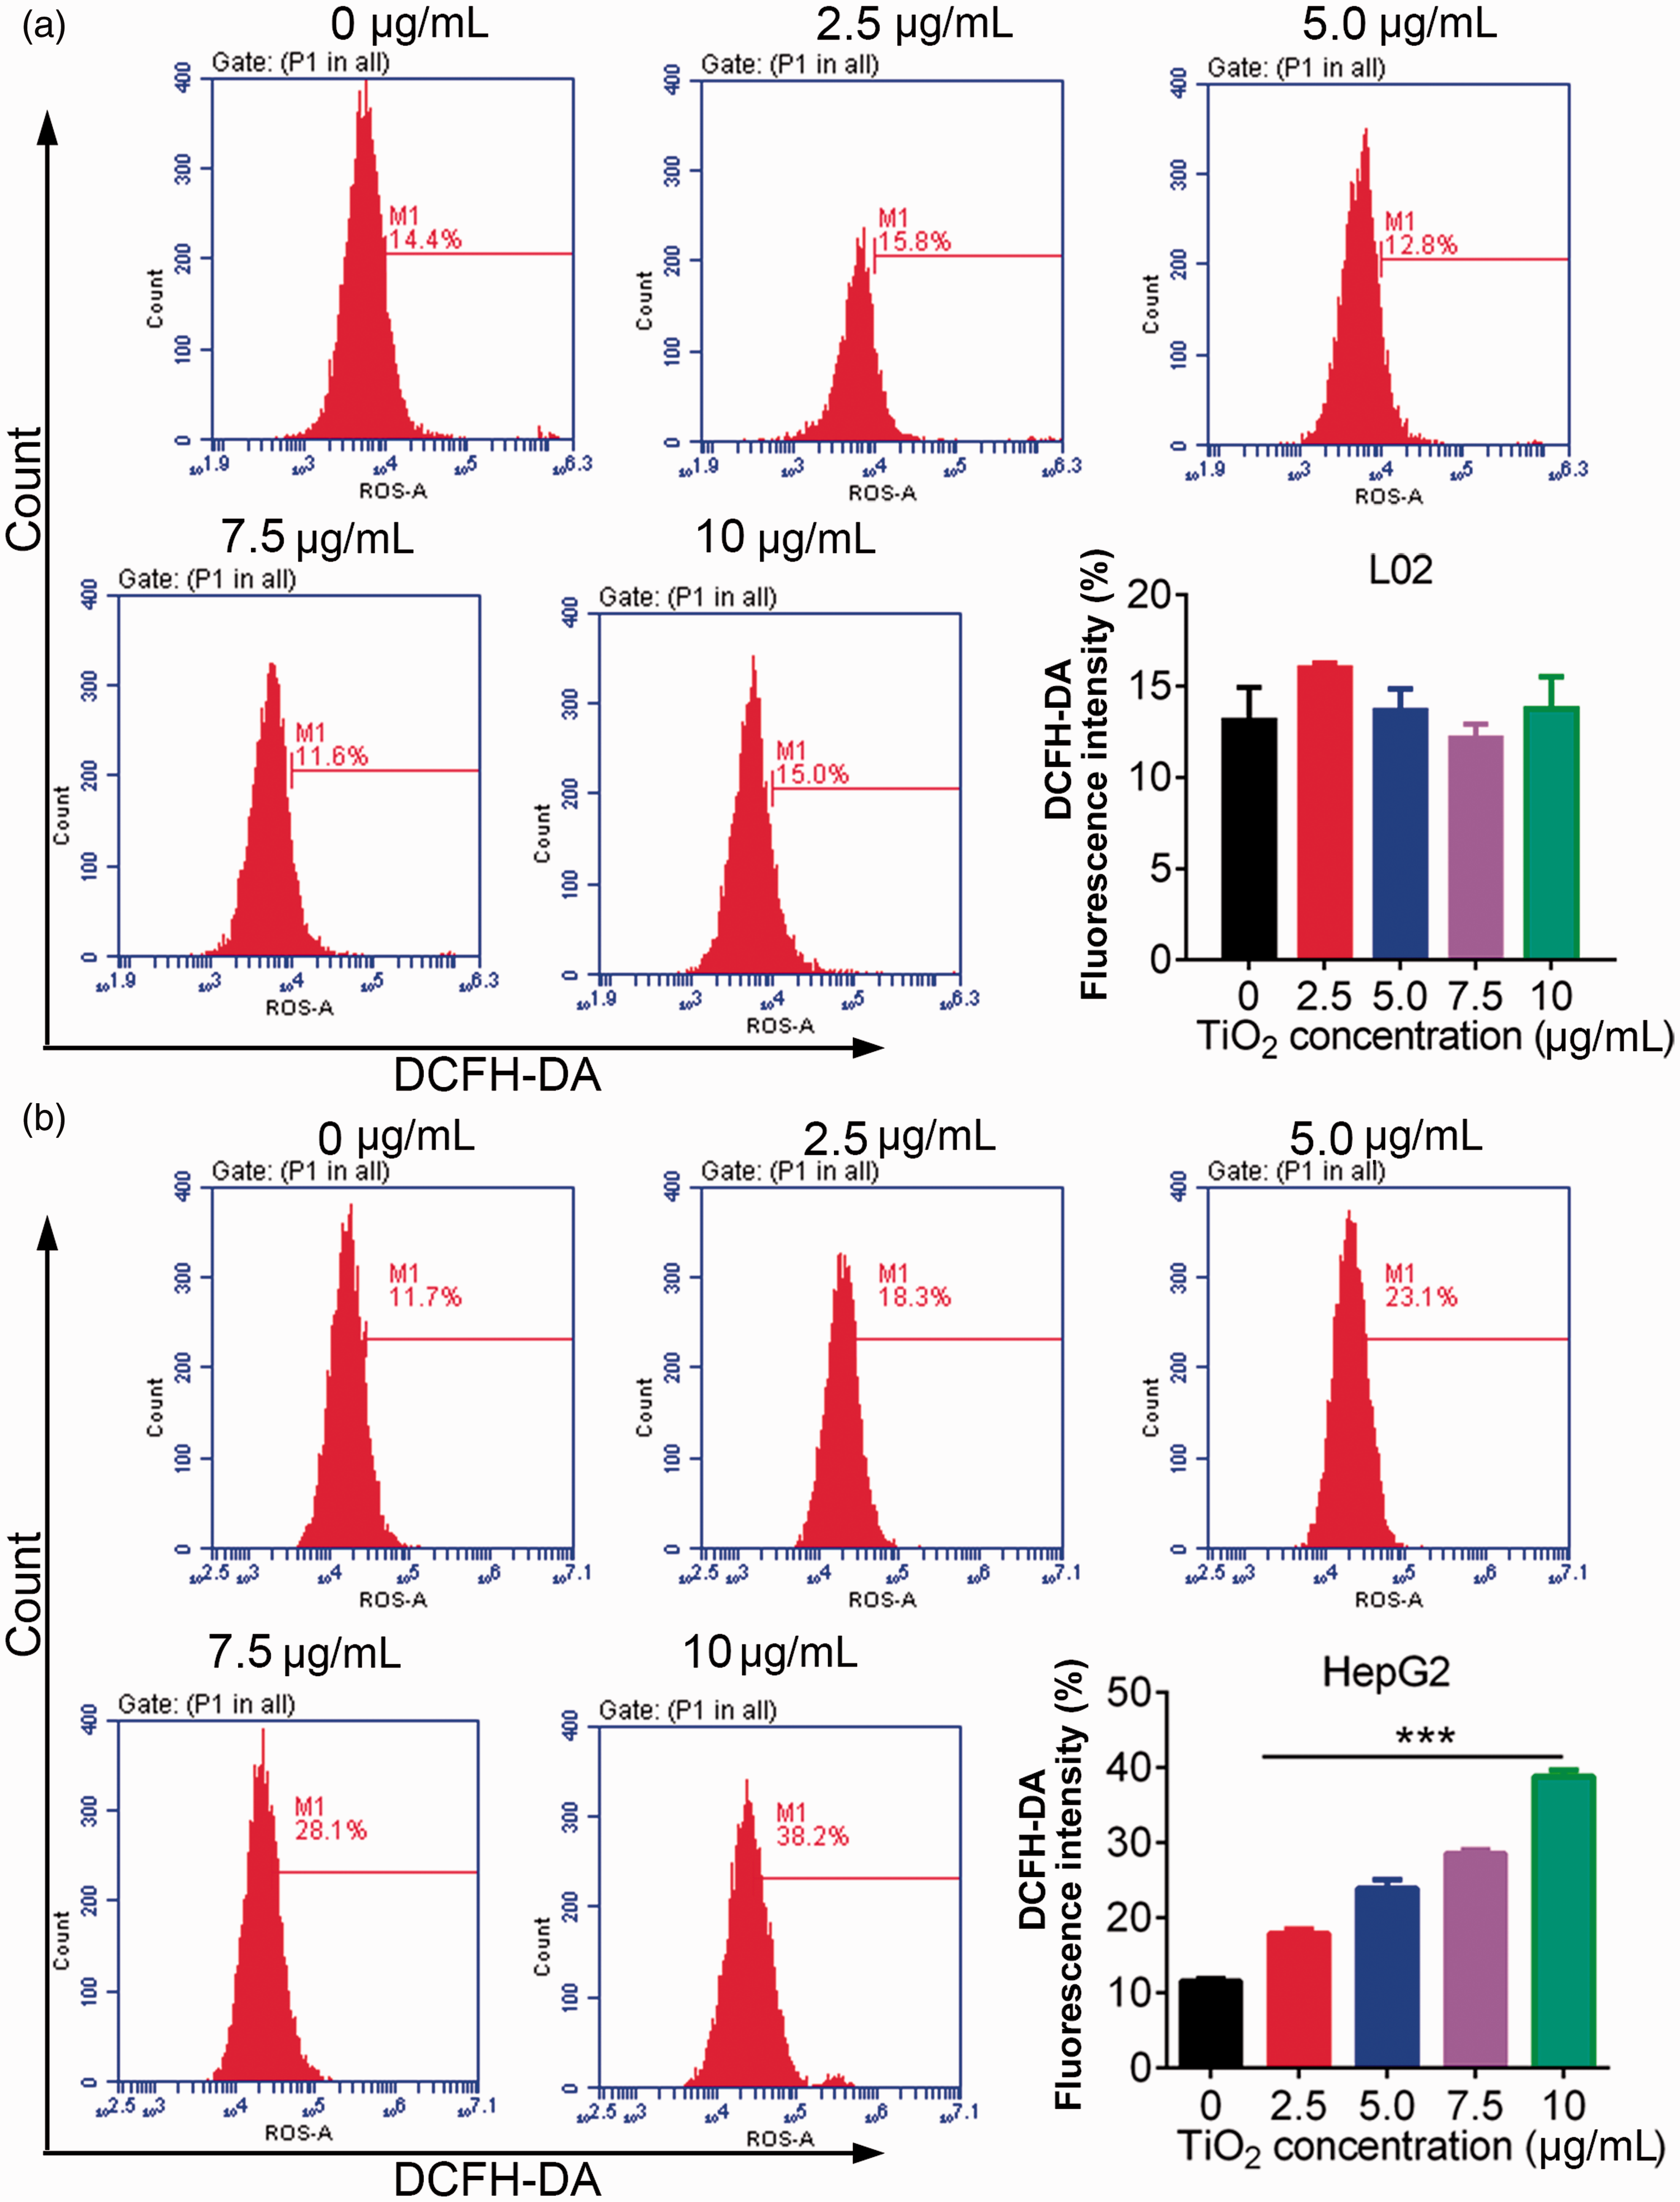
L02 (a) and HepG2 (b) cells were treated with 0, 2.5, 5.0, 7.5, and 10 µg/mL TiO2, and the cell cycle distribution was then examined by flow cytometry. TiO2 caused release of ROS in liver cancer cells. Cells incubated with 0 µg/mL TiO2 were used as a control. ***P < 0.001 vs. 0 µg/mL (control). DCFDA, 2’,7’-dichlorofluorescin diacetate.
TiO2 activated ER stress responses
ER stress-mediated apoptosis in cancer cells represents a pharmacological mechanism for cancer therapy.22,23 We determined if TiO2-mediated cell apoptosis in liver cancer cells was associated with ER stress by detecting the expression levels of the ER stress-related transducers/sensors ATF6 and PERK by western blotting. Expression levels of PERK and ATF6 in L02 cells were low and were unaffected by incubation with TiO2 nanoparticles for 48 hours (Figure 5a). In contrast, expression levels of PERK and ATF6 were significantly increased (P < 0.001) in HepG2 liver cancer cells in line with increasing TiO2 nanoparticle concentrations (Figure 5b). Bax protein expression levels were also increased by TiO2 treatment in a dose-dependent manner in HepG2 cells, but not in L02 cells. These data suggested that TiO2 nanoparticles activated the ER stress response in liver cancer cells but not in normal liver cells, and might thus contribute to the TiO2-mediated apoptosis of liver cancer cells.

Western blot analysis of cellular proteins. L02 (a) and HepG2 (b) cells were treated with 0, 2.5, 5.0, 7.5, and 10 µg/mL TiO2 nanotubes for 48 hours and ATF6 and PERK protein levels were then detected by western blot analysis. Cells treated with 0 µg/mL TiO2 were used as a control and glyceraldehyde 3-phosphate dehydrogenase was used as an internal reference. PERK, protein kinase RNA-like endoplasmic reticulum kinase; ATF6, activating transcription factor 6; GAPDH, glyceraldehyde 3-phosphate dehydrogenase.
TiO2 inhibited liver cancer tumorigenesis in vivo
Our in vitro experiments showed that TiO2 inhibited the growth and promoted the apoptosis of liver cancer cells. We therefore speculated that TiO2 might also inhibit the tumorigenesis or development of liver cancer in vivo. To verify this hypothesis, we inoculated nude BALB/C mice subcutaneously with HepG2 cells and treated them with or without TiO2 nanoparticles for 30 days. Tumor volumes were significantly smaller in mice treated with TiO2 nanoparticles (1 mg/mL) compared with control PBS-treated mice (5 weeks, P = 0.045; 6 weeks, P = 0.037; 7 weeks P = 0.035) (Figure 6a and 6b). Moreover, the percentages of PERK-, ATF6-, and Bax-positive cells in the tumor tissues were increased in mice treated with TiO2 (P = 0.031) (Figure 6c). Protein expression levels of ATF6, Bax, and PERK were also upregulated in TiO2-treated tumors according to western blot analysis (P = 0.008) (Figure 6d). These results confirmed that TiO2 also inhibited tumor growth in vivo by activating ER stress and inducing cell apoptosis.

Effects of TiO2 on tumors in BALB/C mice in vivo. (a) Liver cancer cells were injected subcutaneously into the right forelimbs of male BALB/C nude mice, followed by treatment with PBS or TiO2 nanotubes. (b) Tumor volumes. ATF6, PERK, and Bax protein expression levels in tumor tissues detected by immunohistochemistry (×400) (c) and western blot analysis (d). Mice treated with PBS were used as a control. Magnification, ×40; magnification of the inserted red-lined boxes in the panels, ×400. PBS, phosphate-buffered saline; ATF6, activating transcription factor 6; PERK, protein kinase RNA-like endoplasmic reticulum kinase; GAPDH, glyceraldehyde 3-phosphate dehydrogenase; w, weeks.
Discussion
The biocompatibility and favorable mechanical properties of TiO2 have supported its wide clinical application.8,9 Increasing evidence has shown that TiO2-mediated toxicity induced apoptotic death in cancer cells.9,12 In the current study, TiO2 treatment increased apoptosis in liver cancer cells but not normal liver cells, suggesting the safety of TiO2 treatment.
We carried out cell cycle analysis to clarify the mechanism by which TiO2 promoted apoptosis. Cell cycle arrest is closely associated with cell growth retardation and apoptosis. 24 Tumor cells may only be sensitive to certain drugs at specific stages of the cell cycle, and modulating the cell cycle pharmacologically may thus increase the efficacy of regular chemotherapy. The cell cycle can be divided into G1, S, and G2/M phases. In the current study, TiO2 treatment increased the percentage of G1 phase liver cancer cells and decreased the percentages of S and G2/M phase cells, suggesting that the synthesis of RNA and ribosomes were blocked, thus preventing the cells from entering the next stage of the cell cycle and leading to increased apoptosis.
Ultraviolet-A irradiation-stimulated photocytotoxicity of TiO2 is mediated by the generation of ROS and oxidative stress in the target tissues or cells.12,13 ER stress is associated with increasing ROS, 25 and prolonged high levels of ROS induce irreversible damage to proteins and lead to misfolded and unfolded polypeptides in the ER, 26 resulting in reduced production of ribosomes and RNA and G1 phase cell cycle arrest. 14 ER stress is characterized by the activation of several ER sensors, including PERK and ATF6. 27 In the present study, we demonstrated that PERK and ATF6 were upregulated and ROS levels were increased in TiO2-treated liver cancer cells, suggesting that TiO2 promoted ER stress-mediated apoptosis of liver cancer cells.
The ER sensors and their downstream signaling pathways play important roles in regulating cancer cell apoptosis. 28 ER stress can cause PERK and ATF6 to dissociate from GRP78, thus activating the PERK and ATF pathways. 29 Both PERK and ATF6 pathways can mediate CHOP expression and induce apoptosis. 30 Previous studies showed that the PERK/eIF2α/ATF4/CHOP signaling pathway played crucial roles in ROS–ER stress-induced apoptosis.18,31,32 PERK/eIF2a signaling pathway-mediated apoptosis has also been reported in hypoxia-cultured cardiomyocytes,32,33 smoke extract-cultured human bronchial epithelial cells, 34 and in hepatocytes from rats with alcoholic liver injury. 18 Knockdown of CHOP decreased wogonin (V8)-mediated apoptosis and the activation of multiple ER stress markers in liver cancer cells. 19 ATF4 and GRP78 expression levels are mediated by cleavage of caspases 3, 7, and 12,35,36 and ATF6 and GRP78 activation have been observed in hepatocellular carcinoma. 37 During ER stress-mediated apoptosis, ATF6 increased the production of CHOP and GRP78, ultimately leading to activation of the caspase cascade to execute ER stress-induced glioma cell apoptosis. 20 These findings demonstrated that PERK and ATF6 activation were critical for cancer cell apoptosis. Our data accordingly showed that TiO2-induced ROS production was accompanied by increased Bax expression (as a Bcl-2 family apoptosis promoter), indicating the role of the PERK/ATF/Bax/caspase axis in TiO2-induced apoptosis in liver cancer cells.
TiO2 has been reported to increase the sensitivity of cancer cells (MCF-7 and MKN-45) to radiation by increasing ROS production. 38 Enhanced radiosensitivity of cancer cells by nanoparticles (nanocores) has also been reported in vitro.39,40 The PERK/eIF2a pathway was shown to confer radioresistance in oropharyngeal and hepatocellular carcinoma by modulating the ER stress response.41,42 Chen et al. 41 suggested that knockdown of GRP78 or ATF6 by small interfering RNA enhanced cisplatin-induced apoptosis. Furthermore, Qiao et al. 42 showed that overexpression of PERK was correlated with a poor prognosis in patients with oropharyngeal carcinoma, and that PERK silencing increased the radiosensitivity by increasing radiation-induced apoptosis in oropharyngeal carcinoma cells. Cancer cell radioresistance conferred by the PERK/eIF2a pathway might provide an interesting insight into TiO2-mediated radiosensitivity and cancer cell apoptosis.
The present study confirmed that TiO2 enhanced ER stress and increased apoptosis in liver cancer cells, but had no obvious effect in L02 cells. These differences might be due to the differential expression patterns of stress-response genes and the metabolic changes in cancer cells compared with normal cells. 43 TiO2 had a significant toxic effect in human breast cancer SKBR3 cells but not in human embryonic kidney HEK293 cells. 44 However, high concentrations of TiO2 nanoparticles were shown to induce serious cytotoxicity in some normal cells.44,45 Kim et al. 45 showed that the IC50 value of TiO2 nanoparticles in a normal cell line (L-132) was markedly higher than that in A549 lung cancer cells, demonstrating dose-dependent nanocytotoxicity between normal and cancer cells. This was in accordance with our current results, which showed obvious toxicity of TiO2 in liver cancer cells but not in L02 cells. TiO2 thus promoted cell growth inhibition and apoptosis in liver cancer cells both in vitro and in vivo. However, further experiments are needed to explore the mechanisms underlying TiO2-mediated toxicity and radiosensitivity in liver cancer cells, and to determine the optimal concentrations of TiO2 nanoparticles in liver cancer cells and tumor-bearing mice.
In conclusion, we demonstrated that TiO2 could induce cytotoxicity in liver cancer cells, with no obvious adverse effects in normal liver cells. Mechanistically, TiO2 increased ROS production and thus triggered the ER stress-related PERK/ATF6/Bax signaling pathway in liver cancer cells.