
Abstract
Cellular senescence is a process of physiological growth arrest that can be induced by intrinsic or extrinsic stress signals. Some cancer therapies are associated with senescence of cancer cells with a typical cell cycle arrest. Doxorubicin (Dox) induces senescence by a p53-dependent pathway and telomere dysfunction of numerous cancers. However, cellular senescence induces suppression in proliferation activity, and these cells will remain metabolically active and play an important role in tumor relapse and development of drug resistance. In the current study, we investigated the apoptotic effect of curcumin (Cur), caffeine (Caff), and thymoquinone (TQ) on senescent colon cancer HCT116 and breast cancer MCF7 cell lines treated with Dox. Results showed typical senescence markers including decreased bromodeoxyuridine incorporation, increased accumulation of senescence-associated β-galactosidase (SA-β-gal), cell cycle arrest, and upregulation of p53, P-p53, and p21 proteins. Annexin-V analysis by flow cytometry revealed 2- to 6-fold increases in annexin-V–positive cells in Dox-treated MCF7 and HCT116 cells by Cur (15 µM), Caff (10 mM), and TQ (50 µM; P < .001). In comparison between proliferative and senescent of either HCT116 or MCF7 cells, Caff at 15 mM and TQ at 25 µM induced significant increases in apoptosis of Dox-treated cells compared with proliferative cells (P < .001). Data revealed that Cur, Caff, and TQ potentially induced apoptosis of both proliferative and senescent HCT116 and MCF7 cells. In vivo and clinical trials are of great importance to validate this result.
Introduction
Cell senescence is accompanied by irreversible arrest of cell cycle by inducing shortening of telomere. 1 Senescence may also occur in response to oxidative stress, DNA damage, or activation of oncogenes. 2 Senescence-associated β-galactosidase (SA-β-gal)–positive cells are recognized in tumor sections subjected to either radiotherapy or chemotherapy, and it can be used as a marker for recurrence. 3 Senescent cells most likely encourage aging through inflammatory cytokines, chemokines, growth factors, and proteases.4,5 Also, they are involved in the phosphorylation of p53 followed by expression of p21 that leads to cell cycle arrest. 6 Many chemotherapeutic drugs such as doxorubicin (Dox) alter cellular states of cancer cells including senescence induction.7,8 Dox is a chemotherapeutic that is regularly used for the treatment of breast, esophageal, liver, and other cancers because it induces cell growth arrest with senescent markers. 9
Along with great advances in chemotherapeutic agents, medicinal plants are still used for the treatment of different diseases. Humans’ use of medicinal plants dates back more than 60 000 years.10,11 In newer studies, scientists focused on identifying the active ingredients that are responsible for plants’ properties with the hope of using the information for new drug discoveries. The medicinal plants that scavenge reactive oxygen species and maintain the intracellular antioxidant catalase, glutathione peroxidase, and superoxide dismutase enzymes are of pivotal importance in cancer prevention and treatment. 12 An example is curcumin (diferuloylmethane; Cur), a polyphenol derivative extracted from the Curcuma longa (turmeric). Cur has a variety of therapeutic properties including antioxidant, anti-inflammatory, and anticancer activities.13,14 Therefore, it has been recognized as a useful therapy for melanoma, head and neck, prostate, colon, pancreatic, breast, and ovarian cancers. 15 Numerous studies have shown that Cur induced its anticancer effect mainly through inhibition of nuclear factor-κB (NF-κB). 16 Also, Cur induced upregulations of some cellular proapoptotic molecules along with inhibition of many antiapoptotic molecules as cited in the comprehensive review article of Panda et al. 17
Another natural anticancer compound from a plant source is caffeine (Caff). Caff inhibits a variety of protein kinases including ataxia-telangiectasia–mutated (ATM)/Rad3-related (ATR) kinases. Caff induces its anticancer potential through DNA damage, cell cycle arrest, and apoptosis of many cancer cells. 18 Therefore, consumption of coffee, tea, and other soft drinks that contain Caff is known to lower certain cancer risks. 19 Also, Caff can fight cancer cells by targeting phosphatidylinositol 3-kinase (PI3K). 20
Nigella sativa, an herb that grows in different regions of the world, contains many promising anticancer ingredients such as thymoquinone (TQ). 21 TQ exhibited antioxidant, anti-inflammatory, and anti-aging activities in addition to its anticancer potential.22,23 TQ is an important anticancer drug used either alone or in combination with conventional anticancer agents. 24 TQ has been effectively used to induce apoptosis of colon, uterine sarcoma, breast, and pancreatic cancers. 25 The possible mechanisms of TQ anticancer activity against various proliferative cancer cells were summarized in the review article by El-Far. 26
Cancer is a leading cause of death worldwide, accounting for an estimated 9.6 million deaths in 2018 as reported by the World Health Organization. Breast cancer caused about 2.09 million deaths in 2018, while colorectal cancer led to 1.80 million deaths. 27 In this article, we demonstrate that senescent cancer cells are susceptible to selective clearance using natural compounds. The present study aimed to convert cancer cells to the corresponding senescent cells and investigate the apoptotic effects of Cur, Caff, and TQ against proliferative versus Dox-induced senescent HCT116 and senescent MCF7 cells. This can raise new approaches to develop clinically relevant natural molecules that selectively eliminate cancer.
Materials and Methods
Cell Lines and Treatment
Human colon HCT116 and breast cancer MCF7 cell lines were purchased from ATCC (LGC Standards, Lomianki, Poland). HCT116 were grown in McCoy’s 5A medium, and MCF7 cells were grown in low-glucose Dulbecco’s Modified Eagle Medium. Both media were supplemented with 10% fetal bovine serum and protected with penicillin/streptomycin solution.
Cells were seeded at a density of 104/cm2 for 24 hours and then treated with 0.1 µM Dox (Sigma-Aldrich, Poznan, Poland) for 5 consecutive days of treatment to induce senescence of HCT116 and MCF7 cells, after which the senescent cells were treated with different doses of Cur, Caff, or TQ.
Bromodeoxyuridine Labeling Assay
The amount of DNA in the senescent cells was quantified with bromodeoxyuridine (BrdU; Sigma-Aldrich) incorporation assay. BrdU was added to the medium in a total concentration of 10 µM for 24 hours after the addition of Dox (day 1), and the experiment was observed for 5 continuous days, such that the fifth day after BrdU addition is day 6 of Dox treatment. For BrdU detection, fixation with 70% ethanol/−20°C for 24 hours was done, and then the cells were incubated with BrdU primary antibody (Becton Dickinson, San Jose, CA) and secondary Alexa 488–conjugated IgG antibody (Becton Dickinson). BrdU signals were observed at 450 to 490 nm excitation wavelength under a fluorescence microscope (Nikon, Tokyo, Japan) on day 0 (control), and days 2, 4, and 6 of Dox treatment.
Detection of Senescence-Associated β-Galactosidase
The extents of SA-β-gal in Dox-treated HCT116 and MCF7 cells for 5 days were determined according to the method of Dimri et al. 28 Cells were examined using a fluorescence microscope (Nikon, Melville, NY).
DNA Content and Cell Cycle Analysis
Using a FACSCalibur flow cytometer (Becton Dickinson), the cell cycle states were analyzed in Dox-treated HCT116 and Dox-treated MCF7 cells. 29
Western Blot Analysis
Whole-cell protein extracts of Dox-treated HCT116 and Dox-treated MCF7 cells were prepared following the steps in the study of Sliwinska et al, 29 after loading onto a 10% SDS-polyacrylamide gel and electroblotted to a PVDF membrane. Blocked membranes were incubated sequentially with the monoclonal antibodies to detect the tested proteins including anti-p53 (DO-1) and anti-p21Cip1 (C-19; Santa Cruz, Dallas, TX), anti-p-p53 (Ser15; Cell Signaling, Lab-JOT Ltd, Warsaw, Poland), and anti-GAPDH (Millipore, Merck, Warsaw, Poland). The tested proteins were visualized using appropriate secondary antibodies and ECL reagents (Thermo Scientific Co, San Diego, CA).
MTT Assay (3-[4,5-Dimethylthiazol-2-yl]-2,5-Diphenyltetrazolium Bromide)
The half maximal inhibitory concentration (IC50) of Cur, Caff, and TQ were determined by seeding approximately 3 × 10⁴ per well of HCT116 or MCF7 cells in 12-well polystyrene-coated plates and incubated for 24 hours at 37°C in a 5% CO2 incubator. Cells were then treated with Dox (0.1 µM), and at the fifth day of treatment, the medium containing Dox was removed and the cells were washed with phosphate-buffered saline (PBS). Then PBS was aspirated, and the cells were treated with different concentrations of Cur (0, 5, 15, 30, 60, 90, and 180 µM dissolved in dimethyl sulfoxide [DMSO]) or Caff (0, 5, 10, 15, 20, 30, 40, 50, and 60 mM dissolved in PBS), and TQ (0, 5, 10, 25, 50, 60, 75, and 100 µM dissolved in DMSO). After 24 hours of incubation, MTT reagent was added to each well (1.25 mg/mL), and plates were incubated for 2 hours. Formazan crystals formed after 2 hours in each well were dissolved in 1 mL DMSO, and the optical density was determined immediately at 570 nm using a microplate reader. All the reactions were performed in triplicate. Measured data of cellular viability were normalized using viability values of untreated control cells (100%).
Apoptosis Detection Assay
Phycoerythrin annexin-V Apoptosis Detection Kit I (Becton Dickinson) was used to determine the apoptotic potential of tested drugs. Both proliferative and senescent HCT116 and MCF7 cells were treated with Cur (0, 5, 15, and 30 µM), Caff (0, 5, 10, and 15 mM), or TQ (0, 5, 10, 25, 50, and 75 µM) for 24 hours. The assay was done following the manufacturer’s instructions. The percentages of annexin-V–positive cells were determined with FACSCalibur with CellQuest analysis software (Becton Dickinson).
Statistical Analysis
Statistical analysis was performed using 2-tailed Student’s t-test, analysis of variance (ANOVA). Annexin-V data were analyzed using 2-way ANOVA followed by Bonferroni posttest. Percentages of BrdU-positive and SA-β-gal–positive cells were analyzed with 1-way ANOVA followed by Tukey’s multiple comparison test. The IC50 values were determined with nonlinear regression according to the following equation: log (inhibitor) versus response-variable slope. Data are presented as a mean ± SD. A value of P < .05 was considered statistically significant. All data show the mean results from at least 3 independent experiments.
Results
Senescence Markers of Dox-Treated Cells
Results illustrated in Figure 1A and B explore the sharp decrease in BrdU incorporation in Dox-treated HCT116 with time until day 6 in comparison with Dox 0 (control untreated HCT116 cells). At day 2, the cells became larger and granular. Later, most cells became much larger due to polyploidization of Dox-treated HCT116 as evidenced by cell cycle analysis where polyploidization started at day 2 and increased in a time-dependent manner (Figure 1E).

Senescence markers of Dox-treated HCT116 cells. Day 0 means untreated cells. (A) BrdU incorporation test for senescent HCT116 cells. Magnification 200×. BrdU signals were observed at 450 to 490 nm excitation wavelength. DAPI signals were observed at 360 nm excitation wavelength. Cells were treated with Dox for 6 days. Scale bar is 50 µm. (B) Percentages of BrdU-positive cells on day 0, and on days 2, 4, and 6 of Dox treatment. (C) SA-β-gal–positive cells of Dox-treated HCT116 cells. Day 0, and days 1 and 5 of Dox treatment. Scale bar is 50 µm. (D) Percentages of SA-β-gal–positive cells on day 0, and days 1 and 5 of Dox treatment. (E) DNA content of cells stained with PI revealed by flow cytometry of Dox-treated HCT116 cells. (F, G, H, and I) Expression of p53, P-p53 (Ser15), and p21 in Dox-treated HCT116 cells. Lanes, from left to right, represent consecutive days of experiment, as indicated. The data were analyzed with 1-way ANOVA followed by Tukey’s multiple comparison test. Data of cell cycle analysis were analyzed with 2-tailed Student’s t-test, ANOVA. Error bars represent mean ± SD. *P < .05, **P < .01, and ***P < .001 versus day 0 (control). ++P < .01 and +++P < .001 versus Dox 1 (SA-β-gal and western blot) and Dox 2 (BrdU). XP < .05 and XXXP < .001 versus Dox 2 in western blot and Dox 4 in BrdU.
SA-β-gal–positive cells began to form on day 1 and increased gradually and became denser on day 5 due to gradual accumulation of SA-β-gal in response to Dox (Figure 1C and D). Cell cycle arrest of Dox-treated HCT116 was detected by a significant (P < .01) decrease in S phase at days 1, 2, 4, and 5 compared with day 0 (Figure 1E). Concomitantly, the percentages of cells in G2/M phase increased and showed polyploidization with time as represented by the gradual increase.
The molecular markers of senescence, p53, P-p53 (Ser15), and p21 were analyzed with western blotting assay and showed increases on days 1, 2, and 4 in comparison with day 0 of Dox-untreated cells (Figure 1F). In addition, P-p53 (Ser15) and p21 proteins have no bands on day 0, which indicated that the cell cycle arrest depends on p53 pathway via p21.
The same senescence marker results were obtained in Dox-treated MCF7 (Figure 2A-F). BrdU incorporation started to decrease from day 1 after Dox treatment then decreased in a time-dependent manner, while SA-β-gal–positive cells increased. Also, cell cycle was arrested and the p53, P-p53 (Ser15), and p21 proteins were increased in Dox-treated MCF7 in comparison to day 0, while P-p53 (Ser15) and p21 were not detected.

Senescence markers of Dox-treated MCF7 cells. Day 0 means untreated cells. (A) BrdU incorporation test for senescent MCF7 cells. Magnification 200×. BrdU signals were observed at 450 to 490 nm excitation wavelength. DAPI signals were observed at 360 nm excitation wavelength. Cells were treated with Dox for 6 days. Scale bar is 50 µm. (B) Percentages of BrdU-positive cells on day 0, and on days 2, 4, and 6 of Dox treatment. (C) SA-β-gal–positive cells of Dox-treated MCF7 cells. Scale bar is 50 µm. (D) Percentages of SA-β-gal–positive cells on day 0, and on days 1 and 5 of Dox treatment. (E) DNA content of cells stained with PI revealed by flow cytometry of Dox-treated MCF7 cells. (F, G, H, and I) Expression of p53, P-p53 (Ser15), and p21 in Dox-treated MCF7 cells. Lanes, from left to right, represent consecutive days of experiment, as indicated. The data were analyzed with 1-way ANOVA followed by Tukey’s multiple comparison test. Data of cell cycle analysis were analyzed with 2-tailed Student’s t-test, ANOVA. Error bars represent mean ± SD. **P < .01 and ***P < .001 versus day 0 (control). +P < .05, ++P < .01, and +++P < .001 versus Dox 1 (SA-β-gal and western blot) and Dox 2 (BrdU). XP < .05 versus Dox 2 in western blot and Dox 4 in BrdU.
IC50 of Curcumin, Caffeine, and Thymoquinone
The effects of Cur (Figure 3A), Caff (Figure 3D), and TQ (Figure 3G) on the viability of Dox-treated HCT116 and Dox-treated MCF7 cells were determined using the MTT assay to detect the IC50 of each drug toward each cell type. Cellular proliferation of Dox-treated HCT116 and Dox-treated MCF7 cells following 24 hours of exposure to treatments showed significant inhibition in treated cells compared with Dox-treated control cells. The IC50 of Cur against Dox-treated HCT116 cells is 35.10 ± 2.68 µM and 42.59 ± 2.31 µM in Dox-treated MCF7 cells (Figure 3B and C). The IC50 of Caff against Dox-treated HCT116 cells is 13.36 ± 2.29 mM and 17.67 ± 3.98 mM in Dox-treated MCF7 (Figure 3E and F). The IC50 of TQ against Dox-treated HCT116 cells is 66.75 ± 2.00 µM and 39.37 ± 5.35 µM in Dox-treated MCF7 cells (Figure 3H and I).

Structural formula of (A) curcumin (Cur), (D) caffeine (Caff), and (G) thymoquinone (TQ). IC50 values of (B, E, and H) Dox-treated HCT116 and (C, F, and I) Dox-treated MCF7 cells against Cur, Caff, and TQ. The IC50 values were determined using nonlinear regression according to the following equation: log (inhibitor) versus response-variable slope. Error bars represent mean ± SD.
Curcumin, Caffeine, and Thymoquinone Induce Apoptosis in Dox-Treated Cells
Table 1 summarizes the apoptotic effect of Cur, Caff, and TQ depending on annexin-V expression. Cur at concentrations of 30 µM induced significant increases (5- to 10-fold) in apoptosis of proliferative and senescent HCT116 and MCF7 cells (P < .001) compared with their corresponding untreated controls. Cur at a concentration of 15 µM had a significant increase in apoptosis (~4-fold; P < .001) for Dox-treated HCT116 compared with Cur-untreated proliferative HCT116 that is shown by the sensitivity of Dox-treated HCT116 cells. Also, Cur (5 µM) significantly increased apoptosis of Dox-treated HCT116 cells (Figure 4A and B).
The Apoptotic Potential of Curcumin (Cur), Caffeine (Caff), and Thymoquinone (TQ).
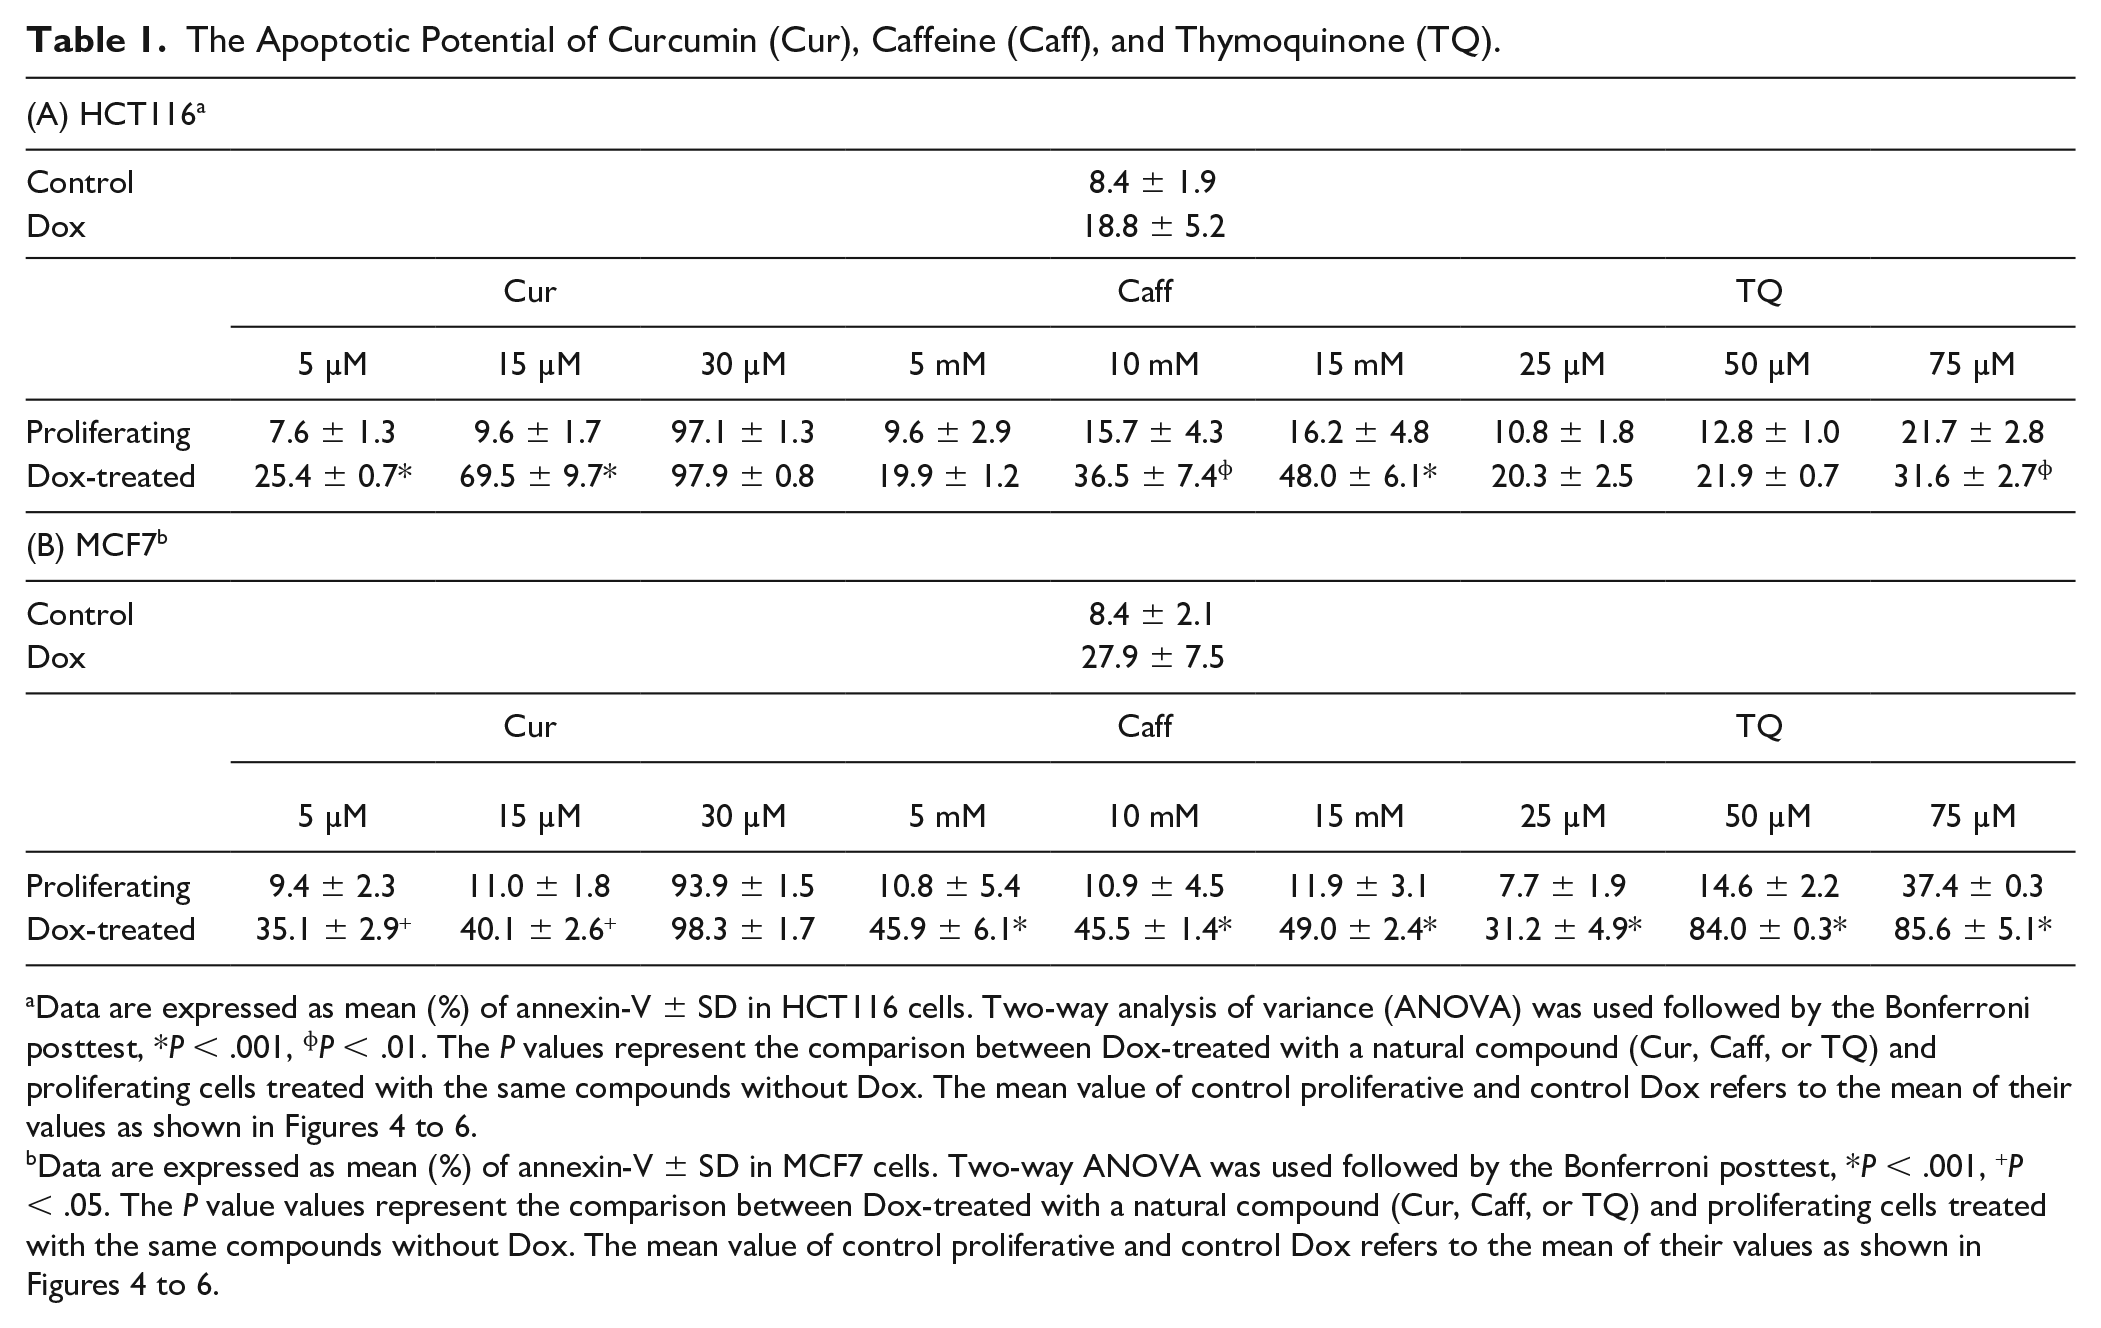
Data are expressed as mean (%) of annexin-V ± SD in HCT116 cells. Two-way analysis of variance (ANOVA) was used followed by the Bonferroni posttest, *P < .001, ɸP < .01. The P values represent the comparison between Dox-treated with a natural compound (Cur, Caff, or TQ) and proliferating cells treated with the same compounds without Dox. The mean value of control proliferative and control Dox refers to the mean of their values as shown in Figures 4 to 6.
Data are expressed as mean (%) of annexin-V ± SD in MCF7 cells. Two-way ANOVA was used followed by the Bonferroni posttest, *P < .001, +P < .05. The P value values represent the comparison between Dox-treated with a natural compound (Cur, Caff, or TQ) and proliferating cells treated with the same compounds without Dox. The mean value of control proliferative and control Dox refers to the mean of their values as shown in Figures 4 to 6.
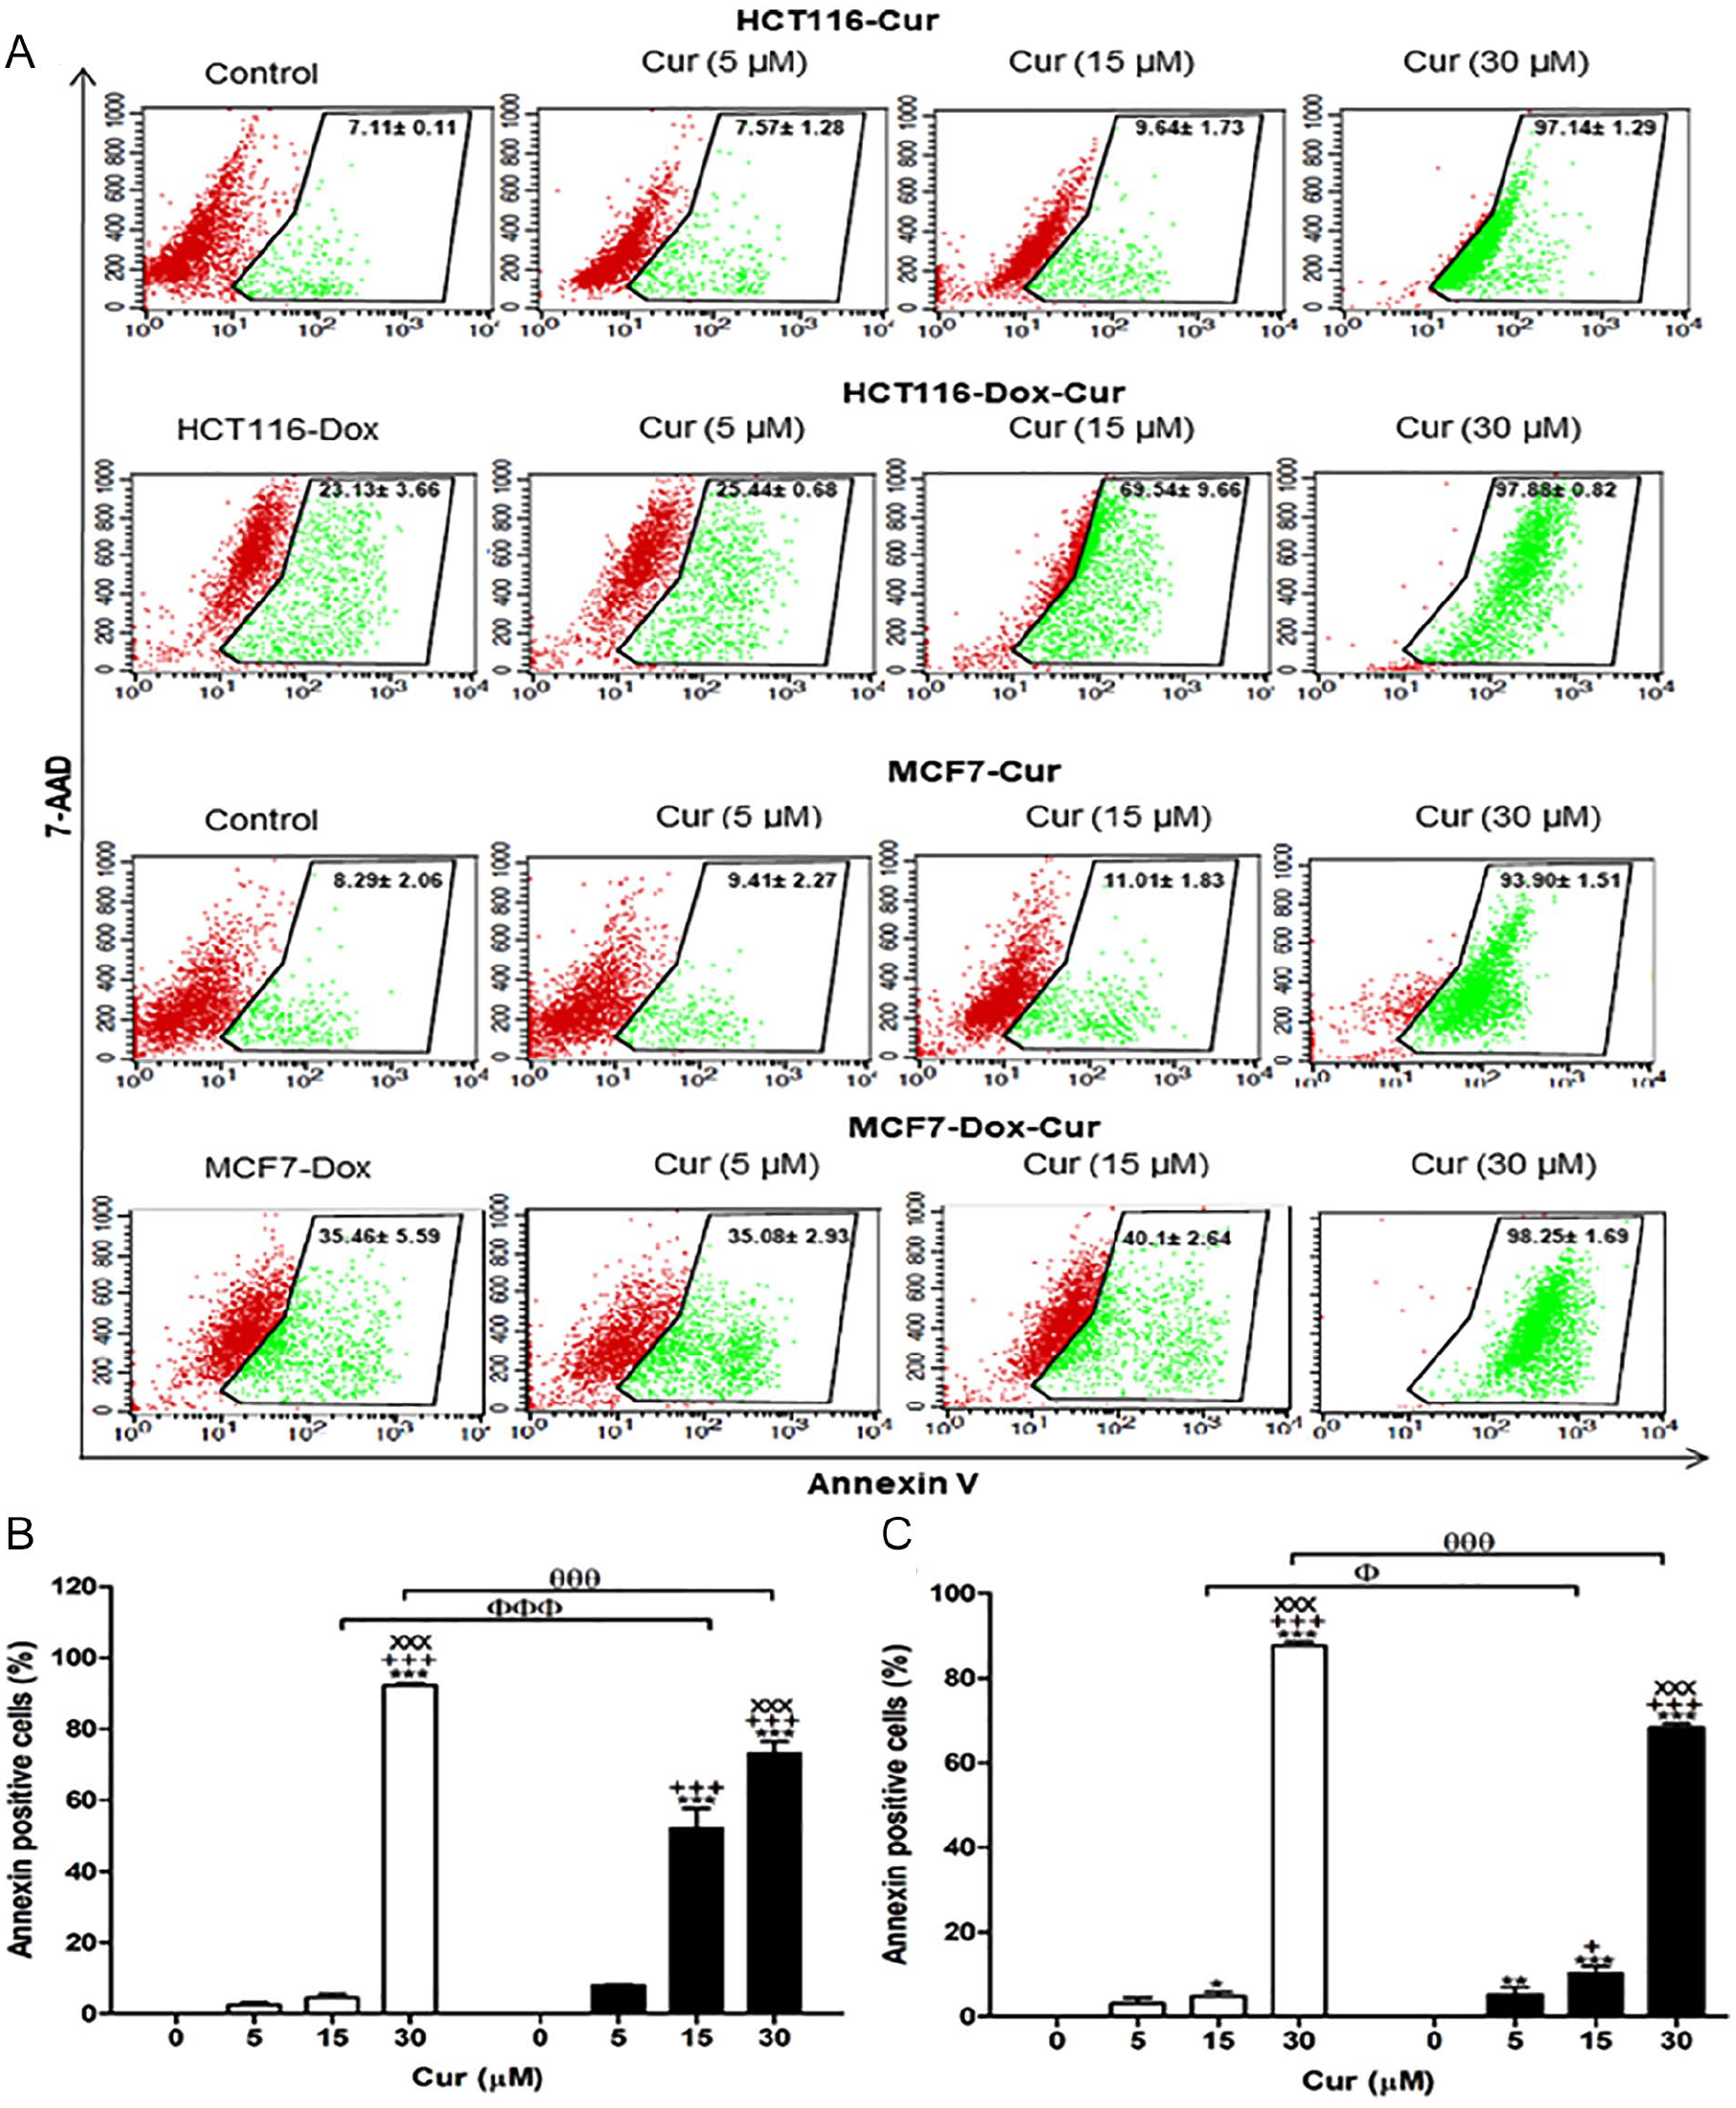
Apoptotic potential of curcumin (Cur) using the annexin-V assay. (A) Flow cytometric analysis of both proliferative and Dox-treated HCT116 and MCF7 cells. Red color represents the live cells, and green color represents the annexin-V–positive cells. (B) The percentages of annexin-V–positive cells of proliferative HCT116 and Dox-treated HCT116. (C) The percentages of annexin-V–positive cells of proliferative MCF7 and Dox-treated MCF7. Cells were exposed to Cur (0, 5, 15, and 30 µM) for 24 hours. Data of all concentrations were subtracted by the data of 0 µM. Data were analyzed with 2-way ANOVA followed by Bonferroni posttest. *P < .05, **P < .01, and ***P < .001 versus Cur 0 µM. +++P < .001 versus Cur 5 µM. xxxP < .001 versus Cur 15 µM for HCT116, HCT116-Dox, MCF7, and MCF7-Dox, separately. ФP < .05 and ФФФP < .001 versus Cur 15 µM in proliferative and Dox-treated cells. θθθP < .001 versus Cur 30 µM in proliferative and Dox-treated cell. Error bars represent mean ± SD. PE-annexin-V signals were observed at excitation/emission 496, 546, and 565⁄578 nm. Control refers to proliferative cancer cells. HCT116-Dox refers to control senescent HCT116 cells. MCF7-Dox refers to control senescent MCF7 cells. White bars refer to proliferative cancer cells. Black bars refer to senescent cancer cells.
Proliferative MCF7 treated with Cur at concentrations of 15 (P < .05) and 30 (P < .001) µM exhibited significant increases in apoptosis compared with proliferative MCF7 untreated with Cur. Concentrations of 5 (P < .001), 15 (P < .001), and 30 (P < .001) µM of Cur significantly increased apoptosis in Dox-treated MCF7 in comparison with Dox-treated MCF7 untreated with Cur. Comparing proliferative MCF7 and Dox-treated MCF7 treated with Cur, results showed that 15 (P < .05) µM of Cur significantly increased apoptosis in Dox-treated MCF7 compared with proliferative MCF7.
Proliferative HCT116 treated with Caff at concentrations of 10 and 15 mM exhibited significant increases in apoptosis compared with control Caff-untreated cells. Proliferative MCF7 cells had no significant changes in annexin-V–positive percentages when treated with Caff in comparison with Dox-treated MCF7 Caff-untreated cells. Dox-treated HCT116 exhibited significant increases in apoptosis (2.4- to 3.5-fold) when treated with Caff at concentrations of 10 and 15 mM (P < .01 and P < .001, respectively), and Dox-treated MCF7 cells revealed significant increases in apoptosis percentages (~2.5-fold) when treated with 5, 10, and 15 mM Caff (P < .001) compared with their proliferative cells at the same drug concentration (Figure 5A and B).

Apoptotic potential of caffeine (Caff) using the annexin-V assay. (A) Flow cytometric analysis of both proliferative and Dox-treated HCT116 and MCF7 cells. Red color represents the live cells, and green color represents the annexin-V–positive cells. (B) The percentages of annexin-V–positive cells of proliferative HCT116 and Dox-treated HCT116. (C) The percentages of annexin-V–positive cells of proliferative MCF7 and Dox-treated MCF7. Cells were exposed to Caff (0, 5, 10, and 15 mM) for 24 hours. Caff (0 mM) is a control for corresponding proliferative or senescent of either HCT116 or MCF7. Data of all concentrations were subtracted by the data of 0 mM. Data were analyzed with 2-way ANOVA followed by Bonferroni posttest. *P < .05 and ***P < .001 versus Caff 0 mM. +++P < .001 versus Caff 5 mM. xP < .05 versus Caff 10 mM for HCT116, HCT116-Dox, MCF7, and MCF7-Dox, separately. ΘΘΘP < .001 Caff 5 mM in proliferative and Dox-treated cell. ФФP < .01 and ФФФP < .001 versus Caff 10 mM in proliferative and Dox-treated cell. θθθθP < .001 versus Caff 15 mM in proliferative and Dox-treated cell. Error bars represent mean ± SD. PE-annexin-V signals were observed at excitation/emission 496, 546, and 565⁄578 nm. Control refers to proliferative cancer cells. HCT116-Dox refers to control senescent HCT116 cells. MCF7-Dox refers to control senescent MCF7 cells. White bars refer to proliferative cancer cells. Black bars refer to senescent cancer cells.
The percentages of annexin-V–positive cells were significantly increased in proliferative HCT116 treated with 25 (P < .05), 50 (P < .01), and 75 (P < .001) µM of TQ, while Dox-treated HCT116 treated with 10 (P < .001), 25 (P < .001), 50 (P < .001), and 75 (P < .001) µM of TQ had significant increases in apoptosis compared with their corresponding controls (Figure 6A and B). In comparison between proliferative and senescent cells of either HCT116 or MCF7, concentrations of TQ at 50 (P < .05) and 75 (P < .01) µM induced significant increases in apoptosis of Dox-treated HCT116 compared with proliferative HCT116. Dox-treated MCF7 treated with TQ at 25 (P < .001), 50 (P < .001), and 75 (P < .001) µM had significant increases of apoptosis compared with proliferative MCF7.

Apoptotic potential of thymoquinone (TQ) using the annexin-V assay. (A) Flow cytometric analysis of both proliferative and Dox-treated HCT116 and MCF7 cells. Red color represents the live cells, and green color represents the annexin-V–positive cells. (B) The percentages of annexin-V–positive cells of proliferative HCT116 and Dox-treated HCT116. (C) The percentages of annexin-V–positive cells of proliferative MCF7 and Dox-treated MCF7. Cells were exposed to TQ (0, 10, 25, 50, and 75 µM) for 24 hours. TQ (0 µM) is a control for the corresponding proliferative or senescent of either HCT116 or MCF7. Data of all concentrations were subtracted by the data of 0 µM. Data were analyzed with 2-way ANOVA followed by Bonferroni posttest. *P < .05, **P < .01, and ***P < .001 versus TQ 0 µM. +P < .05 and +++P < .001 versus TQ 10 µM. xxP < .01 and xxxP < 0.001 versus TQ 25 µM. ###P < .001 versus TQ 50 µM for HCT116, HCT116-Dox, MCF7, and MCF7-Dox, separately. ΘΘΘP < .001 versus TQ 25 µM in proliferative and Dox-treated cells. ФP < .05 and ФФФP < .001 versus TQ 50 µM in proliferative and Dox-treated cells. θθP < .01 and θθθP < .001 versus TQ 75 µM in proliferative and Dox-treated cells. Error bars represent mean ± SD. PE-annexin-V signals were observed at excitation/emission 496, 546, and 565⁄578 nm. Control refers to proliferative cancer cells. HCT116-Dox refers to control senescent HCT116 cells. MCF7-Dox refers to control senescent MCF7 cells. White bars refer to proliferative cancer cells. Black bars refer to senescent cancer cells.
Discussion
Dox is a secondary metabolite of Streptomyces peucetius var caesius, a member of the anthracycline family. It is a well-known and highly effective antineoplastic agent for the treatment of leukemia, lymphomas, and breast cancer. 30 Dox-induced senescence in cancer cells is exhibited through the induction of both functional p53 and telomere dysfunction. 31 In the current study, Dox-treated HCT116 and MCF7 cells exhibited senescence that was monitored by SA-β-gal activity, proliferation cessation, and overexpression of p53, P-p53 (Ser15), and p21 proteins.29,32-35 Phosphorylation of p53 at serine 15 disrupts the mouse double minute-2 homolog (MDM-2)–p53 interaction, leading to elongation of the half-life of p53.36,37 The increased levels of p53 induced the expression of p21, which concomitantly inhibited some genes involved in mitosis and led to cell cycle arrest. 38 p53-dependent expression of p21 stops endoreduplication by inhibiting cyclin E/cyclin-dependent kinase 2 (CDK2) and cyclin-dependent kinase (CDK1) activities. 39 Downregulation of cyclins by p53/p21 may be considered the first step in establishing senescence with cell cycle arrest. 40
Cur is the active ingredient of turmeric and is known for its therapeutic potential against many diseases. 41 Recently, Zhang et al 42 found that based on tissue culture studies using U937 cell lines, Cur caused the induction of the expression of interferon regulatory genes (especially IFIT2). The upregulation of IFIT2 increased the anticancer activity of Cur and its ability to induce apoptosis. The authors proposed the possibility of using Cur in conjunction with interferon for more efficient cancer treatment. 42 Moreover, Cur showed apoptotic effects in numerous cancers through downregulation of NF-κB, c-myc, Bcl2, cyclooxygenase-2, nitric oxide synthases, cyclin D1, tumor necrosis factor-α, interleukins, and matrix metalloproteinase-9 expressions,14,43 and suppressed CDK2 activity in proliferative HCT116 cells. 44 Also, Cur induced cytotoxicity to proliferative MCF7 cells as stated by Choudhuri et al. 45 Our data revealed that Cur induced apoptosis in both proliferative and senescent types of HCT116 and MCF7, but there are no significant differences between apoptosis in senescent and proliferative of both HCT116 and MCF7, except for Cur 15 µM.
Caffeine is a methylxanthine derivative that is widely consumed worldwide as a psychoactive substance. It is found mainly in coffee, tea, and coca, and it induces multiple normal physiological and pharmacological effects, including nervous and musculoskeletal system stimulation, and bronchial and vascular smooth muscle relaxation. 46 Several studies have reported that Caff may have potential as an anticancer agent due to its ability to suppress cell proliferation and induce apoptosis in multiple organs, including the breast, liver, and brain, via several oncogenic pathways. 47 Caff induced apoptosis of several proliferative cancer cells through inhibition of ATM/ATR kinases, the components of DNA damage-responsive checkpoints. 48 Also, Caff may exert apoptosis through p53-dependent and p53-independent pathways.49,50 Furthermore, Caff can induce apoptosis via phosphatase and tensin homolog, PI3K/protein kinase B (AKT), and p53 and mammalian target of rapamycin (mTOR) pathways. 51 Other studies have demonstrated that caspase-9 and caspase-3 may serve important roles in Caff-induced cancer cell apoptosis.52,53 Previous research indicated that Caff may have sustained effects following withdrawal, 54 the underlying mechanism of which remains unknown. In the current study, Caff induced apoptosis of Dox-treated HCT116 and MCF7 cells. Also, 10 and 15 mM of Caff induced significant increases in apoptosis in Dox-treated HCT116 and Dox-treated MCF7 treated with 5, 10, and 15 mM Caff in comparison with their corresponding proliferative cells. Therefore, Caff is considered as a senolytic drug for senescent HCT116 and MCF7 cells, and Caff showed promising senolytic activity; however, it was achieved with high doses (5-15 mM). Therefore, we suggest formulating Caff in nanoparticles to reduce these high doses and increase their bioavailability.
Bcl2 upregulation is a senescence hallmark that inhibits apoptosis of cancer cells. 55 Thus, the senolytic drug should be able to downregulate Bcl2 to initiate apoptosis besides the induction of Bax that exaggerates senolysis. TQ successfully downregulated Bcl2 in Dox-treated HCT116 and Dox-treated MCF7 and upregulated Bax levels in Dox-treated HCT116. These findings have been corroborated by the studies of Gali-Muhtasib et al, 22 who reported downregulation of Bcl2 in HCT116 in response to TQ. Also, TQ enhanced the 5-fluorouracil–induced apoptosis of gastric cancer cells through upregulation of caspase-3, caspase-9, and Bax along with downregulation of Bcl2. 56 In the current study, the data revealed that TQ induced apoptosis of Dox-treated HCT116 and MCF7 more effectively than proliferative HCT116 and MCF7 at 50 and 75 µM, indicating the senolytic effect of TQ against HCT116 and MCF7 at these doses. Several studies investigated the inhibitory effect of TQ against proliferative cancer cell growth and induced apoptosis of various human cancer cells including breast, 57 colorectal, 22 stomach, 56 lungs, 58 and prostate cancers. 59 Many studies demonstrated that TQ induces apoptosis of proliferative cancers in p53-dependent or p53-independent pathways in HCT116 cells.22,60 Kundu et al 61 stated that TQ induced upregulation of Bax with activation of caspase-3, caspase-7, and caspase-9. Regarding MCF7 cells, TQ significantly inhibited their viability in a dose-dependent manner 62 through upregulation of p53, 63 inhibiting MDM-2, 64 and downregulating AKT. 65 Also, TQ targets specific genes in the interferon pathways. 66 Furthermore, TQ potentiated the cytotoxicity of tamoxifen against MCF7. 67 Combination therapy of Dox and TQ resulted in the survival of cardiac myocytes at concentrations that were able to reduce the leukemia cells. 68
Conclusion
The mechanisms by which Cur, Caff, and TQ induce apoptosis in numerous proliferative cancer cells including HCT116 and MCF7 are well known as discussed above, but in the current study, senescent HCT116 (Dox-treated) and MCF7 (Dox-treated) exhibited higher sensitivity to Cur, Caff, and TQ than their proliferative cells. Caff has senolytic activities toward both senescent HCT116 and senescent MCF7 cells but with high concentrations; more studies are needed to increase Caff bioavailability to decrease these senolytic doses. This study suggested the senolytic effect of Cur and TQ against senescent HCT116 and senescent MCF7. These findings still need more investigation to confirm this, and in vivo and clinical trials are of great importance to validate our results.
Footnotes
Acknowledgements
Data were obtained during Dr. Ali H. El-Far’s sabbatical in the Laboratory of Molecular Bases of Aging, Nencki Institute of Experimental Biology, Warsaw, Poland, as an independent researcher. Also, we thank Dr. Kelly A. Keating (Pharmaceutical Research Institute, Albany College of Pharmacy and Health Sciences) for editing of the article.
Declaration of Conflicting Interests
The author(s) declared no potential conflicts of interest with respect to the research, authorship, and/or publication of this article.
Funding
The author(s) received no financial support for the research, authorship, and/or publication of this article.