
Abstract
Objective. The chemopreventive potential of (+)-catechin-rich extract of Acacia catechu (L.f.) Willd. heartwood (AQCE) was evaluated against human breast adenocarcinoma cell line (MCF-7) and 7,12-dimethylbenz[a]anthracene (DMBA)–induced mammary carcinoma in Balb/c mice. Methods. Cell cytotoxicity was investigated using different colorimetric assays. Apoptosis was observed using diphenylamine assay and fluorescent microscopy. AQCE was further evaluated for antitumor activity against DMBA-induced mammary carcinoma. The levels of tumor markers and oxidative stress were measured. Furthermore, level of transcription factors was measured by enzyme-linked immunosorbent assay. Results. The results showed that administration of AQCE showed a dose-dependent growth inhibition response and DNA fragmentation in MCF-7 cells. Tumor multiplicity was significantly decreased to 42.91% with AQCE when compared with DMBA-treated animals. The levels of tumor markers such as total sialic acid and lipid-associated sialic acid were substantially increased after DMBA treatment. However, AQCE treatment restored tumor markers level. AQCE also significantly reduced elevated levels of nitrite and malondialdehyde in DMBA-treated animals. Additionally, AQCE also increased the activities of antioxidant enzymes, viz., catalase, superoxide dismutase, total thiol, reduced glutathione, protein thiol, glutathione peroxidase, glutathione reductase, and glutathione-S-transferase in the mammary tissue and liver mitochondria of DMBA-administered animals. Significant increase in the protein levels of p53, c-jun, and p65 were observed in DMBA-treated mice, whereas less expression was observed in AQCE-treated animals. Eventually, AQCE also significantly improved body weight and maintained the mammary tissue architecture in normal range. Conclusions. The present data strongly suggest that anticancer potentiality of (+)-catechin-rich AQCE may be attributable to its ability to positively modulate tumor markers as well as the antioxidant system that could decompose the peroxides and, thereby, offer a protection against lipid peroxidation and linked to the expression of transcription factors during DMBA-induced mammary carcinoma.
Introduction
Breast cancer is currently the primary cause of cancer-related death in women globally, and conventional treatments such as radiation and chemotherapy have many deleterious and long-lasting side effects, some of which are even permanent, such as infertility. 1 As certain tumor cells can also acquire resistance to chemotherapy, the need for the development of a better targeted anticancer treatment still continues. In this direction, there has been growing interest in the identification of naturally occurring molecules with chemopreventive and chemotherapeutic properties.
One of the major reasons for the conversion of normal cells to cancerous cells is free radicals, which are involved in both initiation and promotion of carcinogenesis. Under normal conditions, the reactive oxygen species (ROS) generated is detoxified by the defense antioxidant enzymes of the body. However, oxidative stress results in overproduction of ROS, and inadequate antioxidant defense in the target cell may cause damage to cell membranes and induce mutations in DNA. ROS react with membrane polyunsaturated fatty acids and cause the peroxidation of lipids, and these peroxides react with nitric oxide (NO·) to form peroxynitrite, which interacts with lipids, DNA, and proteins. The inflammation or damage caused by these ROS can lead to development of cancer. 2 ROS generation has been shown to alter the activity of several early response genes and transcription factors. 3 Antioxidants may exert their effect by directly reacting with free radicals, quenching them or chelating the catalytic metal ions or by acting as oxygen scavengers. 4
Various molecules from natural origin have the potential to attune the biochemical imbalances induced by various toxins associated with free radicals. They provide beneficial effects without causing any major side effects, and therefore, in recent years there is lot of emphasis on development of drugs from plants. 5 Acacia catechu (L.f.) Willd. (Leguminosae), locally known as khair, is a medium-sized deciduous tree with a wavy and lodged trunk. In folk medicine, the bark of A catechu, in combination with other drugs, is prescribed for snake bite. The decoction of bark mixed with milk is taken to treat colds and coughs and is given alone or in combination with opium in the treatment of severe diarrhea. Heartwood of khair is boiled with other ingredients to prepare the decoction. It is perceived as a tea for pregnant women to maintain their body heat. It is also given to treat fever due to cold during pregnancy. Water boiled with the heartwood chips of khair is used as a bath by women after delivery. It is considered useful for the treatment of body pains. Decoction of heartwood is applied in the mouth and on the tongue to cure mouth ulcer. It is also used externally on ulcers, boils, skin rashes, and on gums as disinfectant. 6
The catechu (concentrated aqueous extract of A catechu heartwood) is extensively used in mouth fresheners and paan in India. Catechu is used in the treatment of diarrhea and throat infection because the tannins and polyphenols present in it impart astringent activity. Acacia catechu is also reported to have antihypertensive, 7 antipyretic, hypoglycemic, hepatoprotective, 8 and antiviral 9 activities. Recently, it has been reported that A catechu inhibits squamous cell carcinoma in Balb/c mice. 10 In this study, we investigated the cytotoxicity of the (+)-catechin-rich A catechu (+)-catechin rich heartwood aqueous extract (AQCE) against human breast adenocarcinoma cells (MCF-7) and chemopreventive potential against polycyclic aromatic hydrocarbon 7,12-dimethylbenz[a]anthracene (DMBA)–induced mammary carcinoma in female Balb/c mice.
Methods
Chemicals
All the chemicals used in the study (analytical grade) were obtained from Himedia Laboratories (Mumbai, India), Merck (Mumbai, India), and Sigma Chemical Co (St Louis, MO). Antibodies against p53, AP-1 (c-jun), and NF-kB (p65) were obtained from Santa Cruz Biotechnology (Santa Cruz, CA).
Preparation of Extract
Acacia catechu heartwood was collected from Hamirpur, Himachal Pradesh, India, during the month of September 2011. The plant material was taxonomically identified and authenticated by Dr Sunil Dutt, Scientist, National Medicinal Plant Board, Ayush, New Delhi, India. A voucher specimen (AC-2011) was deposited in the herbarium at the Pharmacy Department, Jaypee University of Information Technology, Waknaghat, Himachal Pradesh, India.
One kilogram of the dried powder of A catechu heartwood was placed in an aluminum pot to which 10 liters of water was added and boiled for 5 hours and allowed to stand for 24 hours. The extract was decanted off in a pot and was filtered through a fine muslin cloth to remove suspended materials. The filtrate was concentrated 10-fold in a rotator evaporator (Heidolph G3, Schwabach, Germany). The viscous brown fluid was freeze-dried in a Martin Christ Alpha 1-2 LD plus freeze-dryer (Osterode am Harz, Germany) to obtain the solid mass. Percentage yield (w/w) of AQCE was found to be 21.23. The extract was stored at −20°C prior to use.
High-Performance Liquid Chromatography (HPLC) Analysis of AQCE
Preparation of standard and sample
The stock solutions were prepared by dissolving the appropriate amount of ~5.0 mg standard, (+)-catechin, and dried powered sample in 7 mL of diluent (0.1% formic acid water and methanol, 3:7) with sonication for 15 minutes. The final volume of solution was then diluted to 10 mL with the diluent at room temperature. The extract was centrifuged at 12 000g for 2 minutes to obtain a clear solution and filtered through a 0.22-µm filter. The injection volume was 20 µL.
Chromatographic conditions
The AQCE was analyzed using a modified HPLC method after Burnett et al. 11 The quantification of (+)-catechin was carried by reverse-phase HPLC (HPLC Waters 515; Waters, Milford, MA) through a C18 (5.0 mm) 250 mm × 4.6 mm Waters spherisorb symmetry column fitted with a photodiode array detector (Waters 2996). The mobile phase consisted of 0.1% trifluoroacetic acid (TFA)/acetonitrile (ACN) (85:15, v/v). Before use, the mobile phase was degassed using an ultrasonic bath and filtered using 0.4-mm membrane filters. The column was eluted in the isocratic mode with a flow rate of 1.0 mL/min. The (+)-catechin was detected at an absorbance wavelength of 279 nm. The cycle time of analysis was 25 minutes at 30°C. The compounds were identified on the basis of their retention time and comparison of UV spectra with the authentic standards procured from Sigma Aldrich.
In Vitro Cytotoxic Studies
Cell culture and treatment
Human breast adenocarcinoma cell line (MCF-7) was obtained from National Centre for Cancer Science (NCCS), Pune, India, and grown as a monolayer in DMEM supplemented with 10% FBS (fetal bovine serum; 100 µg/mL streptomycin and 100 units/mL penicillin). Cells were incubated at 37°C in an atmosphere of 5% CO2. Cells were grown to 85% confluence and treated with extract for 48 hours. Stock solutions and dilutions of extract were prepared in culture medium. For 96-well plates, cell were seeded at approximately 1.5 × 10⁴ cells per well. For 24-well plates, cells were seeded at approximately 4 × 10⁴ cells per well.
MTT assay
The cell viability of MCF-7 was assessed by the MTT colorimetric assay, which is based on the reduction of MTT by the mitochondrial succinate dehydrogenase of intact cells to a purple formazan product. 12 Briefly, the adherent MCF-7 cells were incubated in 96-well microtiter plates for 48 hours at 37°C in a 5% CO2 incubator. Following the addition of the test compounds, the plates were incubated for an additional 48 hours. Control wells contained medium alone. Three replicate wells were used at each point in the experiments. After 48-hour incubation, MTT solution (5 mg/mL in phosphate-buffered saline [PBS]) was added and incubated for another 4 hours. The resulting MTT/formazan product was dissolved by 100 µL of isopropanol and the plates were gently shaken to solubilize the formed formazan. The amount of formazan was determined by measuring the absorbance (OD) at 570 nm using a Bio-Rad 550 enzyme-linked immunosorbent assay (ELISA) microplate reader.
Sulforhodamine B (SRB) assay
Growth inhibition was determined using the SRB assay, which estimates cell number indirectly by measuring total basic amino acids. 13 Briefly, the cells were incubated in 96-well microtiter plates for 48 hours. Following the addition of the test compounds, the plates were incubated at 37°C for an additional 48 hours in a 5% CO2 incubator. The culture medium was then discarded and the cells were fixed in situ by the gentle addition of 100 µL of cold 10% (w/v) trichloroacetic acid and incubated for 60 minutes at 4°C. The supernatant was discarded and the plates were washed 5 times with tap water and air dried. SRB solution (100 µL) at 0.4% (w/v) in 1% acetic acid was added and plates were incubated for 20 minutes at room temperature. After staining, unbound dye was removed by washing 5 times with 1% acetic acid and the plates were air dried. Bound stain was subsequently solubilized with 10 mM Tris (pH 10.5), and the absorbance was read at 515 nm on a Bio-Rad 550 ELISA microplate reader.
Lactate dehydrogenase (LDH) leakage assay
In LDH assay, leakage of the cytoplasma located enzyme LDH into the extracellular medium is measured. 14 LDH activity was measured in both the supernatants and the cell lysate fractions using Cyto-Tox 96, a nonradioactive cytotoxicity assay kit (Promega, Madison, WI), in accordance with the manufacturer’s instruction. The intensity color is proportional to LDH activity. LDH release was calculated by measuring the absorbance at 490 nm using an ELISA microplate reader.
Determination of Mode of Cell Death
Morphological changes of cells
Analysis of cell morphological changes was evaluated for 48 hours in the absence or presence of AQCE at concentrations of 20, 40, 60, 80, and 100 µg/mL in 24-well plates. At the end of the incubation period, cells were observed under phase contrast inverted microscope at 200× magnifications.
Hoechst assay
Differential staining with specific fluorochromes can be used to distinguish cells undergoing apoptosis from viable and necrotic cells. Analysis of changes in cell morphology was evaluated with Hoechst fluorescence staining according to the method described by Duarte et al. 15 The cells were cultured in 24-well plates to 85% confluence and then treated with the extract for 48 hours as described previously. Next, the cells were washed in PBS and fixed with 4% formaldehyde in PBS for 15 minutes and stained with 10 µg/mL Hoechst 33258 (HO; Sigma, St Louis, MO) at room temperature for 10 minutes in PBS. The apoptosis was classified by morphology and color of the cells and quantified. Finally, after the cells were washed with PBS, morphological changes were observed under a fluorescence microscope.
Acridine orange/ethidium bromide (AO/EB) fluorescence staining
Analysis of changes in cell morphology was evaluated using AO/EB fluorescence staining according to the method described by Jimenez et al. 16 Briefly, to a suspension of AQCE-treated cells were added 4 µL/mL of dye mixture, containing 100 µg/mL acridine orange (Sigma) and 100 µg/mL ethidium bromide (Sigma) in PBS, and washed once with PBS. After staining, cells were visualized immediately under a fluorescence microscope.
Estimation of percentage of DNA fragmentation
DNA fragmentation in MCF-7cells was assayed by the method of Kurita-Ochiai et al. 17 DNA from the cells was released into the lysis buffer (0.2% Triton X-100, 10 mM Tris, and 1 mM EDTA [pH 8.0]) by rupturing the nucleus. The supernatant received after centrifugation at 14 000g for 15 minutes contained fragmented DNA while the intact DNA was in the pellet. The amount of DNA in both the supernatant and pellet was estimated using diphenylamine (DPA) assay. The percentage of DNA fragmentation was calculated as the ratio of DNA in supernatant and DNA in pellet.
In Vivo Antitumor Activity
Animals
Healthy female Balb/c mice were obtained from the University Animal House and kept under controlled conditions of temperature (23 ± 5°C), humidity (60 ± 5%), and light (12-hour light–dark cycle). They were fed standard mouse pellets and water ad libitum. All animals were acclimatized for 1 week before experimentation. The animal care and handling was done according to the guidelines set by the World Health Organization (WHO), Geneva, Switzerland. Approval for this work was obtained from the university animal ethical committee.
Experimental design and tumor induction
After 1 week of acclimatization, the mice were randomly divided into 3 groups (n = 10). Mice of group 1 served as controls and these animals were orally administered with olive oil (100 µL per mouse) only. Mammary carcinogenesis was induced in groups 2 and 3 with a single oral dose of DMBA (50 mg/kg, body weight) dissolved in olive oil. 18 Group 3 animals were treated as group 2 mice along with oral administration of 200 µL of AQCE at the dose level 400 mg/kg body weight, using a blunt tipped cannula, thrice a week throughout the experiment. AQCE was administered orally 1 week before the initiation of DMBA treatment in group 3. At the end of experiment, the mice were fasted overnight and killed by cervical decapitation. Blood samples were collected from the common carotid and allowed to clot before centrifugation at 1000g for 10 minutes at 4°C to separate serum. The mammary tissue and liver from the same animals were excised, rinsed twice with ice-cold 0.1 M phosphate buffer saline, pH 7.4, blotted and stored at −20°C for various biochemical estimations.
Tumor analysis
Tumor incidence, multiplicity, tumor mass, tumor volume, body weight, and number of animals that survived the 20-week period were recorded. The bodyweight and number of deaths were recorded at weekly intervals. Tumor volume was calculated using the following formula:

where r is the mean tumor radius in millimeters.
Biochemical Estimations
Preparation of mammary tissue post-mitochondrial supernatant (PMS)
A 10% tissue homogenate (w/v) was prepared from part of the sample in 0.15 M Tris–HCl buffer (pH 7.4) by using a mechanically driven Teflon fit Potter-Elvehjem homogenizer. The homogenate was subjected to cold centrifuge (4°C) at 10 000g for 30 minutes to obtain post-mitochondrial supernatant (PMS). The PMS thus obtained was used for estimation of tumor markers and oxidative stress.
Extraction of mitochondria from liver tissues
The liver mitochondria were isolated according to the established method of Senior et al. 19 A 10% liver homogenate was prepared in ice-cold 0.25 M sucrose solution. The homogenate was then filtered through a single layer of muslin cloth, and the filtrate was centrifuged at 1000g for 10 minutes at 4°C to obtain the nuclear pellet. The mitochondria were pelleted by centrifuging the postnuclear supernatant at 10 000g for 20 minutes at 4°C. The pellet so obtained was suspended in 20 mM Tris–HCl buffer (pH 7.4) and was subsequently used for biochemical estimations.
Estimation of total sialic acid (TSA) levels
TSA was measured by the method reported by Plucinsky et al. 20 In this method, TSA reacts with resorcinol to give a blue-colored complex, which was extracted by butyl acetate and n-butanol. The absorption of this blue-colored complex was measured at 580 nm. The results were expressed as micrograms per milliliter of sample.
Measurement of lipid-associated sialic acid (LASA) levels
The LASA level was estimated by method as described by Katopodis et al. 21 Total sialic acid in sample was extracted by chloroform/methanol. LASA was then precipitated by phosphotungstic acid. LASA formed a blue-colored complex with the resorcinol reagent. The colored component was then extracted by butyl acetate and n-butanol, and the chromophore was measured at 580 nm. The results were expressed as micrograms per milliliter of sample.
Lipid peroxidation
Lipid peroxidation was quantified in PMS and liver mitochondria as described by Wills. 22 The amount of malondialdehyde (MDA) formed was determined by the reaction with thiobarbituric acid and optical density was read at 532 nm. The results were expressed as nanomoles of MDA/mg protein using the molar extinction coefficient of MDA-thiobarbituric chromophore (1.56 × 10⁵ M−1 cm−1).
Estimation of nitrite
Nitrite estimation in the samples was done by the method of Green et al. 23 Briefly, to 100 µL of the sample, 200 µL of Griess reagent (prepared by mixing fresh solution of n-naphthylethylenediamine dihydrochloride [0.15%] in distilled water and sulfanilamide [1.5%] in 1 N HCl in a ratio of 1: 2) was added in the wells of the ELISA strip. After keeping the ELISA strip in dark for 30 minutes, the pink color so observed was read for its absorbance at 540 nm on an ELISA reader. The results were expressed as microgram of nitrite accumulated/min/mg protein.
Superoxide dismutase
Superoxide dismutase activity in the PMS and liver mitochondria was assayed by the method of Kono. 24 The reaction mixture contained 1.90 mL of sodium carbonate buffer (50 mM in 0.1 mM ethylenediaminetetraacetic acid [EDTA], pH 10.8), 0.7 mL of nitro blue tetrazolium (96 µM), 0.15 mL of Triton X-100 (0.6% v/v), and 50 µL of sample. The reaction was initiated by adding 0.15 mL of hydroxylamine hydrochloride (20 mM), and the development of blue-colored complex was followed with 1-minute intervals at 560 nm for 3 minutes. The enzyme activity was expressed as units/mg protein, where 1 unit of enzyme activity is defined as the amount of enzyme inhibiting the rate of reaction by 50%.
Catalase (CAT)
Catalase activity was assayed by the method of Aebi. 25 The reaction mixture contained 3 mL of H2O2-phosphate buffer (12.5 mM H2O2 in 0.067 M sodium phosphate buffer [pH 7.0]) and 100 µL of sample, and change in color was monitored by recording absorbance (240 nm) at 1-minute intervals for 3 minutes. The enzyme activity was expressed as mmoles of H2O2 decomposed/min/mg protein using the molar extinction coefficient of H2O2 (71 M−1 cm−1).
Glutathione peroxidase
Glutathione peroxidase activity was measured by the procedure of Flohe and Gunzler. 26 The assay mixture consisted of 2.60 mL phosphate buffer (50 mM, pH 7.0, containing 15 mM EDTA), 0.1 mL reduced nicotinamide adenine dinucleotide phosphate (NADPH; 6 mM), 5.0 µL glutathione reductase (GR; 1 unit), 0.1 mL of sodium azide (30 mM), 0.1 mL glutathione (GSH; 30 mM), and 0.2 mL of sample. The reaction was initiated by the addition of 10 µL of H2O2 (2.2 mM). The decrease in absorbance was followed at 340 nm for 3 minutes with 1-minute intervals. The enzyme activity was expressed as nmoles of NADPH oxidized/min/mg protein, using the molar extinction coefficient of NADPH (6.22 × 10⁶ M−1 cm−1).
Glutathione peroxidase
Glutathione reductase activity was determined by the method described by Carlberg and Mannervik. 27 The reaction mixture contained 2.7 mL of potassium phosphate buffer (0.067 M, pH 6.6), 0.1 mL EDTA (15 mM), 0.05 mL oxidized glutathione (GSSG; 7.5 mM), 0.1 mL of NADPH (6 mM in 1% [w/v] sodium bicarbonate), and 50 µL of sample, and change in color was monitored by recording absorbance (340 nm) at 1-minute intervals for 3 minutes. The enzyme activity was expressed as nmoles of NADPH oxidized/min/mg protein using the molar extinction coefficient of NADPH (6.22 × 10⁶ M−1 cm−1).
Glutathione-S-transferase
Glutathione-S-transferase activity was determined by the method of Warholm et al. 28 The PMS and liver mitochondrial fraction (0.1 mL), PBS buffer (pH 7.4; 1.0 mL), double distilled water (1.7 mL), and chloro-dinitro benzene (CDNB; 0.1 mL) were taken in screw cap tubes and incubated at 37°C for 15 minutes. Then, GSH (0.1 ml) was added and optical density was recorded at 340 nm for 3 minutes with 1-minute time intervals. The enzyme activity was expressed as nmoles of GSH-CDNB conjugate formed/min/mg protein, using the molar extinction coefficient of the conjugate (9.6 × 10⁶ M−1 cm−1).
Total thiol
Total thiol content was quantified in the PMS and liver mitochondria by the method of Sedlak and Lindsay. 29 A total of 0.4 mL of Tris–HCl buffer (0.2 M, pH 8.2, containing 0.02 M EDTA) was added to 0.2 mL of sample followed by the addition of 0.1 mL of DTNB (0.01 M) in capped tubes. This was followed by addition of 3 mL of absolute methanol and incubation was carried out at 22°C for 15 minutes. The contents were filtered through Whatman No. 1 filter paper, and the absorbance was read at 412 nm. Total thiol (T-SH) content was expressed as µmoles of T-SH/mg protein using the molar extinction coefficient of 5-thio-2-nitrobenzoic acid (13.6 × 10³ M−1 cm−1).
Reduced glutathione (GSH)
Reduced GSH content was estimated in the PMS and liver mitochondria by the method of Ellman. 30 A total of 0.2 mL of sample was treated with 0.75 mL of 4% (w/v) sulfosalicylic acid, centrifuged at 1200g for 5 minutes to obtain supernatant, which was then mixed with Ellman’s reagent (0.1 mM DTNB in 0.1 M sodium phosphate buffer, pH 8.0). DTNB was reduced by free-SH group of GSH to form 5-mercapto-2-nitrobenzoate, and the absorbance was measured at 412 nm. Results were expressed as µmoles of GSH/mg protein using the molar extinction coefficient of 5-thio-2-nitrobenzoic acid (13.6 × 10³ M−1 cm−1).
Protein thiols
Protein thiols (Pr-SHs) content was calculated from the difference between the values of T-SH and GSH and expressed as µmoles of Pr-SH/mg protein.
Protein Expression Analysis
Nuclear extract preparation
Nuclear extract was prepared by homogenizing mammary tissue (10%) in 2 mL of buffer A (50 mM NaCl, 10 mM Hepes [pH 8.0], 500 mM sucrose, 1 mM EDTA). After homogenizing 0.2% Triton-X 100 and 1 mM phenylmethylsulfonylfluoride (PMSF) were added and centrifuged at 5000g for 2 minutes at 4°C. The supernatant was removed and the pellet was resuspended in 500 µL of buffer B (50 mM NaCl, 10 mM Hepes [pH 8.0], 25% glycerol, 1 mM EDTA, 1 mM PMSF). This mixture was then centrifuged at 5000g for 3 minutes at 4°C. The supernatant was discarded and the pellet resuspended in 100 µL of buffer C (350 mM NaCl, 10 mM Hepes [pH 8.0], 25% glycerol, 1 mM EDTA, and 1 mM PMSF). This was then incubated on ice for 30 minutes with constant shaking and then centrifuged at 10 000g for 10 minutes at 4°C. The supernatant was collected as nuclear extract. The protein was determined in nuclear extract by the method of Lowry et al 31 using standard bovine serum albumin.
Protein quantification by ELISA
ELISA was carried out in nuclear extract to quantify p53, c-jun, and p65. The assay was standardized by revising the different concentration of antigens and antibodies. Wells were coated with antigens diluted in 100 µL of 0.05 M carbonate buffer (pH 9.6) and kept overnight at 4°C in a humid chamber. The plate was flicked to remove the unbound antigen solution and wells were blocked with 1% BSA in 0.1 M PBS (pH 7.2) for 1 hour at 37°C. Wells were flicked and washed thrice with 200 µL of PBS containing 0.05% (v/v) Tween-20. Wells were then incubated with anti-c-jun (1:250), anti-p65 (1:500), and anti-p53 (1:250) primary antibody, respectively, diluted in PBS (containing 0.05% Tween-20 and 1% BSA) and incubated for 2 hours at 37°C. The plate was again washed and incubated with antirabbit secondary antibody (1:1000) for 2 hours at 37°C. Wells were washed a further 3 times as described above and color was developed by addition of 2,2′-azino-di-(3-ethyl)-benothiozolinsulphonic acid (ABTS) reagent, and absorbance was measured at 405 nm by an ELISA reader.
Histopathological Assessment
Mammary tissue sections were made immediately from different groups of animals, fixed in 10% formalin, dehydrated in gradual ethanol (50% to 100%), cleared in xylene, and embedded in paraffin. Sections (4-5 µm thick) were prepared and the pathological changes were observed microscopically after staining with hematoxylin and eosin (H&E). These slides were evaluated by a pathologist.
Statistical Analysis
Values were represented as means ± standard error of mean (SEM) for the number of animals in each group (n = 10). The differences between the data obtained from test animal groups and the data obtained from control animal groups were subjected to 1-way analysis of variance (ANOVA; 95% confidence interval), followed by Tukey’s post hoc test for the determination of level of significance (Software Prism 3.0), and results were considered significant if P < .05.
Results
HPLC Analysis of Aqueous Extract of Acacia catechu Heartwood
The AQCE was analyzed using reverse-phase HPLC, and the chromatographic profile was compared with the reference standard (Figure 1A) obtained under the same conditions and the respective UV spectra. As (+)-catechin is most abundant and known for its antioxidant properties, it was chosen as a bioactive marker for standardization of this extract. (+)-Catechin peak appeared at a retention time of 13.730 minutes (Figure 1A). The mixture of 0.1% TFA and ACN gave optimum chromatographic separation of (+)-catechin from the other peaks in the extract (Figure 1B). From the chromatographic profiles, it was observed that the plant extract was rich in (+)-catechin (84.64%).

HPLC chromatogram of standard (A) and aqueous extract (B) of Acacia catechu heartwood.
In Vitro Cytotoxic Studies
In the present study, the cytotoxic effect of AQCE on different cells was characterized by 3 different colorimetric assays (MTT, SRB, and LDH release). Control assays were carried out for samples containing only the appropriate volumes of blank solutions and showed no effect on cell growth. Different cells were exposed to AQCE for about 48 hours, and cytotoxicity was determined with different cytotoxic assays. IC50 values (µg/mL) of AQCE on human breast cancer MCF-7 cells obtained by MTT, SRB, and LDH assays are given in Figure 2. The effect of AQCE against MCF-7 cells (concentration range 10-100 µg/mL) showed a decrease in percent cell viability in a dose-dependent manner, as compared with that of the control when examined by different cytotoxic assays. The IC50 values determined by MTT, SRB, and LDH methods were 39.48 ± 0.81, 41.60 ± 0.64, and 38.19 ± 0.91, respectively, on MCF-7 cells. The inverse relationship between the MTT, SRB, and the LDH responses adds credence to the accuracy of the data.
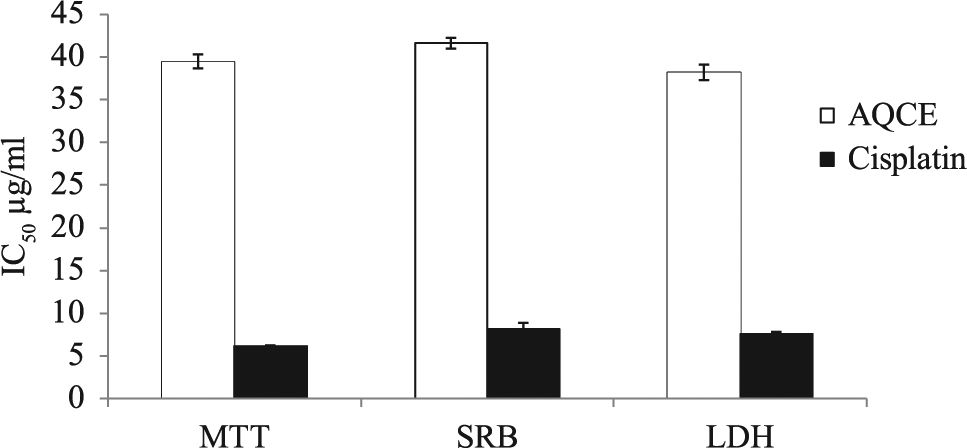
Cytotoxicity of AQCE against MCF-7 cell line.
Effect of AQCE on the Morphology of Cells
Direct observation of the morphological changes of MCF-7 cells revealed growth inhibition and induction of cell death after treatment with AQCE. Microscopic images of the cells could be observed clearly from the cell culture plates as shown in Figure 3. Cell shrinkage, chromatin condensation, and breakdown of the cell (apoptotic bodies), which are hallmarks of apoptosis, were observed in the treatment group. Formation of blebs on the cell membrane surface and protrusion of microspikes from the cells confirms the occurrence of apoptosis.
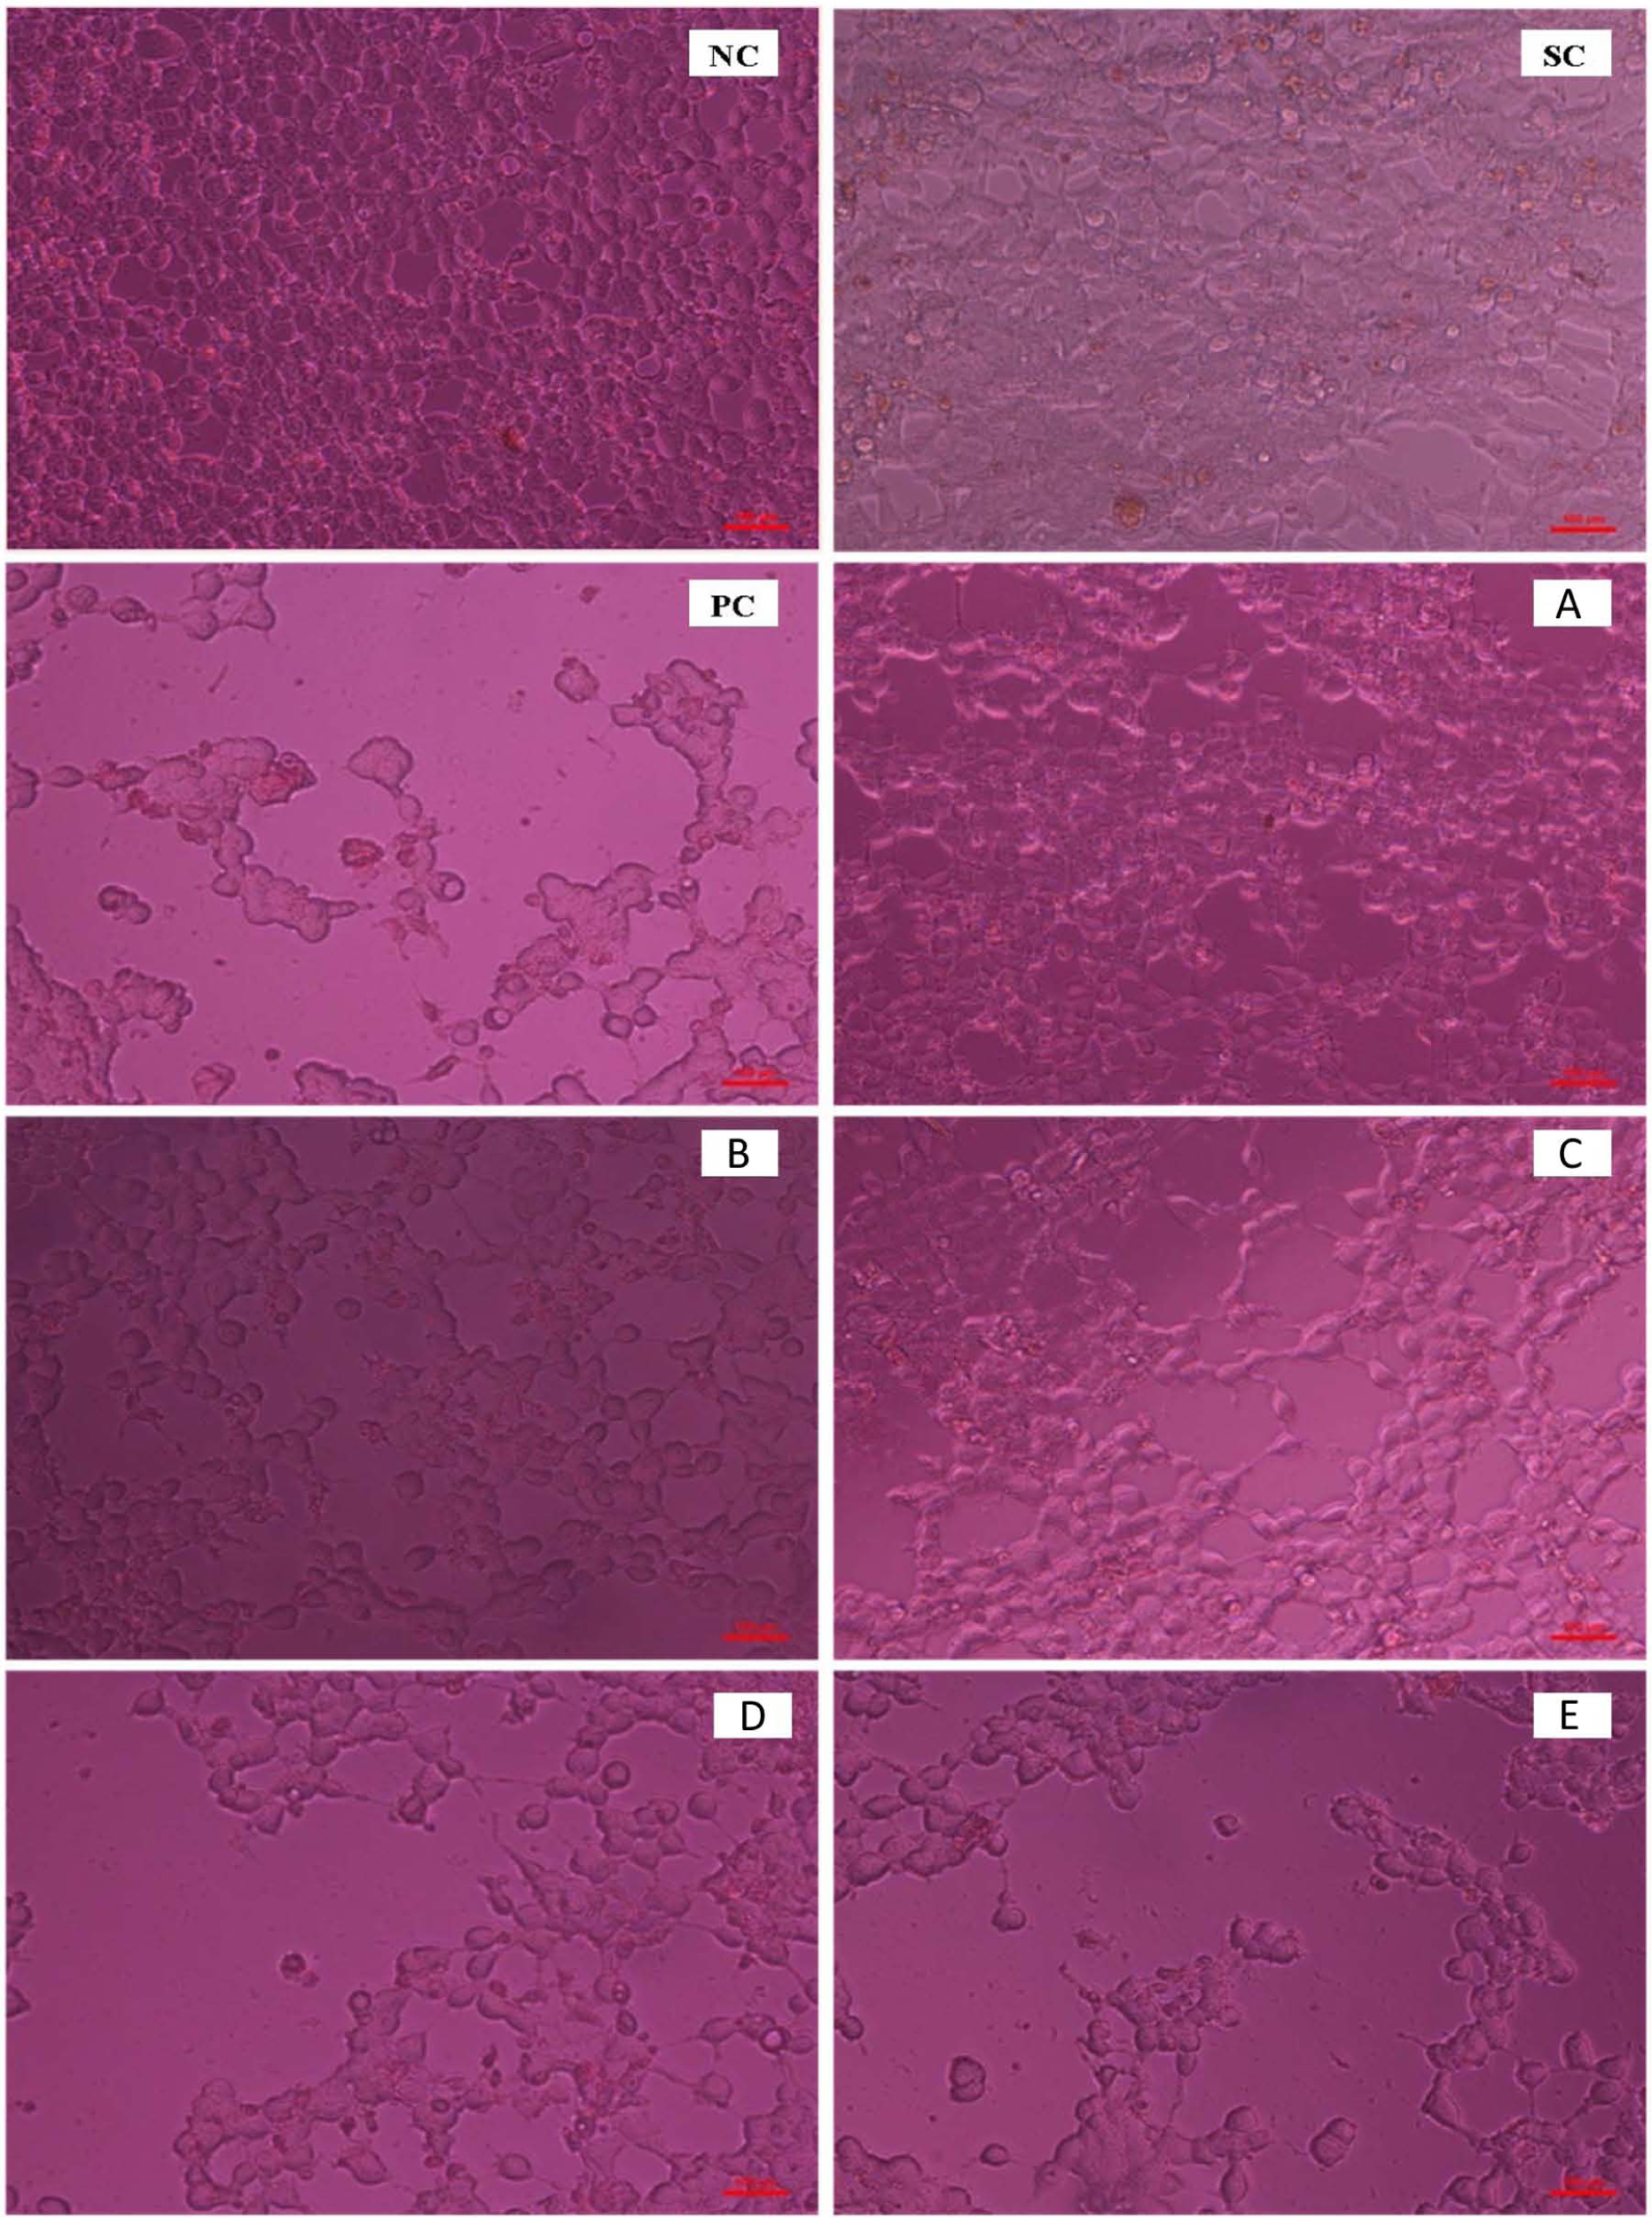
Cell line (MCF-7) treated with AQCE at (A) 20 µg/mL, (B) 40 µg/mL, (C) 60 µg/mL, (D) 80 µg/mL, and (E) 100 µg/mL.
To investigate the effect of AQCE on the morphology of apoptotic cells, Hoechst 33258 (HO) and acridine orange/ethidium bromide (AO/EB) staining were used. Cells stained with HO after treatment with different concentrations (50 and 100 µg/mL) of AQCE for 48 hours and marked morphological changes indicative of cell apoptosis were observed, including chromatin condensation and fragmentation in MCF-7 cells (Figure 4A, C, and E).

Apoptosis assay by Hoechst and acridine orange/ethidium bromide. (A and B) MCF-7 control cells. (C and D) MCF-7 cells treated with 50 µg/mL of AQCE. (E and F) MCF-7 cells treated with 100 µg/mL of AQCE.
AO/EB staining shows a concentration-dependent increase of apoptosis on treatment with AQCE, relative to the negative control. Cells stained green represent viable cells, with fragmented nucleus represented early apoptotic cells, and yellow/green dots of condensed nuclei represent late apoptotic cells. Cells undergoing necrosis stain bright orange/red due to the influx of ethidium bromide and contain multiple orange condensed nuclei. Cells treated with AQCE exhibited characteristic changes of apoptosis, for example, cell shrinkage, nuclear condensation, and fragmentation and formation of apoptotic bodies. Cells treated with 50 µg/mL of AQCE show signs of early apoptosis (Figure 4D). On the other hand, cells treated with 100 µg/mL of AQCE showed similar features but with extra features of formation of apoptotic bodies (Figure 4F).
Effect of AQCE on DNA Fragmentation in MCF-7 Cells
An important feature of cell apoptosis is the fragmentation of genomic DNA. To elucidate whether AQCE decreased cell survival by induction of DNA fragmentation, genomic DNA was isolated from MCF-7 cells following exposure to different concentrations of AQCE and the percent DNA fragmentation was estimated. AQCE treatment led to DNA fragmentation in a dose-dependent manner (Figure 5). In comparison, the DNA from untreated cells did not exhibit any fragmentation.

Effect of AQCE on DNA fragmentation in MCF-7 cells
In Vivo Studies
Effect of AQCE on DMBA-induced mammary carcinoma
The multiplicity and the incidence of the macroscopic lesions were calculated. The effect of AQCE on DMBA-induced mammary carcinoma incidence and multiplicity is shown in Table 1. Tumor multiplicity was significantly decreased to 42.91% with AQCE compared with DMBA-treated group 2. The DMBA-treated group showed 100% tumor incidence, whereas AQCE-treated groups showed a marked reduction of tumor incidence of 62.5%.
Effect of AQCE on DMBA-Induced Mammary Carcinogenesis a .
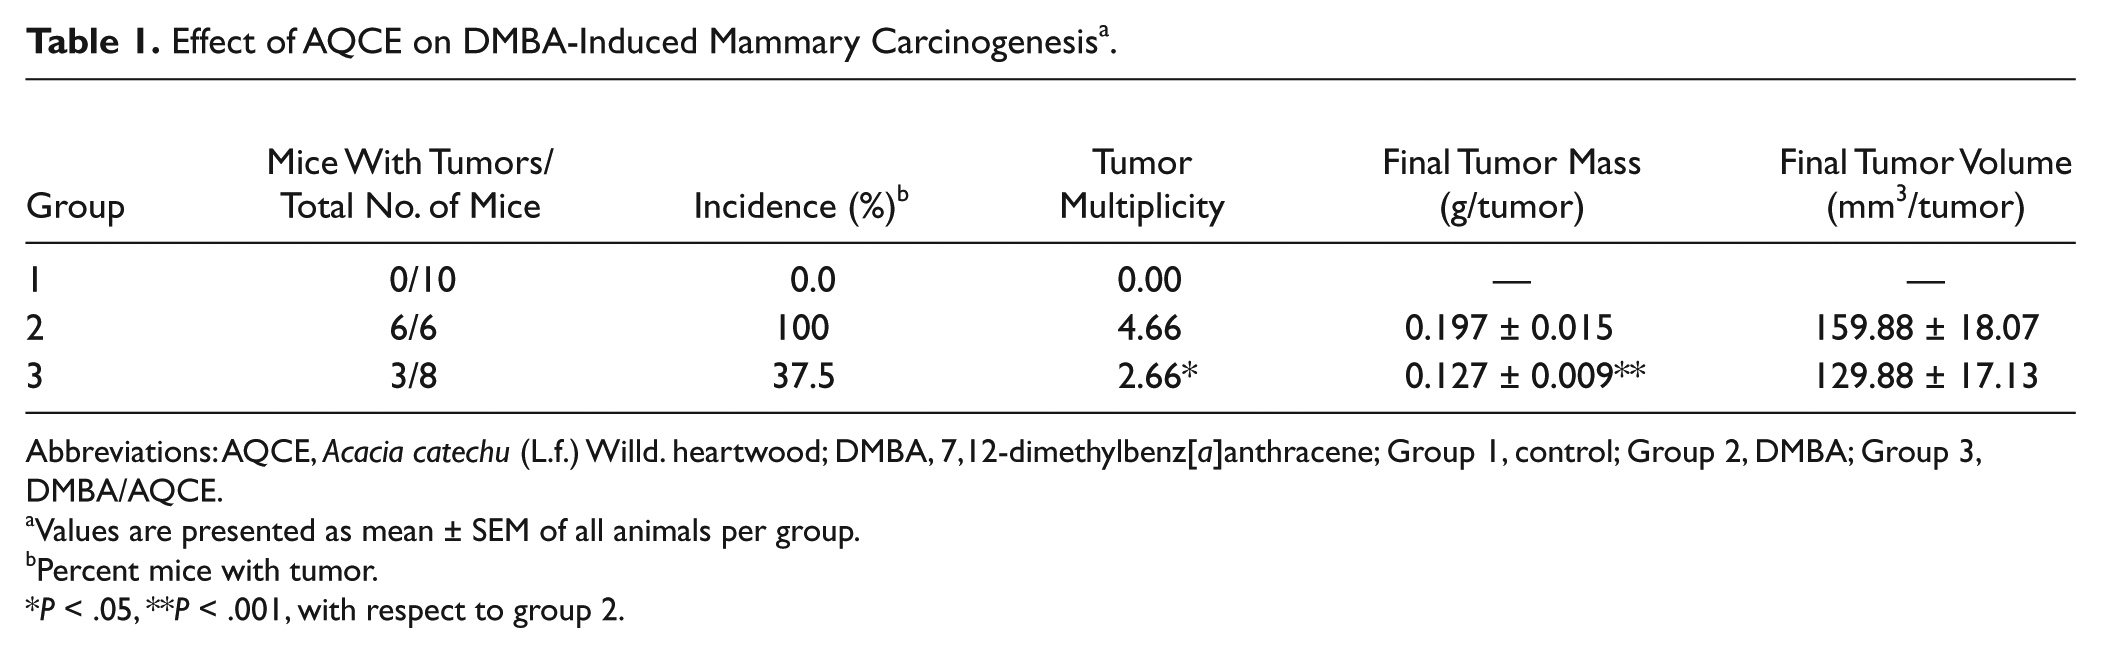
Abbreviations: AQCE, Acacia catechu (L.f.) Willd. heartwood; DMBA, 7,12-dimethylbenz[a]anthracene; Group 1, control; Group 2, DMBA; Group 3, DMBA/AQCE.
Values are presented as mean ± SEM of all animals per group.
Percent mice with tumor.
P < .05, **P < .001, with respect to group 2.
The mean tumor volume for mice in group 2 was 159.88 mm3. On treatment with AQCE (group 3), it was found to decrease to 129.88 mm3. The survival rate of mice decreased in DBMA-treated mice in comparison with the vehicle-treated group. Survival of the AQCE-treated group was higher (80%) in comparison with the DMBA-treated group (60%; Table 1). The data on change in body weight in the various groups are given in Figure 6. There was a significant decrease (P < .001) in body weight of DMBA-treated animals (group 2) in comparison to control animals. On AQCE treatment, a significant increase (P < .001) in body weight was observed as compared to DMBA-treated animals (group 2).

Effect of the aqueous extract of Acacia catechu heartwood (AQCE) on the average body weight of mice.
Histopathological observations
Normal morphology of the mammary tissue was observed in all the control animals (Figure 7A). In the animals treated with DMBA (group 2), the mammary tissue showed the features of ductal hyperplasia, cyst formation, and proliferative lesions (Figure 7B and C). On treatment with AQCE in group 3 animals, a histological profile similar to the normal mammary tissue was observed (Figure 7D).

Histopathological alterations in mammary tissue with AQCE treatment.
Effect of AQCE on the TSA and LASA levels in serum and liver tissue
The results of TSA and LASA levels in the serum and mammary tissue are depicted in Table 2. In serum, TSA and LASA levels were increased significantly (P < .001) in DMBA-treated animals (group 2) in comparison to control animals (group 1). AQCE treatment significantly reduced TSA (P < .001) and LASA (P < .001) levels as compared to animals treated with DMBA only. In mammary tissue, the animals treated with DMBA only showed a significant increase (P < .001) in TSA and LASA levels in comparison to control animals. On AQCE treatment, the TSA and LASA levels were found to be decreased significantly (P < .001) in comparison to DMBA-treated animals.
Effect of AQCE on TSA and LASA Levels a

Abbreviations: AQCE, Acacia catechu (L.f.) Willd. heartwood; DMBA, 7,12-dimethylbenz[a]anthracene; TSA, total sialic acid; LASA, lipid-associated sialic acid; Group 1, control; Group 2, DMBA; Group 3, DMBA/AQCE.
Data represent the means ± SEM in each group.
P < .001 versus vehicle treated and DMBA or DMBA/AQCE. Comparisons were made between group 1 and group 2 mice and between group 2 and group 3 mice.
Effect of AQCE on the lipid peroxidation and nitrite levels in mammary tissue and liver mitochondria
The results showed a significant increase in MDA levels in DMBA-treated animals (group 2) as compared to control animals (group 1; P < .001) in both the mammary gland and liver mitochondria (Table 3). On AQCE treatment (group 3), a significantly decrease (P < .001) in MDA levels with respect to DMBA-treated animals was observed. The nitrite levels in both the mammary tissue and liver mitochondria increased significantly in DMBA-treated animals (P < .001; Table 3). However, the animals treated with AQCE showed a significant decrease (P < .001) in nitrite levels with respect to the animals treated with DMBA only.
Effect of AQCE on Oxidative Stress Markers in Mammary Tissue and Liver Mitochondria a
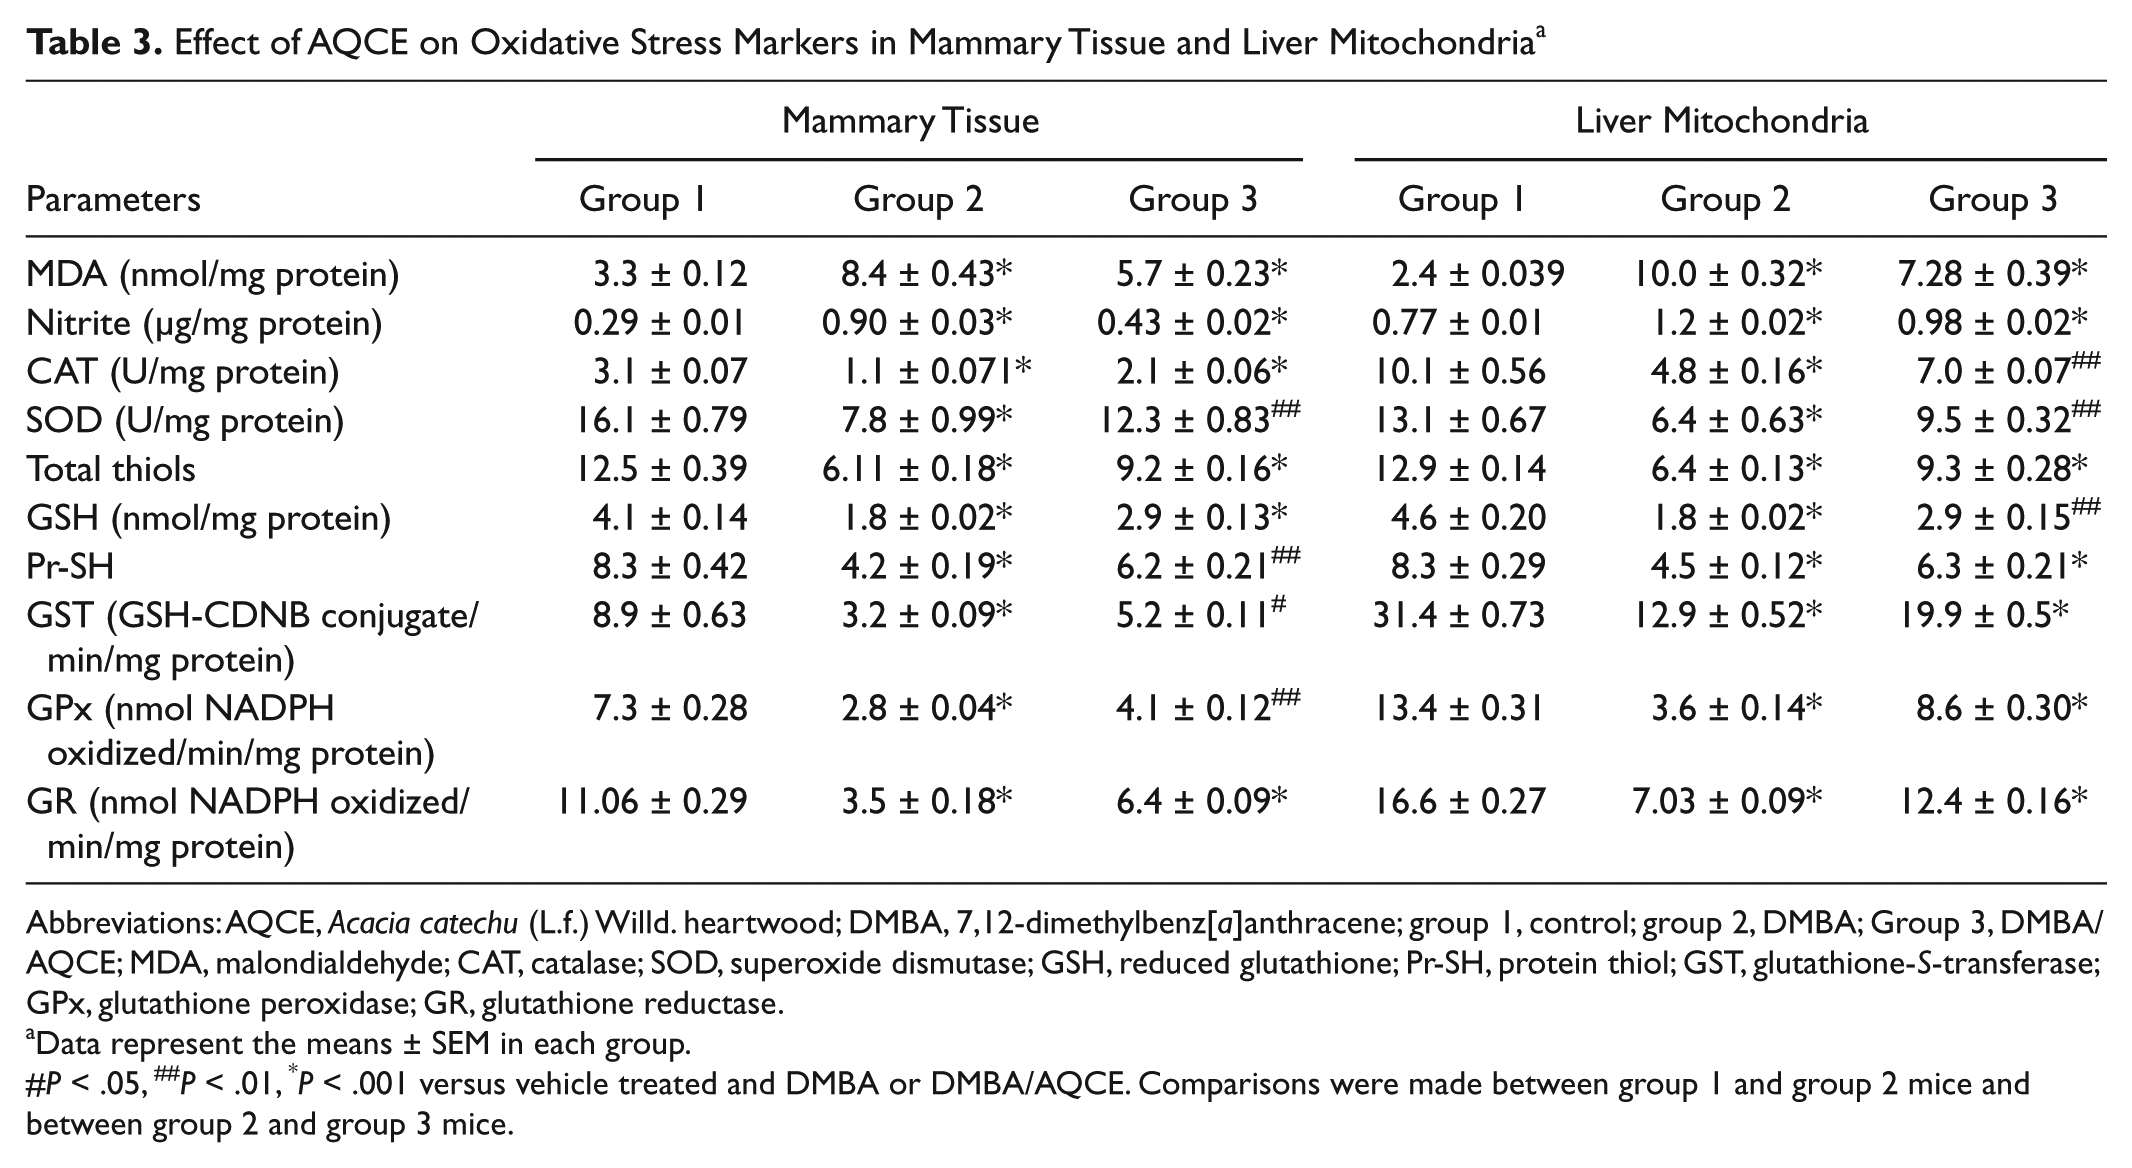
Abbreviations: AQCE, Acacia catechu (L.f.) Willd. heartwood; DMBA, 7,12-dimethylbenz[a]anthracene; group 1, control; group 2, DMBA; Group 3, DMBA/AQCE; MDA, malondialdehyde; CAT, catalase; SOD, superoxide dismutase; GSH, reduced glutathione; Pr-SH, protein thiol; GST, glutathione-S-transferase; GPx, glutathione peroxidase; GR, glutathione reductase.
Data represent the means ± SEM in each group.
P < .05, ##P < .01, *P < .001 versus vehicle treated and DMBA or DMBA/AQCE. Comparisons were made between group 1 and group 2 mice and between group 2 and group 3 mice.
Effect of AQCE on the antioxidants status in mammary tissue and liver mitochondria
The results of the antioxidant levels are depicted in Table 3. A significant decrease in SOD and CAT activity was observed in DMBA-treated animals as compared to control animals (P < .001) in both mammary tissue and liver mitochondria. On AQCE treatment, a significant increase (P < .01) in SOD activity was observed in both mammary tissue and liver mitochondria with respect to DMBA-treated (group 2) animals. A significant increase in CAT activity was observed with respect to DMBA-treated (group 2) animals in both the mammary tissue (P < .001) and liver mitochondrial fraction (P < .01).
A significant decrease (P < .001) in the levels of reduced GSH, T-SH, and Pr-SH content in both the mammary tissue and liver mitochondria was observed in DMBA-treated (group 2) animals. Administration of AQCE in group 3 animals caused a significant increase in T-SH (P < .001) in both mammary and liver mitochondria. A significant increase in GSH activity was observed with respect to DMBA-treated (group 2) animals in both the mammary tissue (P < .001) and liver mitochondria (P < .01). Pr-SH level was increased significantly in AQCE-treated animals in mammary tissue (P < .01) and liver mitochondria (P < .001; Table 3).
On the other hand, levels of GST, GPx, and GR were significantly decreased in DMBA-induced mammary carcinoma (P < .001; Table 3). On AQCE treatment, GST level was increased significantly in mammary tissue (P < .05) and liver mitochondria (P < .001). A significant increase (P < .001) in GPx and GR activities was observed with respect to DMBA-treated (group 2) animals in both the mammary tissue and liver mitochondria.
Protein expression analysis of p53, AP-1, NF-κB by ELISA
A significant increase (P < .001) in the level of p53, c-jun, and p65 was observed in DMBA-treated (group 2) animals as compared to the control group, whereas a significant decrease (P < .001) was observed in the level of p53, c-jun, and p65 in DMBA/AQCE-treated animals (group 3) as compared to DMBA-treated animals of group 2 (Figure 8).
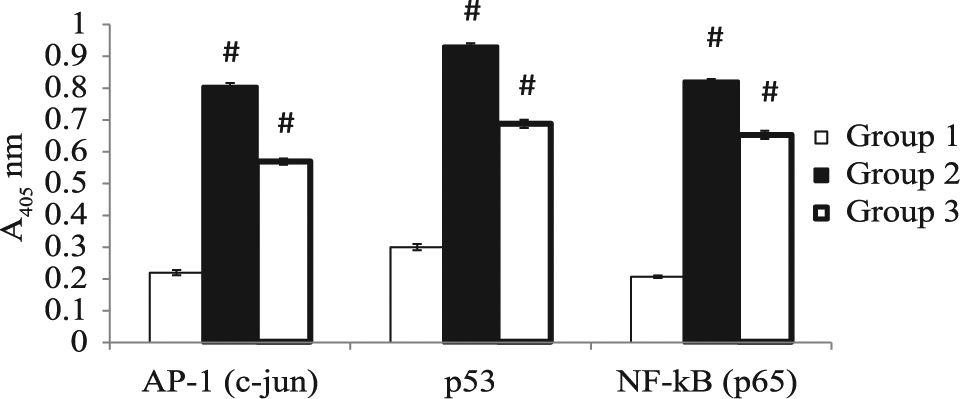
Quantitative protein expression in different groups by ELISA
Discussion
Breast cancer is the second most common cancer worldwide, the fifth most common cause of cancer death, and the leading cause of cancer death in women. The global burden of breast cancer exceeds all other cancers, and the incidence rates of breast cancer are increasing. 32 Research in breast cancer now extends in many directions, from identification of transcription factors that predispose to breast cancer, to cellular models for pre-neoplastic disease, investigation of the tumor and its local environment, and identification of risk factors for the development of breast cancer and possible models of breast cancer prevention including the use of chemopreventive agents. In recent years, much interest has been focused on the identification of natural products that are capable of reducing the tumorigenicity associated with environmental carcinogens. In the present study, the cytotoxic effect of AQCE was assessed against MCF-7 cells and further chemopreventive potential of (+)-catechin-rich AQCE was screened against DMBA-induced mammary carcinoma in Balb/c mice by monitoring the percent incidence of tumor, tumor multiplicity, tumor volume, body weight, and by analyzing the status of tumor markers, lipid peroxidation, and antioxidants. Furthermore, various transcription factors such as p53, c-jun, and NF-κB were investigated to explore their role in the chemopreventive effect of AQCE against DMBA-induced mammary carcinogenesis.
Imbalances in proliferation and apoptosis, by favoring the promotion of genetically altered cells in the breast tissue, play a role in breast cancer promotion. AQCE induces a marked concentration-dependent inhibition of MCF-7 cell proliferation in various cytotoxicity assays (MTT, SRB, and LDH). The treatment of MCF-7 with AQCE resulted in marked morphological changes. It was possible to observe better the difference between early and late apoptosis in the MCF-7 cells, showing that AQCE exhibited a larger concentration response effect for late apoptosis and a smaller effect for early apoptosis, in both of the studied concentrations. AQCE treatment also showed a significant increase in dose-dependent DNA fragmentation, suggesting an increase in cell death and efficacy of the treatment regimens.
The in vivo chemopreventive study in mice showed less gain in body weight in the carcinogen-treated animals. This observation confirms the fact that, during cancer progression, there is a decrease in body weight. 33 An increase in body weight of the animals treated with AQCE suggests its beneficial effect in carcinogenesis. Cyst formation, ductal hyperplasia, and cell proliferation were observed in DMBA-treated group 2 animals. On treatment with AQCE in group 3, the histological examination showed the features of a normal mammary gland with normal ductal morphology. As ductal hyperplasia is closely associated with progression of carcinogenesis, 34 a reversion of hyperplastic alterations suggests the chemopreventive efficacy of AQCE in chemoprevention of DMBA-induced mammary carcinogenesis. Various studies have reported the significance of sialic acid as a tumor biomarker. An aberrant glycosylation process in tumor cells contributes to the biosynthesis of certain oligosaccharides; hence, malignant or transformed cells contain increased sialic acid residue on their surfaces. 35 A significant increase in the TSA and LASA levels was observed in DMBA-treated animals. The increase may be related to the enhanced activity of sialidase enzyme in the tumor formation that causes the cleavage of sialic acid. A marked reduction in the TSA and LASA levels indicated the protective potential of AQCE.
Reactive oxygen species normally exist in all cells in balance with antioxidants. Oxidative stress results due to excess production of ROS or depletion of antioxidants or both. During oxidative stress, malonaldehyde and other aldehydes are formed in the biological system as a result of lipid peroxidation. 36 The current study showed an elevated level of MDA in both the mammary tissue as well as liver mitochondria in the animals treated with DMBA. The increased level of lipid peroxidation may be due to the poor antioxidant defense or inactivation of antioxidant enzymes in cancerous tissues. A significant decrease in MDA levels was observed on AQCE treatment, suggesting its modulating effect on the antioxidant system and ultimately a protective potential against mammary carcinogenesis.
Nitric oxide radical (NO·) plays an important role in physiological and pathological processes. An increased nitrite level is generally associated with the process of carcinogenesis. 37 The present results showed that nitrite levels (an indicator of NO·) were significantly increased in the DMBA-treated group. This increase may be related to an increase in NOS (nitric oxide synthase) activity. A significant decrease in nitrite levels was observed in both mammary tissue and liver mitochondria on AQCE treatment.
The body’s antioxidant defense systems operate by scavenging ROS to prevent oxidative stress. The antioxidant enzymes (SOD and CAT) act as the first line of cellular defense against oxidative damage. 38 DMBA administration decreased the activities of these antioxidant enzymes in the mammary tissue and liver mitochondria, which may be related to saturation of SOD with superoxide radicals in tumor cells or a decrease or loss of expression of SOD. A decrease in SOD activity will result in decreased production of H2O2, which in turn affects CAT activity. The second line of cellular defense includes the glutathione antioxidant system that plays an important role against free radicals. 39 Reduced glutathione and its dependent enzymes, GPx, GR, and GST, serve as reliable markers of chemoprevention. 40 The present study showed significant decreases in the activities of GPx, GR, and GST in mouse mammary tissue and liver mitochondria after DMBA exposure, resulting in considerable decline in the activities of these enzymes. In response to oxidative stress, GPx works in tandem with CAT to scavenge excess H2O2 and lipid peroxides.41,42 However, unlike CAT activity, GPx activity also depends on the balance between the levels of GSH and GSSG. 43 Thus, a decrease in GPx activity may be implicated in both free radical–dependent inactivation of enzyme and depletion of its cosubstrates, that is, GSH and NADPH. The observed decrease in GPx activity may also be due to reduced availability of GSH. A significant decrease in GR activity may be attributed to the impaired conversion of GSSG into GSH and thus balancing the GSH/GSSG ratio. 44
At the same time, thiol groups have the ability to act as reducing agents and thus play a central role in coordinating the antioxidant defense system. 45 The present findings revealed alterations in the levels of T-SH, GSH, and Pr-SH in DMBA-treated animals. The decrease in T-SH content might be attributed to reduction in GSH levels and/or change in Pr-SH groups. The observed decrease in GSH levels may be due to diminished activity of GR, which is a crucial enzyme for maintaining the GSH/GSSG ratio in the cell. The restoration in the activities of these enzymes after AQCE administration indicated that AQCE acts as an effective antioxidant.
Tumor suppressor p53 is a redox-active transcription factor, which organizes and directs cellular responses in a variety of stresses that lead to genome instability. ROS generated by cell products or by-products can act as signaling molecules, or as cell toxicants. Cellular generation of ROS is central to redox signaling, and recent studies have shown that each cell’s concentration and distribution of p53 has a distinct cellular function and that ROS acts as the both the upstream signal that causes the activation of p53 and as a downstream factor that mediates apoptosis. 46 Mutations of p53 are present in up to 50% of invasive breast cancers, and its loss of function is associated with a high proliferation index and poor clinical outcome. 47 Due to its preeminent role in regulating the cell cycle, it is an attractive target for cancer therapeutics. Many chemopreventive agents are known to exert their anticancer effects through the induction of apoptosis via p53-dependent mechanisms. In the present investigation, a significant increase in the p53 expression was seen in DMBA-treated (group 2) animals. However, a significant decrease in p53 expression was observed in DMBA/AQCE-treated (group 3) animals.
AP-1 is another transcription factor that regulates the expression of several genes that are involved in cell differentiation and proliferation. Expression of the various AP-1 factors is differentially regulated during cell-cycle progression and in response to many stimuli. The upregulation of the c-jun protein, the principal component of the AP-1 transcription factor, is implicated in tumor promotion as well as malignant transformation. 48 Many studies have investigated the regulation of gene expression by oxidants, antioxidants, and other determinants of the intracellular reduction–oxidation (redox) state. AP-1 has been identified to be regulated by the intracellular redox state. 49 In the present study, a significant increase in the c-jun expression was observed in DMBA-treated (group 2) animals. However, a significant decrease in c-jun expression was observed in DMBA/AQCE-treated (group 3) animals. Among various transcription factors, NF-κB plays a pivotal role in initiation and progression of cancer as it regulates large number of genes involved in inflammation, cell survival, cell proliferation, invasion, angiogenesis, and metastasis. 50 ROS production plays a critical role in signaling the cellular autoimmune/inflammatory response by activating the transcription factor, NF-κB.49,51 In the present study, a significant increase in NF-κB expression was observed in DMBA-treated (group 2) animals. However, a significant decrease in NF-κB expression was observed in DMBA/AQCE-treated (group 3) animals.
Conclusion
From the present study, it can be inferred that AQCE exerts an anticancer potential, which may be through modulating the levels of lipid peroxidation and promoting the enzymatic and nonenzymatic antioxidant defense system. The AQCE treatment also resulted in downregulation of NF-κB, p53, and AP-1 expression in DMBA-induced mammary carcinogenesis.
Footnotes
Declaration of Conflicting Interests
The authors declared no potential conflicts of interest with respect to the research, authorship, and/or publication of this article.
Funding
The authors received no financial support for the research, authorship, and/or publication of this article.