
Abstract
We aimed to explore the value and interpretability of a multimodal deep learning model integrating optical coherence tomography angiography (OCTA) and electronystagmography (ENG) for the early screening of Alzheimer’s disease (AD) and mild cognitive impairment (MCI). A total of 250 subjects were retrospectively recruited. OCTA images, ENG signals and neurocognitive scores were collected from all subjects. The model had an area under curve of 0.85 for the independent validation cohort, with the sensitivity and specificity of 0.73 and 0.90 at the optimal cut-off of receiver operating characteristic curve, respectively. According to Gradient-weighted Class Activation Mapping analysis, the model focused on regions with reduced microvascular density. SHapley Additive exPlanations analysis revealed that saccade accuracy (left eye), saccade latency (right eye) and smooth pursuit gain (left eye) contributed the most to the model. The multimodal model effectively improves early, non-invasive screening of AD/MCI with good interpretability.
Introduction
Alzheimer’s disease (AD), a neurodegenerative disease, is characterized by a progressive decline in cognitive function, with the clinical intervention window lagging behind the emergence of brain lesions in most cases. 1 Realizing ultra-early identification of AD and mild cognitive impairment (MCI) under non-invasive conditions is currently a research emphasis in the intersection of neuroscience and artificial intelligence (AI). 2 Ocular images and neurophysiological signals serve as an “explicit window” of brain function and thus have gradually embodied importance in early screening of cognitive impairment in recent years. 3 Optical coherence tomography angiography (OCTA) visualizes the retinal microvascular network with high resolution, which outperforms conventional ocular imaging in AD-related variations including the enlargement of the foveal avascular zone (FAZ) and declines in the vascular density of superficial capillary plexus (SCP)/deep capillary plexus (DCP). 4 Electronystagmography (ENG) serves as a functional indicator of ocular movement, which has been extensively applied in such fields as brainstem lesions and vertigo classification, and evidence shows that its parameters like saccade latency and smooth pursuit gain can reflect early abnormalities in the central nervous pathway. 5 However, existing studies mainly focus on the recognition task of a single modality, which is hard to fully cover the early structural and functional characteristics of AD. Additionally, OCTA can reveal local microcirculatory changes, but it is unable to represent the dynamic state of brain function. ENG is able to quantify abnormalities in eye movement reflex pathways, but it fails to capture stable histomorphological information. Hence, the cross-modal modeling of OCTA and ENG is expected to establish a more comprehensive and robust neurodegenerative screening model from the structure-function dual pathway.6,7
For the past few years, deep learning has performed close to human eyes in such tasks as OCTA image segmentation and diabetic retinopathy screening. 8 Likewise, convolutional neural networks (CNNs) have also been employed for automatic extraction of video nystagmus signals, so as to realize fast and objective differentiation of vertigo. 9 However, existing studies have mostly revolved about the framework of “single mode-single output”, and relevant models do not collaboratively utilize chronological ENG features and OCTA blood flow structure information, restricting their clinical application in early screening of individuals at risk of neurological dysfunction. Moreover, the unexplainability of black-box models still acts as a significant obstacle to the implementation of AI – clinicians are required to clarify “what does the model focus on” and “why make a judgment” in most cases. Gradient-weighted Class Activation Mapping (Grad-CAM) and SHapley Additive exPlanations (SHAP) emerging in recent years have offered visual paths,10,11 which, however, lack systemic application in cross-modal scenarios.
Given this, a set of multimodal explainable deep learning frameworks were constructed based on the OCTA-ENG data from 250 subjects in the present study. As for the image branch, 1280-dimensional (1280-D) vascular semantic features were extracted using a pre-trained EfficientNet-B0 network. Structured ENG features were modeled in a parallel branch, and the complementary information from the 2 modalities was subsequently integrated at the decision level using a soft voting–based fusion strategy. Besides the fusion branch, ENG temporal rules were captured with the help of the independently trained eXtreme Gradient Boosting (XGBoost) classifier. Then, Soft Voting was adopted to integrating the advantages of the 2 modalities to raise the stability of anomaly detection. Next, the microvascular regions of interest of the model in OCTA images were pinpointed by Grad-CAM. Additionally, SHAP global/local analysis was completed to quantify the positive/negative contribution of each ENG parameter to output probability, so as to enhance model transparency. Furthermore, high-quality images/signals were selected from the complete cohort for model training-validation, avoiding overfitting while maintaining data quality. The present study not only renders novel thoughts for the application of multimodal AI in the field of neuro-ophthalmology early screening, but also enhances the applicability of the model through interpretability analysis in clinical practice.
Materials and Methods
Study Design and Subjects
This retrospective cross-sectional study included 250 subjects herein from January 2024 to June 2025, including 150 patients clinically diagnosed with mild-moderate AD or MCI (case group) and 100 healthy volunteers with comparable in age and gender (control group). All subjects signed the informed consent form, and the study protocol was approved by the ethics committee of the hospital. The detailed participant enrollment and exclusion process is illustrated in Figure 1. Flowchart of participant enrollment and selection
Inclusion and Exclusion Criteria
The implemented inclusion criteria were as follows: (1) subjects aged 60-80 years old, (2) those tested with a standardized cognitive assessment tool [the Mini-Mental State Examination (MMSE) or the Montreal Cognitive Assessment (MoCA)] and meeting one of the following diagnostic criteria12,13: mild-moderate AD: MMSE score (depending on education levels) < 17 points for illiterates, <20 points for primary school graduates and <24 points for secondary school graduates or above or MoCA score <18 points. MCI: MMSE score of 24-26 points or MoCA score of 18-26 points. Healthy controls: MMSE score ≥27 points and MoCA score ≥27 points, with normal cognitive function and no complaints or objective evidence of cognitive impairment, (3) those offering clear OCTA images, (4) those with OCTA image quality score ≥7 points (full score: 10 points) and no obvious motion artifact or occlusion in the image, and (5) those able to complete ENG and obtaining at least 15 key structured characteristic indicators (saccade, smooth pursuit, fixation, etc.).
The following exclusion criteria were adopted: (1) subjects with a history of stroke plus focal neurological signs, (2) those with traumatic brain injury, brain tumor, epilepsy, Parkinson’s disease, encephalitis, or other neurological diseases possibly affecting cognitive function, (3) those with systemic diseases potentially influencing cognitive function, including severe hepatic or renal insufficiency, severe anemia, vitamin B12 deficiency, and special infections (such as syphilis), (4) those with diseases probably impacting retinal structure or blood flow, such as glaucoma, age-related macular degeneration, and retinal detachment, (5) those with the best corrected visual acuity <0.5 or refractive error >−6.0 D or random intraocular pressure >21 mmHg, or (6) those unable to complete cognitive assessment or eye examination.
Acquisition and Preprocessing of OCTA Images
An imaging system (Dream OCT, Intalight, USA) was utilized to perform OCTA scans on the macular region (3 × 3 mm) of all patients, with an image size of 304 × 304 pixels and a resolution of 10 μm. OCTA is capable of visualizing retinal microvessels with high resolution, which has been proved to realize early identification of central vascular changes. 14 Two imaging levels, namely SCP and DCP, were selected for analysis. This is because SCP is suitable for stable and reliable feature extraction owing to its clear vision and stable textures, while DCP is more sensitive to subtle structural variations in microvessels, which has been confirmed to have close associations with early pathologic changes of AD. 15
All original images were automatically denoised and segmented by built-in software of the instrument and then exported in the lossless PNG format. Next, images were subjected to the following preprocessing: pixel adjustment to 224 × 224 to meet the input requirements of deep learning, and image enhancement, including random flipping, rotation, and luminance contrast adjustment (±20%), to enhance the generalization performance of the model and reduce the risk of overfitting.
ENG and Feature Extraction
Saccade (5°/10°), smooth pursuit (0.2-0.4 Hz), and spontaneous nystagmus were recorded using the EyeSeeCam system (Interacoustics, Denmark). Fifteen quantitative indicators were automatically calculated by the EyeSeeCam system, including saccade latency, saccade peak velocity, saccade accuracy, pursuit gain, nystagmus amplitude and angular velocity. These indicators have been proved effective in machine learning for discriminating vestibular-central disorders. 16 Structured data were normalized (z-score), and the missing values were filled in by the median method (missing ratio <1%). To strictly avoid statistical bias arising from the correlation between bilateral eyes, the subject was defined as the unit of analysis (n = 250) rather than the individual eye. Data from the left and right eyes were treated as distinct input features and concatenated into the feature vector for each subject, thereby preserving the inter-ocular physiological correlations within the model’s feature learning process.
Establishment and Training of the Deep Learning Model
The overall architecture and workflow of the proposed multimodal deep learning framework are illustrated in Figure 2. Overview of the proposed multimodal OCTA-ENG deep learning framework
Image Branch Network Construction
Extraction of image characteristics was accomplished using the EfficientNet-B0 network pre-trained on ImageNet. In brief, after freezing the front layer of the network, only the last 2 convolution modules were fine-tuned to accommodate the specific structural features of OCTA images. The characteristics were output in 1280-D, which were further mapped to feature vectors by the fully connected layer. 17
ENG Structured Branch Modeling
The fifteen structured ENG features were processed by the XGBoost model and MLP neural network (containing 2 hidden layers, with 64 and 128 nodes, respectively, and a dropout rate of 0.3) to fully capture their potential nonlinear relationships with disease state.
Cross-Modal Fusion Mechanism
Soft Voting strategy was employed to fuse the model output probabilities of the above 2 modalities, with each modality given an equal weight (0.5), to construct a cross-modal deep learning model, aiming to raise classification stability and performance. 18
Training Strategy and Parameter Settings
Optimizer: Adam, with an initial learning rate of 1e−4. Loss function: Binary Cross Entropy (BCEWithLogitsLoss). The batch size was set at 4. The Early Stopping mechanism was adopted: The training was terminated if no reduction was observed in the loss function of the validation cohort for 5 consecutive rounds. All training tasks were carried out on a computer platform equipped with NVIDIA RTX 3060 GPU.
Interpretability Analysis
Grad-CAM: 7 × 7 heat maps were generated in the final convolutional layer of EfficientNet, which were then bilinearly interpolated to 224 × 224 and superimposed on original images to illuminate the region of interest of the model. 19
SHAP: TreeSHAP was utilized to calculate the global feature importance and local waterfall interpretation of the structured model to quantify the positive/negative contribution of each indicator to predicted output. 20
Statistical Analysis
Python 3.10 (scikit-learn, Matplotlib, etc.) and R 4.2.1 were employed for statistical analysis. Continuous variables were expressed by mean ± standard deviation (SD), while categorical variables were expressed as percentages. The t-test or Mann-Whitney U test and chi-square test were conducted for intergroup comparisons of continuous and categorical variables, respectively, with P < 0.05 denoting a difference of statistical significance. The data were randomly assigned into a training cohort and an independent validation cohort (80%: 20%), with the former for robustness assessment using five-fold cross-validation, and the latter reserved exclusively as an independent validation cohort for final performance evaluation. The major assessment indicators included area under the receiver operating characteristic (ROC) curve (AUC), accuracy, sensitivity, specificity, precision, and F1-score. Additionally, ROC curve and confusion matrix were plotted.
Results
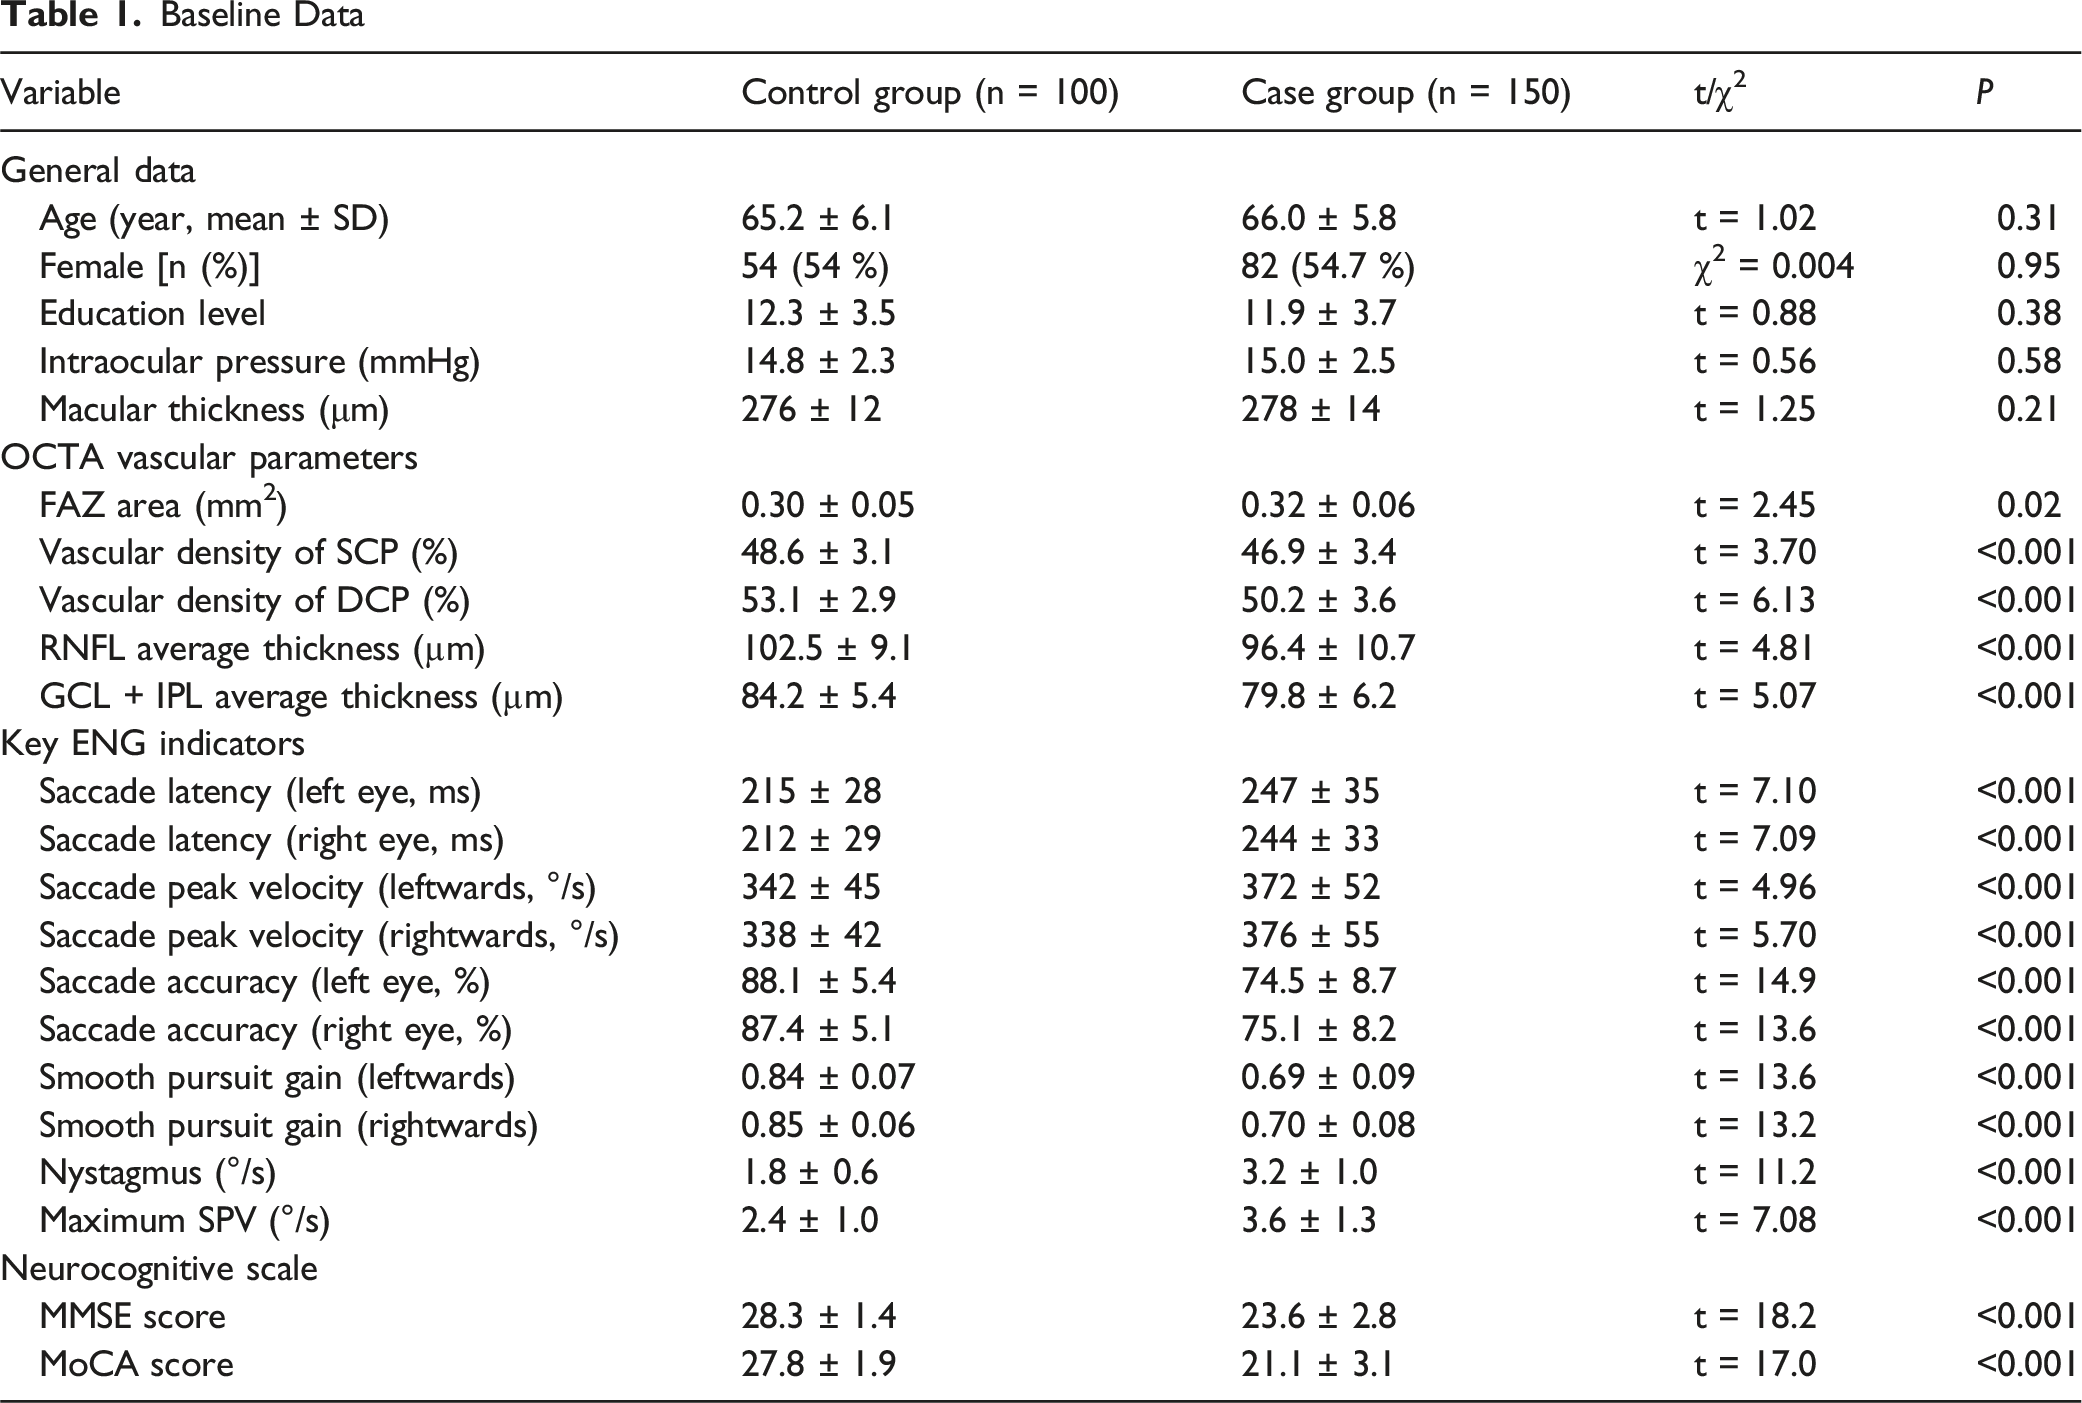
Baseline Clinical Data
Baseline Data
Evaluation of Classification Performance of the Model
The fusion model exhibited excellent classification ability on the independent validation cohort. The confusion matrix revealed that the model had an identification accuracy of 90% for the control group (Normal) and 72% for the case group (non-Normal) (Figure 3A). The results of ROC curve analysis further proved the overall performance of the model, with an AUC reaching 0.85. At the optimal cut-off point, the model displayed a sensitivity of 0.73 and a specificity of 0.90 (Figure 3B). The above results demonstrate that the multimodal fusion model has high specificity and sensitivity in early screening of AD and MCI, exhibiting strong potential in clinical application. Consistent performance across five-fold cross-validation within the training cohort further supported the robustness and stability of the proposed model (mean AUC = 0.87 ± 0.03 and mean accuracy = 81.2% ± 4.5%). Assessment of classification performance of the model on the validation cohort. (A): Confusion matrix of the validation cohort (%). (B): ROC curves of the validation cohort
Visualization of Regions of Interest in Images (Grad-CAM)
To better understand how the model makes decisions, Grad-CAM and SHAP model interpretation analyses were conducted separately. In a typical non-Normal OCTA image, the Grad-CAM heat map visualized the regions of interest of the fusion model in the image when making classification decisions, with warmer colors (red areas) suggesting higher interest (Figure 4). Notably, the model mainly focused on the peri-fovea of the retina and the regions with a low microvascular density, in line with the characteristics of early retinal microcirculation variations in AD patients. This result further confirms that the biological features interested by the model are in accord with the pathological mechanisms reported in the literature.
21
Regions of interest of the model visualized by Grad-CAM (left: original image, right: heat map superimposed)
Global Feature Importance Analyzed via SHAP
To figure out the contribution of structured ENG features to the outputs of the model, SHAP values were employed for overall interpretation. Figure 5 displays the extent to which each feature affects the outputs of the model, revealing that saccade accuracy (left eye), saccade latency (rightwards), and smooth pursuit speed gain (left eye) contributed significantly to the outputs of the model. This implies that these features may be closely correlated with early neurological degeneration. The color represented the associations between the value of features and the discrimination of AD categories. Redder dots indicated larger values, promoting the outcomes predicted by the model to be more likely to non-Normal. Conversely, blue indicated a low value. SHAP beeswarm plot (feature influence ranking)
Local Feature Interpretation by SHAP
The decision-making process of the model on an individual case was further demonstrated. Figure 6 shows the values of ENG characteristics of a patient, as well as the direction and magnitude of their contribution to prediction outcomes (non-Normal) of the model. For instance, saccade accuracy (left eye) reached 94%, posing the greatest impact on the prediction outcome non-Normal (SHAP value: +1.24), which significantly raised the probability of the case being recognized as non-Normal. Other features like smooth pursuit gain (Gain.1) and saccade velocity also had influences on model decisions positively or negatively, respectively. The plot offered a clear and intuitive way to help clinicians understand the process of the model generating prediction outcomes of each individual. SHAP waterfall plot (individual mechanism interpretation)
Discussion
Close relations have been found between retinal microcirculation variations and neurodegeneration, and enlargement of FAZ area and reduction in vascular density of SCP/DCP serve as crucial ocular marks in early AD. 22 In the present study, it was found through baseline analysis that the FAZ area and vascular density of SCP/DCP in the case group were significantly different from those in the control group, consistent with the findings of previous research. 23 This further supports the potential of OCTA in the early diagnosis of AD. Beyond structural retinal alterations, accumulating evidence suggests a close pathophysiological link between retinal microvascular impairment and blood–brain barrier (BBB) dysfunction, given the shared neurovascular unit architecture and barrier properties of the retina and brain. Prior studies have demonstrated that BBB dysfunction plays a critical role in early Alzheimer’s disease by impairing the clearance of neurotoxic substances such as β-amyloid and iron. 24 In particular, APOE ε4 carriers exhibit reduced BBB water exchange efficiency, which is associated with increased cerebral β-amyloid accumulation and iron deposition, highlighting compromised neurovascular clearance mechanisms. 24 Recent imaging studies further suggest that alterations in BBB permeability and water exchange dynamics may precede or accompany microvascular pathology during disease progression.25,26 In this context, retinal microvascular changes detected by OCTA may serve as a non-invasive surrogate marker reflecting underlying cerebral microvascular and BBB-related dysfunction, thereby supporting the biological plausibility of retinal imaging for early AD screening. However, depending solely on structured imaging parameters possibly fails to identify all neurological abnormalities in the early stage of diseases. 27 Thence, in the present study, ENG indicators, especially functional parameters like saccade accuracy and smooth pursuit gain, were innovatively integrated. Significant differences in ENG indicators manifest that patients’ oculomotor control and visual pursuit are affected by the pathological changes of AD, 28 which supplements the information required for early identification of diseases from the functional level.
In the present study, a cross-modal deep learning model fusing OCTA and ENG was established to achieve ultra-early non-invasive screening of AD and MCI. The cross-modal model integrated OCTA image characteristics extracted by the pre-trained EfficientNet-B0 network and structured ENG features processed via attention mechanism. Moreover, the XGBoost classifier was utilized to enhance the ability to capture potential nonlinear relationships among ENG data. ENG parameters may have large individual differences, but their overall discrimination ability is effectively improved after fusion by the machine learning model. The fusion model performed good in classification in the clinical validation cohort, with the specificity, sensitivity and AUC reaching 90%, 72%, and 0.85, respectively. This signifies that cross-modal fusion not only enhances the comprehensive discrimination ability of the model, but also effectively integrates the information of the 2 dimensions (structure and function), making up for the limitations of single-modal models. The AUC of the model constructed in the present study (0.85) is superior to that of OCT single-modal models previously reported, 29 but its accuracy is lower than that of the CNN model for distinguishing AD stages in another study (94.6-97.8%). 30 Nevertheless, the accuracy of the multimodal fusion model ReIU for AD screening is 79%, indicating that the model constructed in the present study has a clinical advantage in specificity (90%). 31 Besides, multimodal biomarkers (OCTA + ENG) are capable of enhancing the accuracy of early diagnosis of AD. 1
From a clinical application perspective, the proposed multimodal OCTA-ENG model is primarily intended as an early, non-invasive screening and risk stratification tool rather than a definitive diagnostic system for AD or MCI. In this context, high specificity is particularly valuable, as it reduces false-positive referrals and unnecessary downstream diagnostic burden, especially in large-scale or resource-limited screening settings. The reported sensitivity and specificity values correspond to a single optimal operating point derived from the ROC curve; however, the model outputs continuous probability scores, allowing flexible adjustment of decision thresholds according to different clinical priorities. For example, lower thresholds may be adopted to improve sensitivity in population-level screening or high-risk enrichment scenarios, whereas higher thresholds may be preferred when minimizing false positives is critical. In addition, cost-sensitive training strategies, such as class-weighted loss functions or asymmetric misclassification penalties, represent promising directions for further improving sensitivity without substantially compromising specificity and will be explored in future studies.
Furthermore, Grad-CAM and SHAP, 2 mainstream tools for interpretability analysis, were adopted in the present study, so as to overcome the common “black box” problem of deep learning models in clinical practice. Grad-CAM analysis intuitively displayed the key retinal microvascular regions of interest of the model when making classification decisions, consistent with the regions of early pathological changes in AD proposed by a previous study. 32 In addition, SHAP analysis further quantitatively exhibited the relative contribution of ENG indicator to the outputs of the model. In particular, saccade accuracy, saccade latency and smooth pursuit gain played a vital role in the discrimination process of the model, which is highly in line with the clinical manifestations of neurological degeneration.33,34 This comprehensive interpretation method combining image region visualization and feature importance analysis significantly enhances the clinical acceptability of models. 35 Specifically, several studies have proved that Grad-CAM technologies are effective in identifying key brain regions of interest of AD diagnostic models,36,37 while SHAP method systematically quantifies the contribution of various clinical features to model decision-making. 38 With respect to ENG features, research has manifested that reduced saccade accuracy is related to impaired striatal function, prolonged saccade latency suggests thalamic dysfunction, and dropped smooth pursuit gain is implicated in abnormalities of the 5-hydroxytryptamine system. 33 The abovementioned findings are highly identical to the pathological mechanisms of neurodegenerative diseases, rendering a biological basis for the interpretability of models. 39 At the same time, such a multimodal interpretation method satisfies the requirements of clinicians for model transparency by simultaneously offering visual regions of interest and feature importance ranking, thus boosting the clinical application of deep learning models in early screening of AD. 40
The present study has the following shortcomings despite some positive results achieved. The model exhibits high specificity, but its sensitivity still needs to be improved, which may be related to data quantity used for model training and data quality. In the future, the sensitivity should be improved by further expanding the sample size and optimizing the model. In addition, a late-fusion strategy based on soft voting was adopted to integrate OCTA and ENG modalities, which prioritizes robustness and interpretability but may not fully capture complex cross-modal interactions at the feature level; exploring feature-level fusion strategies represents a feasible and important direction for future research, particularly in larger cohorts. Besides, ENG data used in the present study mainly are structured parameters. In the current work, structured summary ENG features were intentionally adopted, as these parameters represent standardized clinical outputs that are routinely available in neuro-otological examinations and offer favorable interpretability and robustness in relatively small cohorts. Nevertheless, we acknowledge that incorporating raw or temporal ENG signals using sequence-based or transformer-based models may capture more fine-grained oculomotor dynamics and further improve model performance. Exploring temporal ENG modeling constitutes an important direction for future research and will be investigated in larger datasets to balance performance gains with clinical feasibility and interpretability. In addition, this was a single-center, retrospective study, which may limit the generalizability of the model to other populations, devices, or acquisition protocols. External or multi-center validation will be required in future work to further assess robustness and facilitate broader clinical translation.
Conclusions
To sum up, a deep learning framework based on cross-modal fusion of OCTA and ENG was put forward in the present study for the first time, offering a tool with high stability and transparency for early screening of AD. This structure-function synergistic cross-modal strategy has great potential in the field of neuro-ophthalmology cross-over research and renders a vital theoretical support and practical path for early and non-invasive diagnosis of neurodegenerative diseases. In future studies, larger clinical cohorts are required for validation, and the sensitivity and generalization ability of the model should be continuously optimized to further promote its clinical transformation and application.
Footnotes
Ethical Considerations
The study protocol was approved by the ethics committee of The Second Affiliated Hospital of Jiaxing University.
Consent to Participate
All patients in the study signed the informed consent form.
Author Contributions
Study concept and design: Zhuoying Zhu, Yufei Shen
Acquisition, analysis, or interpretation of data: Zhuoying Zhu, Xiaoling Zhang, Congying Xu.
Critical revision of the manuscript for important intellectual content: Yufei Shen
Approval of the submitted version: All authors.
Funding
The authors disclosed receipt of the following financial support for the research, authorship, and/or publication of this article: This study was financially supported by Public Projects of Jiaxing (No. 2024AY30014).
Declaration of Conflicting Interests
The authors declared no potential conflicts of interest with respect to the research, authorship, and/or publication of this article.
Data Availability Statement
All original data are available upon reasonable request from the corresponding author.