
Abstract
Previous research has shown that rTMS improves visual working memory (VWM) performance in older people with subjective cognitive decline (SCD). However, the influence of stimulation parameters on the effect is unclear. We focus on the total number of stimulus pulses and aim to investigate whether 10 Hz rTMS with different total pulses could have different effects on VWM in SCD subjects. 10 Hz rTMS with different total pulses targeting the left dorsolateral prefrontal cortex (DLPFC)was applied to 34 SCD subjects who completed both neuropsychological tests and EEG for the VWM task. Different EEG techniques were used simultaneously to investigate the effect of different numbers of rTMS pulses. Our study found that an increased number of 10 Hz rTMS pulses targeting the left DLPFC with increased cortical excitability, higher power of gamma oscillations and optimized allocation of attentional resources can achieve greater improvement in VWM in SCD subjects.
Keywords
Significance Statement and Introduction
Significance Statement
Alzheimer’s disease has become a common, frequently occurring and serious condition for older people. The prevalence of Alzheimer’s disease increases with age. Epidemiological surveys show that the worldwide prevalence of Alzheimer’s disease is 13% in people over 65 and 45% in people over 85, and that the prevalence is increasing as the aging population accelerates. 1 Alzheimer’s dementia significantly impairs the quality of life of older people and places a great burden on the family and society. Once the dementia stage is reached, there are currently no effective drugs that can reverse or delay the onset and development of dementia. 2 As a high-risk group for Alzheimer’s disease, the average time for subjective cognitive decline to progress to dementia is about 10 years, which is a valuable window of opportunity for clinical ultra-early intervention in Alzheimer’s disease. Therefore, the search for possible intervention options at this stage to increase the cognitive reserve of the elderly is to delay the onset of dementia. Repetitive transcranial magnetic stimulation (rTMS) is a promising intervention therapy. 3 rTMS can increase cortical excitability, induce specific enhancement phenomena, and promote synaptic plasticity and recovery of damaged functions, which may be the basis for its therapeutic role. 4 However, the changes in neuronal activity induced by rTMS are highly variable, and the effect of rTMS is influenced by many experimental and biological factors that depend not only on individual differences 5 but also on factors related to the stimulus sequence.6,7 Insufficient curative effect not only leads to a waste of medical resources, but also causes confusion or great pressure on patients because the treatment results are ineffective. Improving the therapeutic effect of rTMS has always been a difficult problem to promote clinical application. There is no consensus on the optimal stimulation parameters for rTMS to improve cognitive impairment. Therefore, finding better stimulation parameters to increase the cortical response rate and help more patients with cognitive impairment is of great scientific significance and value to clinical practice.
Introduction
Alzheimer’s disease (AD) is a devastating neurodegenerative disorder characterized by progressive deterioration of memory and cognitive function8,9 People with subjective cognitive decline (SCD) may be at increased risk for Alzheimer’s disease. 10 Controlling actionable risk factors for AD in the preclinical stage may be the most realistic prevention strategy. 11 Visual working memory (VWM) is a cognitive ability that maintains and processes information in the brain during transient stays and is involved in performing complex tasks such as learning, decision making and reasoning. 12 Reduced VWM is an important factor in cognitive impairment associated with healthy aging. 13 Therefore, many different approaches are being explored as potential interventions to improve these abilities, including non-invasive brain stimulation methods such as repetitive transcranial magnetic stimulation (rTMS). Transcranial magnetic stimulation can alter the neuronal activity and excitability of target brain region. 14 It has been reported that high frequencies (≥5 Hz) increase cortical excitability, while low frequencies (≤1 Hz) produce inhibitory effects (Maeda et al, 2000). And the dorsolateral prefrontal cortex (DLPFC) has been used as a typical stimulation site for improving cognitive abilities because it plays a key role in supporting higher-level cognition, and the DLPFC is also the key structure for top-down control of working memory (WM) processes. 15 More importantly, many related studies have found the cognitive-enhancing effect of rTMS on the left DLPFC at a high frequency of 10 Hz.16,17 And it is worth mentioning that our previous study found that 10 Hz rTMS with a total of 1500 pulses stimulating the left DLPFC improved VWM performance and significantly improved attention and executive functions in elderly people with subjective cognitive decline despite a single application 18 However, different stimulation parameters may lead to differences in the effect of rTMS treatment. The number of rTMS pulses has been investigated in a handful of studies and suggests that the number of pulses may also influence the modulation of brain excitability,19,20 but there is no consensus on the optimal number of rTMS pulses required to achieve cortical excitability. Many studies have used changes in the amplitude of transcranial magnetic stimulation (TMS)-induced motor evoked potentials (MEP) as a neurophysiological indicator of the induction of neuroplasticity after transcranial magnetic stimulation, and varying the number of rTMS pulses may influence the changes in MEP amplitude and the duration of the effect.21,22 Increasing the number of pulses within a limited pulse range has been reported to have a greater effect on excitability. Previous studies have shown that the number of consecutive pulses is 1 of the most important parameters of rTMS.23,24 However, there is no consensus on the optimal number of rTMS pulses required to improve VWM. Therefore, the present study was proposed to investigate whether increasing the number of rTMS pulses would have a greater impact on improving VWM in subjects with SCD. In this study, we took a 10 Hz rTMS with 1500 pulses for the left DLPFC (consistent with our previous study) and double that, ie, 3000 pulses (consistent with the original (2008) FDA-approved rTMS protocol, which is still widely used). We then compared the effects of these different rTMS pulses on visual working memory in SCD subjects and investigated the underlying neural mechanisms with the aim of increasing TMS response rates and improving clinical outcomes to benefit more patients.
Materials and Methods
Participants
In this study, 34 SCD subjects who met the inclusion criteria and complained of memory loss were admitted to the memory clinic of Tongji Hospital, Tongji College. The ethics committee of Tongji Hospital approved the study (No. (Tong) ethical review 429), and all subjects signed an informed consent form.
Inclusion criteria
1. Age 18-85 years, regardless of gender, right-handed; 2. SCD-Q9 screening questionnaire result >5; 3. Ability for daily living in good condition (ADL-14 score = 14); 4. Normal objective memory assessment ((Mini-mental State Examination (MMSE) score >24; HVLT: ≥22; STT-A: Ages 50-59: <70 seconds, Ages 60-69: <80 seconds, Ages 70-79: <100 seconds; STT-B: Ages 50-59: <180 seconds, Ages 60-69: <200 seconds, Ages 70-79: <240 seconds; Animal Fluency Test (AFT): Middle school group: >12; High school group: >13 College group: >14; Boston Naming Test (BNT): Middle school group: >19; High school group: >21; College group: >22; CFT: >30. 5. No other psychiatric or neurological disorders in the examination.
Exclusion criteria
1. History of cerebrovascular disease; 2. Deficiencies in trace elements, particularly folate and vitamin B12, are closely associated with memory impairment; 3. Impaired consciousness, severe visual and hearing impairment, aphasia and other physical disorders that would make it impossible to perform a neuropsychological test; 4. Patients with severe underlying diseases of the liver, kidney, hematopoietic and endocrine systems, psychiatric disorders, epilepsy, Parkinson’s disease, diabetes mellitus and heavy alcohol consumption, drug abuse and malignant diseases; 5. Patients with the following contraindications to TMS, especially with a history of implanted metal devices (metal clips, plates or rods; stents and filters; electrodes implanted for deep brain surgery, such as vague nerve stimulation and ECT; pacemakers and drug pumps; hearing implants; bullets or metal fragments, etc.).
Experimental Protocol
Before the TMS procedure, all subjects had to sign a consent form and undergo the examinations in the memory clinics as well as the associated additional examinations, including a CT or MRI scan of the head, biochemical blood tests such as folic acid, vitamin B12, thyroid function (free triiodothyronine (FT3), free tetraiodothyronine (FT4), thyroid stimulating hormone (TSH)), syphilis spirochetes and HIV antibody tests. All subjects were also required to complete a series of neuropsychological tests, including assessment of general cognitive performance (MMSE), assessment of memory (Hopkins word learning test (HVLT), The HVLT has demonstrated good validity and reliability, making it well-tolerated by older adults. For the MCI group compared to the control group, the cut-off score for the Chinese population was approximately 21.5, achieving optimal sensitivity. 25 The Wechsler Logical Memory Test (WLMT), commonly used to assess episodic memory, exhibits high internal consistency, with Cronbach’s α values typically ranging from 0.80 to 0.90. 26 The Shape Trail Tests A and B (STT-A and STT-B) were designed to evaluate attention, visuospatial abilities, and executive functions. The AUC of the ROC curves for STT-A and STT-B ranged from 0.816 to 0.913. 27 The Stroop Color and Word Test (SCWT), a widely used neuropsychological tool, assesses the ability to inhibit cognitive interference and demonstrates good reliability, with Cronbach’s α values ranging from 0.80 to 0.89. Language assessment included the Boston Naming Test (BNT) and the Word Fluency Test (WFT). The BNT, 28 used to evaluate language function, shows excellent internal consistency with a Cronbach’s α value of 0.91, while the WFT demonstrates a Cronbach’s α value of 0.88. 29 The Rey-Osterrieth Complex Figure Test (Rey-OCG), used to assess visuospatial abilities, demonstrates strong internal consistency, with Cronbach’s α values ranging from 0.85 to 0.90. Additionally, the ADL scale, designed to evaluate activities of daily living, shows good internal consistency, with a Cronbach’s α value of 0.875. 30 To ensure accurate neuropsychological assessments, it was essential to maintain a disturbance-free environment and ensure the subjects remained in a relaxed state.
A total of 34 participants meeting the diagnostic criteria for SCD were included in the study and randomly assigned to different intervention groups using a random number table. Specifically, 19 participants were assigned to the low-pulse intervention group (1500 pulses), while 15 participants were assigned to the high-pulse intervention group (3000 pulses). The randomization process was as follows: the 34 participants were sequentially numbered from 1 to 34. Starting at a specific position in the random number table (eg, the second row, fifth column), three-digit numbers were read consecutively to generate a random sequence corresponding to participant IDs. These random numbers were then sorted in ascending order and assigned new serial numbers. Participants with serial numbers 1 to 19 were allocated to the low-pulse group, and those with serial numbers 20 to 34 were allocated to the high-pulse group.
The intervention consisted of a single rTMS session. And for this rTMS intervention, the rTMS parameters, except for the rTMS practitioner, were blinded to the investigator and all SCD participants. Participants were randomly assigned to the 2 groups (1500-pulse group or 3000-pulse group). The detailed content of the rTMS stimulation protocol is described below.
TMS stimulation protocol
rTMS was performed using an active figure-8 coil (BY90 A, Shenzhen Yingchi Technology Co., Ltd, Shenzhen, China) and pulsed magnetic stimulation (M-100 Ultimate, Shenzhen Yingchi Technology Co., Ltd, Shenzhen, China). Rest Motor Threshold (RMT) was defined as the minimum single-pulse intensity required to evoke a motor evoked potential (MEP) of 50 μv or more of the peak movement in a patient in a quiet state, and MEP referred to the contraction that can be recorded at the corresponding target after rTMS stimulation of the motor cortex. The contraction potential recorded at the tendon. The measurement was performed by sitting and relaxing in a reclining chair, spreading the hands on the legs, placing the center of the coil tangentially over the patient’s left motor cortex, triggering a single stimulation pulse, observing the movement of the patient’s right hand and, if an involuntary movement occurred, lowering the set threshold until the maximum threshold was reached at which the patient’s right hand stopped its involuntary movement, ie, the RMT. The stimulation site was the left DLPFC (F3) for the low-pulse rTMS group: 10 Hz stimulation frequency, with 20 stimulation sequences for each rTMS, each containing 75 stimulation pulses, with an interval of 10 seconds between each adjacent sequence, for a total of 1500 pulses per treatment, and the stimulation intensity was set at 100% of the subject’s RMT. The parameters for high-pulse stimulation: 10 Hz stimulation frequency, 30 stimulation sequences per rTMS session, with each sequence containing 100 stimulation pulses, an interval of 20 seconds between 2 adjacent sequences, a total of 3000 pulses per treatment, and a stimulation intensity of 100% of the subject’s RMT. The experimental flow chart is presented in Figure 1. Flow chart of the experiment. Note: Participants were recruited and evaluated for baseline data (neuropsychological tests, blood tests, and cranial-related imaging examinations such as skull MRI plain scan). Thirty-four subjects were included according to the admission criteria and grouped according to a random number table. The low-frequency rTMS group received a single treatment consisting of 1500 pulses, whereas the high-frequency rTMS group underwent a single session delivering 3000 pulses. Before rTMS intervention and immediately after intervention, all subjects completed the visual working memory task, and simultaneously collected EEG signal to complete the Stroop test.
Paradigm of the visual working memory
The experiment was conducted in a quiet room before and after the rTMS intervention. The subjects had to sit about 60 cm away from the computer screen. The VWM task was performed with the Eprime software (3.0). A modified visual working memory change detection task was used in this study (Figure 2), in which a left- or right-facing arrow with a gaze point is first displayed on the screen next to the gray screen. The subject’s eyes are instructed to remain consistently on the focal point while following the direction of the arrow with their eyes. The pattern sequence was then presented for 500 ms with an equal number of different colored memory patches on the left and right side of the gaze dot. The subject was asked to keep their eyes on the center gaze point while using their afterglow to remember the color of the memory patch on 1 side of the screen. After the example sequence disappeared, the recognition sequence appeared 900 ms after the presentation of the gaze point. The same position and number of blocks appeared on both sides of the gaze point as in the example sequence, and subjects were asked to recognize whether the color of the blocks on the side of the screen pointed to by the arrows had changed compared to the example sequence. Each task consisted of 2 blocks of 50 trials each, for a total of 100 trials. And before the formal test, subjects had to complete the training sequence under supervision to ensure that they fully understood the content of the test. Sequence of the visual working memory task. Note: Example of a visual memory test for the right hemifield. The attention period (cue (200 ms) with fixation (300 ms)); the memory encoding period (500 ms); the maintenance period (900 ms); the retrieval period (until response).
To evaluate behavioral performance, we measured 3 indicators, including correct score, reaction time (the average reaction time of trials in which the time from the recognition sequence to the participant’s response to the key did not exceed 3000 ms), and memory capacity. Memory capacity is calculated using the formula K = N * (h - f)/(1 - f), where h and f are the observed hit and false alarm rates and N is the number of items to be remembered, referred to as the set size. 31
EEG recording and preprocessing
The EEG recordings were made in a quiet room. The participants’ EEG data were recorded simultaneously while they performed the task. EEG data were recorded using an EEG recording system (Brain Amp MR PLUS, Brain Products GmbH, Germany) equipped with 64 silver chloride electrodes arranged according to the international 10-20 system. To record eye movements and blinks, vertical eye movements were recorded with 2 vertical EEG electrodes placed 1 cm above and below the left eye, and horizontal eye movements were recorded with 2 horizontal EEG electrodes placed on the outer canthus of each eye. In addition to the electrodes used to monitor eye movements, the electrodes were grounded to GND and referenced online to the Ref electrode. The impedance was kept below 10 kΩ. The EEG sampling frequency was 1000 Hz and the signal was recorded with an inline bandpass filter from 0.01 Hz to 250 Hz.
Data were processed in MATLAB (The MathWorks Inc., Natick, MA) using the EEGLAB toolbox16. The raw EEG signals were preprocessed by an experienced researcher, a bandpass filter of 0.1-95 Hz was applied, conduction noise of 50 Hz and 100 Hz was filtered out with a notch filter at 50 Hz (49 Hz–51 Hz) and 100 Hz (99 Hz–101 Hz), and the offline data were referenced to the average of 2 mastoids. The EEG data were then segmented relative to the onset of the memory array (from −1000 to 2000 ms), poor trials were discarded by visual inspection. Independent component analysis (ICA)17 was applied to remove residual artifacts related to eye movements and muscle activity. EEG values above ±100 μV at any electrode are automatically removed.
Event-related potential analysis
For the event-related potential (ERP) analysis, each interval was defined as 500 ms-2200 ms before and after the onset of the reminder display. On each trial, a baseline correction was calculated 200 ms before the onset of the reminder display. Trials were then averaged for each condition to create the ERP response. The contralateral delayed activity (CDA) component was extracted by subtracting the ERP waveform of the ipsilateral electrode in the target area from the ERP waveform of the contralateral symmetrical electrode, and we extracted the mean of the amplitude values in the time window from 400 ms to 600 ms after the reminder display. In this study, the reminder display was able to induce N2pc before the CDA component18. For N2pc, we extracted the maximum negative peaks in each condition on different waveforms. After identifying the peaks, we extracted the amplitude of each peak for each condition. The contralateral waveform of the target was the average of the left hemisphere electrodes when the target was in the right visual field and the right hemisphere electrodes when the target was in the left visual field.
Analysis of the time-frequency distribution
We performed a time-frequency analysis by using the Short-Time Fourier Transform (STFT) of the Moving Hanning Window wavelet and estimating the spectral power between 4 and 80 Hz (0.5 Hz steps) with a sliding time window of 200 ms. The time-frequency domain analysis was performed from the onset of the stimulus sequence to the presentation of the exploration sequence within 2000 ms. The baseline time was 1000 ms before the presentation of the stimulus sequence. The average performance values were calculated separately for each subject and each electrode. For the region of interest, the differences in absolute power values in each frequency band (theta (4-7 Hz), alpha (8-13 Hz), beta (14-30 Hz), gamma (40-80 Hz)) were calculated for all subjects at all time points.
Statistical analysis
The statistical analyzes were performed in SPSS (version 20.0, Tongji College, China). For demographic and clinical variables, differences between groups were analyzed using two-sample t-tests with 2 weights. These variables included age, education, and neuropsychological measures (MMSE, HVLT, WMLT, STT, SCWT, BNT, VFVT, Rey-OCG). Participants who exhibited scores indicative of significant cognitive impairment were excluded from specific analyses in order to ensure that the results accurately reflected the cognitive functioning of individuals without severe impairments. This exclusion was necessary to minimize potential confounding factors and to maintain the integrity and validity of the data analyzed in the study. In addition, we used a two-tailed chi-square test to determine between-group differences in gender-specific data. For the behavioral data, we focused on accuracy, reaction times, and memory capacity, another cognitive task like the SCWT, which were assessed with two-tailed t-tests. The electrophysiological results, consisting of the N2pc amplitudes and the spectral power of the region of interest, were compared with two-tailed t-tests or the Mann–Whitney U-test. A two-tailed value of P < 0.05 was considered statistically significant.
Results
Demographic Information
Demographic Data.

Behavioral Performance
We compared the differences in VWM performance at low and high pulses in terms of accuracy, reaction time and memory capacity, and the results showed that a higher number of rTMS pulses significantly improved accuracy (low pulses vs high pulses: 95.89 ± 3.56 vs 98.73 ± 1.71, P = 0.008) (Figure 3A), reaction time (low pulses vs high pulses:910.32 ± 163.61 vs 898.47 ± 260.77, P = 0.029) (Figure 3B), and memory capacity (low pulses vs high pulses:1.88 ± 0.12 vs 1.96 ± 0.06, P = 0.03) during the visual working memory task (Figure 3C). In addition, participants treated with a higher dose of rTMS had better performance during the Stroop test in terms of Stroop interference effects and improved accuracy of the SIE (low stimulus pulses vs high stimulus pulses: 25.373.3 EEG results. Performance of visual working memory. Note:(A) shows the differences in accuracy during the VWM task between the low-stimulus and high-stimulus stimuli. (B) depicts the differences in reaction time during the VWM task between the low and high stimulus stimuli. (C) illustrates the differences in memory capacity during the VWM task between the low and high stimulus stimuli. (D) shows the differences in reaction time during the Stroop test (Stroop word test, Stroop color test, Stroop color word test). (E) shows the reaction time differences in the Stroop interference effects (SIE) (The reaction time of the SIE = The reaction time of the Stroop color word test- The reaction time of the Stroop color test). (F) shows the differences in accuracy of the SIE (The accuracy of the SIE = The reaction time of the Stroop color word test- The accuracy of the Stroop color test). *P < 0.05.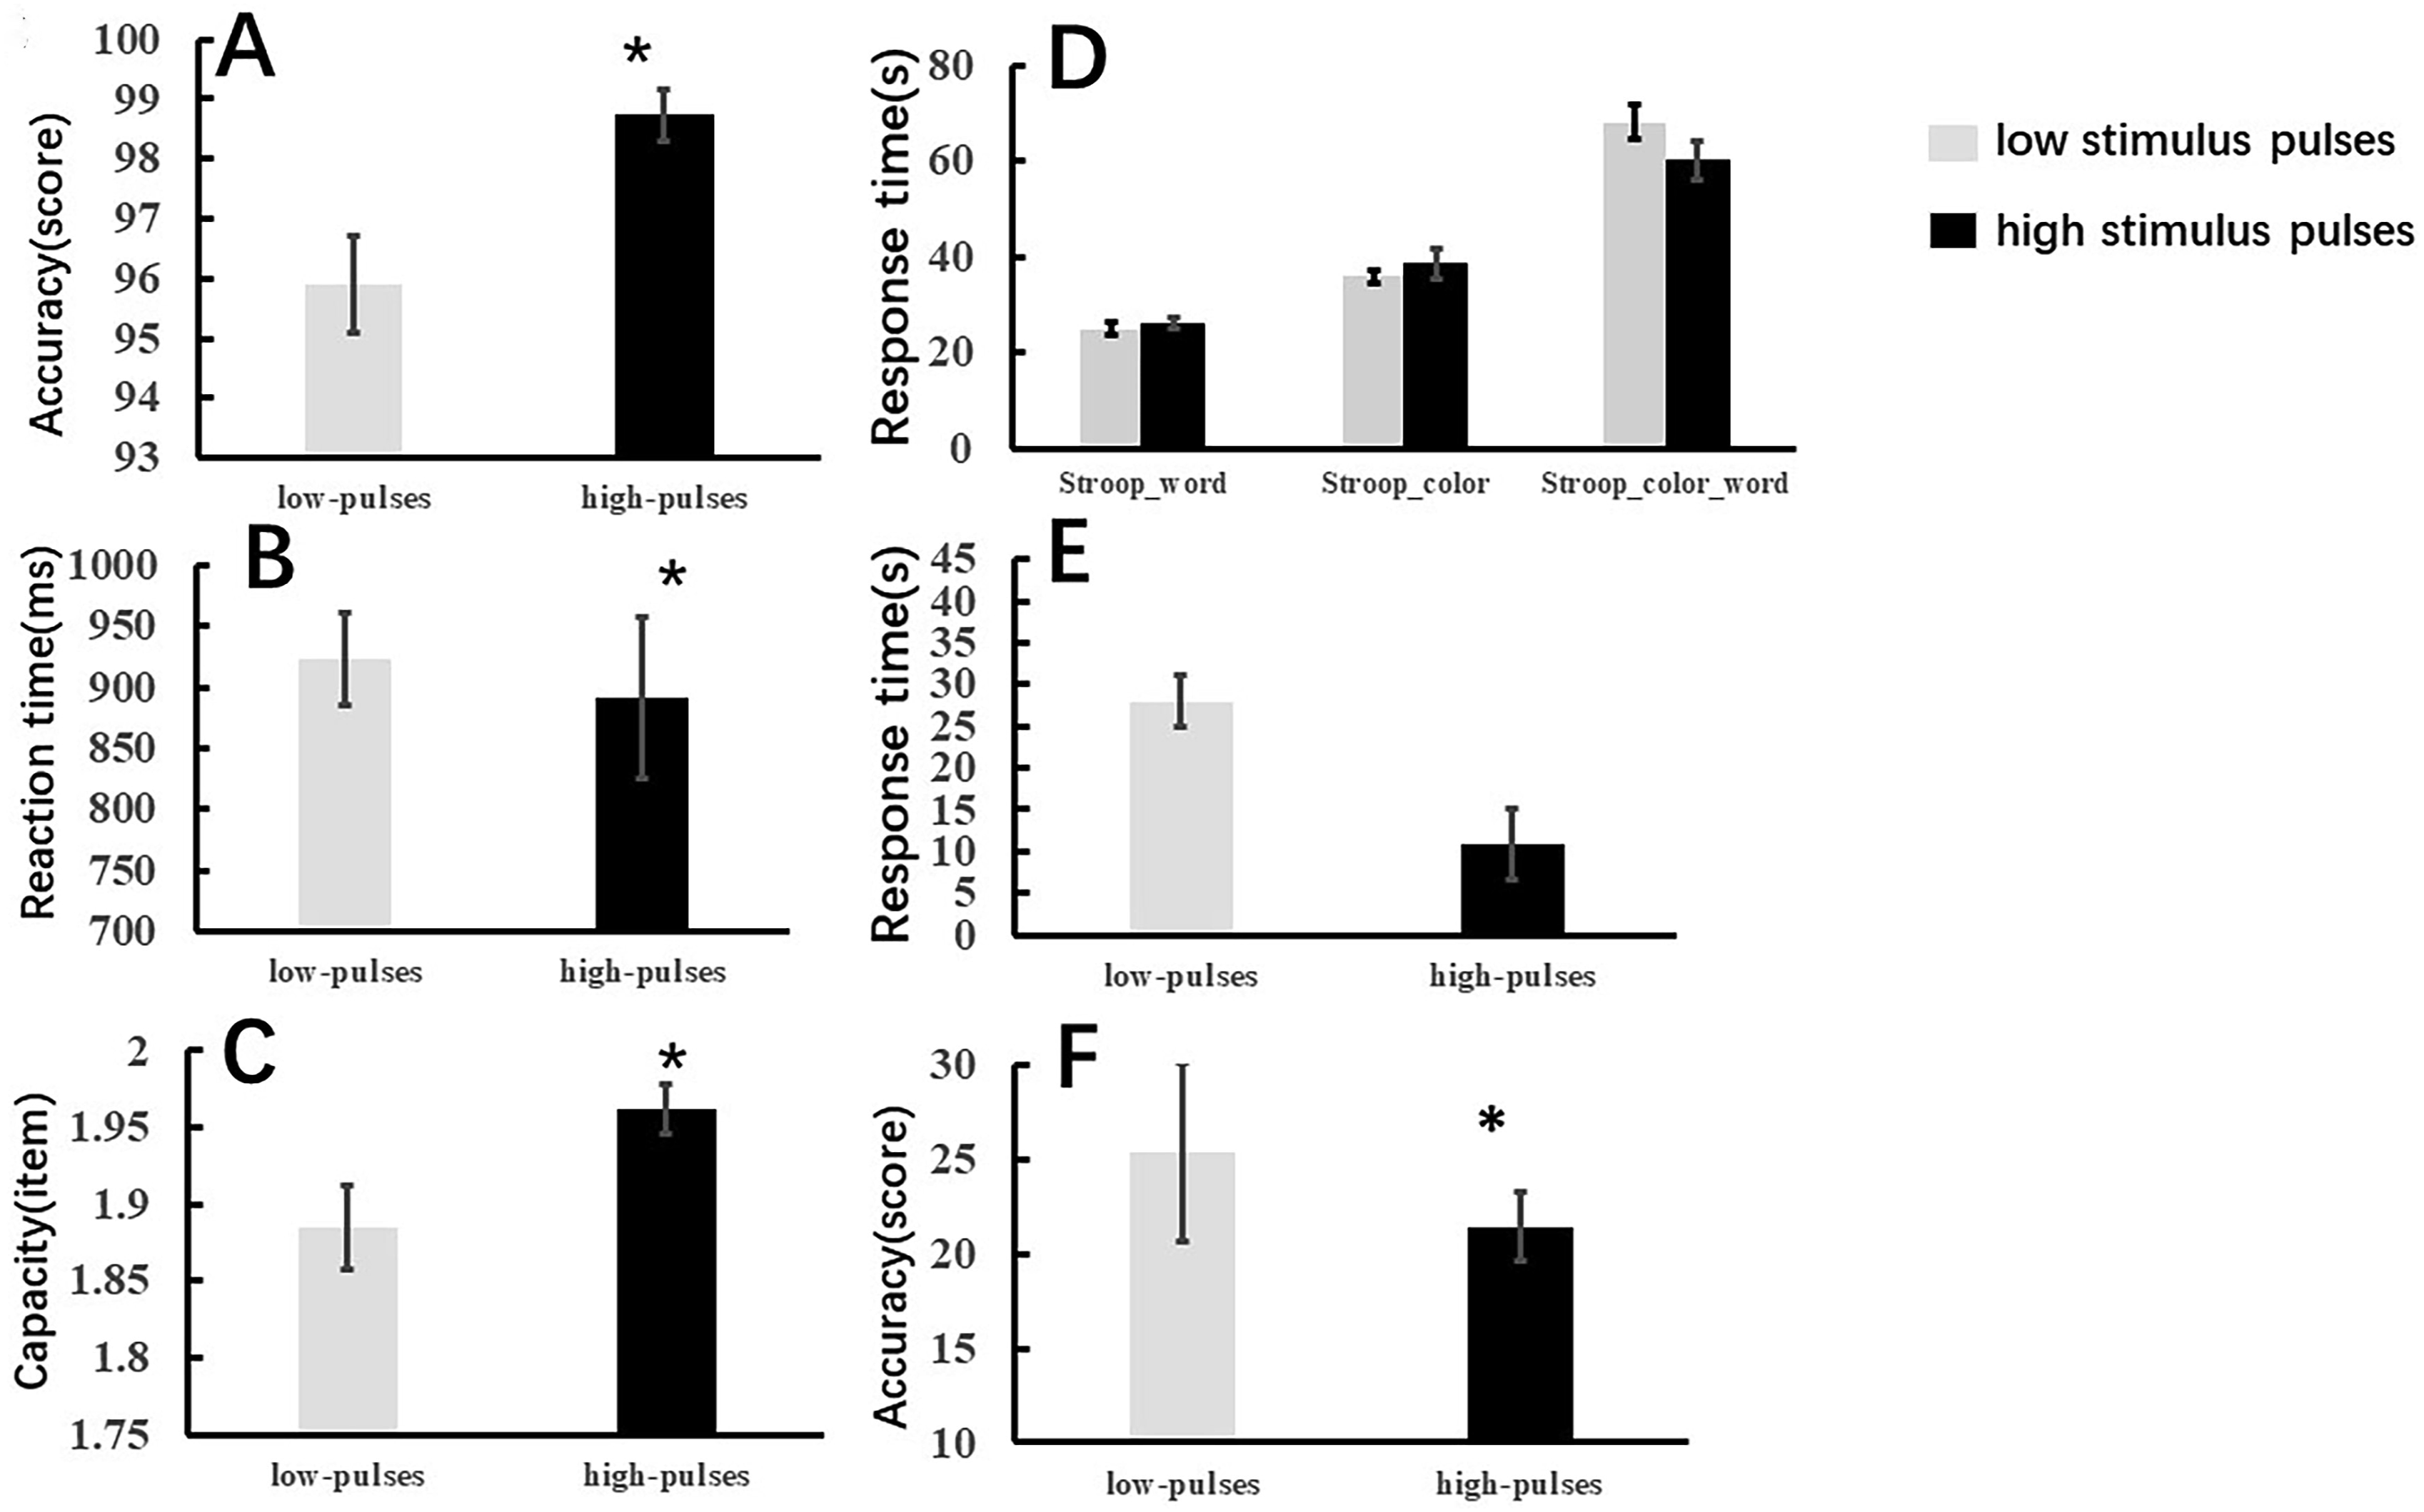
ERP results
The N2pc difference waveforms are shown in Figure 4A. The peak amplitudes during the 180∼280 ms time window after visual presentation were analyzed. The results of independent-samples t test showed that the amplitudes of N2pc improved significantly with a higher number of rTMS pulses (low-stimulus pulses vs high-stimulus pulses: −0.96 ± 1.44 vs −2.53 ± 1.18, P = 0.002) (Figure 4B). Large peak event-related potentials and amplitude differences of the N2pc during the VWM task between low and high stimulus bursts. Note:(A) illustrates the amplitude of the event-related potential (ERP) in the visual memory trial; the N2pc time window (180-280 ms) has been highlighted in the red strip; (B) shows the N2pc amplitude difference during the VWM task between the low and high stimulus pulses; *P < 0.05.
Time-frequency distribution with baseline correction
The baseline-corrected time-frequency distributions were averaged within frequency (4-80 Hz) and a posterior ROI (PO7/PO8) (Figure 5A and B). Figure 5C and D shows that during the time window (180-212 ms), spectral power in the high gamma band (66-74 Hz) increased significantly in the parieto-occipital lobe with a higher number of rTMS pulses compared to the low rTMS pulse group (low pulses vs high pulses:-0.017 ± 0.03 vs 0.009 ± 0.024, P = 0.012 ).±20.63 vs 21.40 ± 7.01, P = 0.022) (Figure 5E). Grand average of time–frequency distribution (TFD) and high gamma oscillation of scalp topography over the parieto-occipital lobe during the VWM encoding period. Note: (A) shows the TFD over the parieto-occipital lobe (PO7/PO8) in high gamma bands (60-80 Hz) during the VWM encoding period when applying a low number of rTMS pulses (1500 pulses); (B) shows the TFD over the parieto-occipital lobe (PO7/PO8) in high gamma bands (60-80 Hz) during the VWM encoding period when applying a higher number of rTMS pulses (3000 pulses). (C) illustrates the scalp topographies over the parieto-occipital lobe during the N2pc time window (168-212 ms) in the high gamma oscillation (66-74 Hz) when applying a low number of rTMS pulses (1500 pulses); (D) illustrates the scalp topographies over the parieto-occipital lobe during the N2pc time window (168-212 ms) in the high gamma oscillation (66-74 Hz) when applying a higher number of rTMS pulses (3000 pulses) (E) illustrates the bar graph differences of ROI of gamma oscillation between low and high pulses. (F) shows the ROI of gamma oscillation over the parieto-occipital lobe.
Discussion
Excitatory rTMS stimulation of the left DLPFC improves visual working memory in healthy adults, which is consistent with previous studies19. Improved attention allocation through modulation of the DLPFC and faster reaction time play an important role in VWM and executive function. In the current study, we found that participants performed better after applying a greater number of TMS pulses to the DLPFC. The study results also suggest that a larger number of rTMS pulses significantly improved accuracy, reaction time, as well as the capacity of the VWM task. In addition, we found that the accuracy of Stroop interference effects significantly improved in individuals with SCD after performing a higher number of rTMS pulses, suggesting that a higher dose of rTMS may improve the ability of older individuals with SCD to filter irrelevant information and improve their executive functions. The effect of transcranial magnetic stimulation depends on the frequency and dose of rTMS. Different stimulation frequencies and pulses may have different effects on the stimulation target and the distal brain regions associated with the stimulation target. 32 Our study showed that the higher the number of pulses, indicating a higher dose and longer duration of rTMS effects, the stronger the effects of rTMS on the DLPFC, and the more significant the effects on the VWM task as well as on the other cognitive tests.
Behavioral performance reflects only the results of visual working memory processing and provides only limited insight into the underlying mechanisms. The specific manner in which increasing the number of stimuli improves visual working memory remains unclear. Our results, based on event-related potential (ERP) and time-frequency analyzes, show that increasing the number of pulses significantly enhances N2pc amplitude and increases gamma oscillatory power in the parieto-occipital region. We hypothesize that these effects may be related to the following mechanisms:
First, the increased N2pc amplitude likely represents a more efficient allocation of attentional resources to target stimuli, thereby improving the encoding efficiency of visual information. Previous studies have shown that N2pc in VWM tasks usually occurs around 200-300 ms after the memory task stimulus,33,34 is an early memory component and is related to attentional selection. 35 Previous studies36,37 have confirmed that the amplitude of N2pc is related to the allocation of attentional resources in visual memory tasks. N2pc reflects attentional focus on the target. N2pc amplitude reflects to some extent changes in cortical excitability. Previous studies have shown that the number of pulses can also influence the modulation of brain excitability and that within a certain range the rTMS effect increases with increasing number of pulses. 24 However, a ceiling effect occurs when the number of pulses reaches a certain threshold. However, the number of pulses of different rTMS doses was not investigated in this study. Future studies may further investigate the effect of rTMS dose on VWM.
Second, the increased power of gamma oscillations could facilitate the integration and maintenance processes of working memory, as gamma oscillations are known to play a crucial role in inter-regional communication and information integration. 38 In addition, a higher number of impulses can improve neuronal synchronization, leading to better cognitive performance in working memory tasks. The fundamental basis of brain function is the oscillations of the brain in different frequency bands. 39 The processing of VWM depends on neuronal oscillatory activity in the frontoparietal temporo-occipital area. Gamma-band oscillations are neuronal activities that are generated to synchronize sub-processes in neuronal networks during specific information processing. 40 Gamma-band activity plays an important role in both primary stimulus processing and higher information processing. 41 Previous studies have shown that gamma oscillations underlie the maintenance of feature-specific information and the content of visual working memory. 42 Previous studies have shown that visual working memory information is present in the occipital, parietal and frontal cortices. However, little is known about the effect of different pulse rates of rTMS on VWM processing. In our exploratory study, we found that increasing the number of rTMS pulses significantly increased oscillations in the high gamma band (60-80 Hz) in the parietal-occipital lobes during the interval of visual stimuli, suggesting that high doses of rTMS pulses may modulate VWM processing by modulating the DLPFC. Studies have shown that the parietal lobes are associated with attention span 43 and attentional control. 44 The visual cortex is the source of gamma oscillations, and occipitoparietal neuronal networks are closely associated with gamma oscillations. 45 Gamma oscillations are associated with VWM processing. Power spectral density (PSD) analysis shows that differences in gamma-band activity are related to the degree of clinical response, and changes in gamma-band power can be used to predict response to rTMS treatment. 46 Gamma oscillations increase with memory load, 47 gamma oscillation is proportional to amplitude, and the higher the power, the faster the subject’s response. 48 In addition, gamma oscillations have been found to modulate the level of cortical excitability. Previous studies have shown that changes in gamma oscillations in the elderly may be associated with general cognitive decline. 49 Gamma activity is reduced in Alzheimer’s patients, 50 so modulating gamma activity in Alzheimer’s patients could help improve cognitive function. This is a good idea for the future cognitive rehabilitation of dementia patients. Studies have shown that low-frequency oscillations are associated with functional inhibition, while faster gamma oscillations represent cortical activation. 51 Therefore, we hypothesize that the observed improvements in visual working memory and executive functions may be related to TMS-induced changes in the excitability of the left DLPFC.
Specifically, continuous repetitive transcranial magnetic stimulation (rTMS) pulses can induce a cumulative effect that progressively increases local neuronal excitability and promotes long-term potentiation (LTP) in parieto-occipital neurons. 52 This cumulative energy is reflected in the gradual increase in N2pc amplitude and gamma oscillatory power. High-pulse rTMS optimizes the encoding and storage of visual information by simultaneously increasing N2pc amplitude and the strength of gamma oscillations. Research suggests that gamma oscillations in the parieto-occipital region play a critical role in visual working memory processes, with their enhancement likely contributing to the stabilization of memory traces. At the same time, the increased N2pc amplitude reflects the efficient allocation of attentional resources, which provide a solid foundation for further processing in working memory.
In conclusion, rTMS significantly increases N2pc amplitude and gamma oscillatory power by modulating neuronal activity in the parieto-occipital region. This demonstrates that rTMS enhances visual attention and working memory processes on multiple levels and provides valuable insights for future research and clinical applications. Further investigations utilizing advanced imaging techniques (eg, fMRI, MEG) and complex cognitive tasks are warranted to elucidate the mechanisms of rTMS in the regulation of attentional networks and working memory and its efficacy in different contexts.
Conclusions
Our study found that increasing the number of rTMS pulses significantly improved visual working memory and the ability to suppress distractions in individuals with SCD. Electrophysiological data showed that more rTMS pulses enhanced N2pc amplitude, optimized attentional resource allocation, and improved VWM. Time-frequency analysis revealed increased gamma oscillations in the parieto-occipital lobe, particularly during the visual working memory encoding interval. Correlation analysis suggested that the VWM improvement was linked to increased cortical excitability and gamma activity. Thus, we propose that the enhancement of VWM by rTMS may be driven by increased cortical excitability and stronger gamma oscillations.
Footnotes
Author Contributions
ML: study design, data collection, statistical analysis, data interpretation, manuscript editing and literature search; RRL: data collection, statistical analysis, manuscript editing and literature search for the revised manuscript; WZ: study design, manuscript revision, review and editing; JYSY: data collection, manuscript translation and literature search; JXY: Data collection and literature search; BMYLM-XKE: Data collection, statistical analysis and literature search; ZXT: Data collection and literature search; YXL: Study design, supervision, manuscript revision, fundraising. All authors contributed to the article and approved the submitted version.
Declaration of Conflicting Interests
The author(s) declared no potential conflicts of interest with respect to the research, authorship, and/or publication of this article.
Funding
The author(s) disclosed receipt of the following financial support for the research, authorship, and/or publication of this article: This research was supported by National Science Foundation of China Grant No. (81671307), Shanghai Hospital Development Center Foundation Grant No. (SHDC12021110), Shanghai Committee of Science and Technology, China Grant No. (22Y11903500), Shanghai Municipal Health Commission Grant No. (2022JC018), STI2030-Major Projects Grant No. (2022ZD0211600), Science and Technology Development Fund of Shanghai Pudong New Area Grant No. (PKJ2024-Y53), Health Technology Project of Shanghai Pudong New Area Grant No. (2025-PWDL-08), the Scientific Research Foundation provided by Pudong Hospital affiliated to Fudan University Grant No. (zdxk2020-09; Zdzk2024-05), Talents Training Program of Pudong Hospital affiliated to Fudan University Grant No. (YJYJRC202307).
Ethical Statement
Data Availability Statement
The data supporting the conclusions of this article are provided by the authors without reservation.