
Abstract
Objective
To assess the role of Machine Learning (ML) in identification critical factors of dementia and mild cognitive impairment.
Methods
371 elderly individuals were ultimately included in the ML analysis. Demographic information (including gender, age, parity, visual acuity, auditory function, mobility, and medication history) and 35 features from 10 assessment scales were used for modeling. Five machine learning classifiers were used for evaluation, employing a procedure involving feature extraction, selection, model training, and performance assessment to identify key indicative factors.
Results
The Random Forest model, after data preprocessing, Information Gain, and Meta-analysis, utilized three training features and four meta-features, achieving an area under the curve of 0.961 and a accuracy of 0.894, showcasing exceptional accuracy for the identification of dementia and mild cognitive impairment.
Conclusions
ML serves as a identification tool for dementia and mild cognitive impairment. Using Information Gain and Meta-feature analysis, Clinical Dementia Rating (CDR) and Neuropsychiatric Inventory (NPI) scale information emerged as crucial for training the Random Forest model.
Keywords
Introduction
As the world’s population ages at an accelerating pace, the prevalence of dementia in low-income countries is poised to experience a substantial surge in the forthcoming decades. Presently, there are an estimated of 47.47 million cases of dementia across the globe. However, projections indicate that in 2050, this figure is anticipated to soar to a staggering 131.5 million. 1 Focusing on the early stages of the pathological process is a viable strategy for preventing dementia by identifying the population with the highest risk. Mild cognitive impairment (MCI) is an intermediate state between normal and dementia, 2 with a noticeable decline in cognitive abilities without significantly interfering with daily activities. 3 Previous studies have shown that individuals with MCI are more likely to develop dementia than those with normal cognitive function. 4 Cognitive impairment is characterized by decreased memory, attention, and language and deterioration in other cognitive functions, including MCI and dementia.5,6
Although some progress has been made in the early diagnosis and intervention of cognitive impairment, more effective and precise methods are still needed to improve diagnostic accuracy and the effectiveness of early interventions. 4 Clinical prediction models developed using Artificial Intelligence (AI) and Machine Learning (ML) have garnered significant interest in health care in recent years. 7 Health care professionals have utilized machine learning techniques to develop applications that assist in making diagnostic decisions. These algorithms utilize extensive patient data from clinical studies to achieve accurate diagnosis. This application has become increasingly prevalent in various medical specialties, including cancer detection, heart disease, eye conditions, and chronic illnesses. 8
This study utilized early screening form data, employed multiple modeling methods, and optimized model parameters to assess model performance using metrics such as Area Under the Curve (AUC) and accuracy (CA). We developed the optimal predictive model for diagnosing patient diseases and identified key influential indicators. Through ML techniques and feature selection methods, our aim is to enhance the accurate diagnosis of dementia and MCI, improve diagnostic tools for health care professionals, and promote better treatment outcomes and quality of life for patients.
Materials and Methods
Participants and Ethics
From May 1 to July 31 in 2019, 394 participants aged 65 years and older were enrolled from a Chinese nursing home in Hangzhou City, which is the capital and largest city of Zhejiang Province in southeastern China. Written informed consent were collected from all the subjects or family members prior to participating in the study, in accordance with protocols approved by the Ethics Committee of Zhejiang Hospital (reference number: 2014-KL-35-1). Among them, 21 were excluded due to refusal or loss to follow-up, as they were unable to complete assessments and communicate effectively due to language, hearing, or vision impairments, and two were excluded due to death. Ultimately, 371 participants were included in the final analysis, resulting in a response rate of 94.2% (Figure 1). The flowchart depicting the expected and final participant inclusion is shown in Figure 1. Flow chart of participants.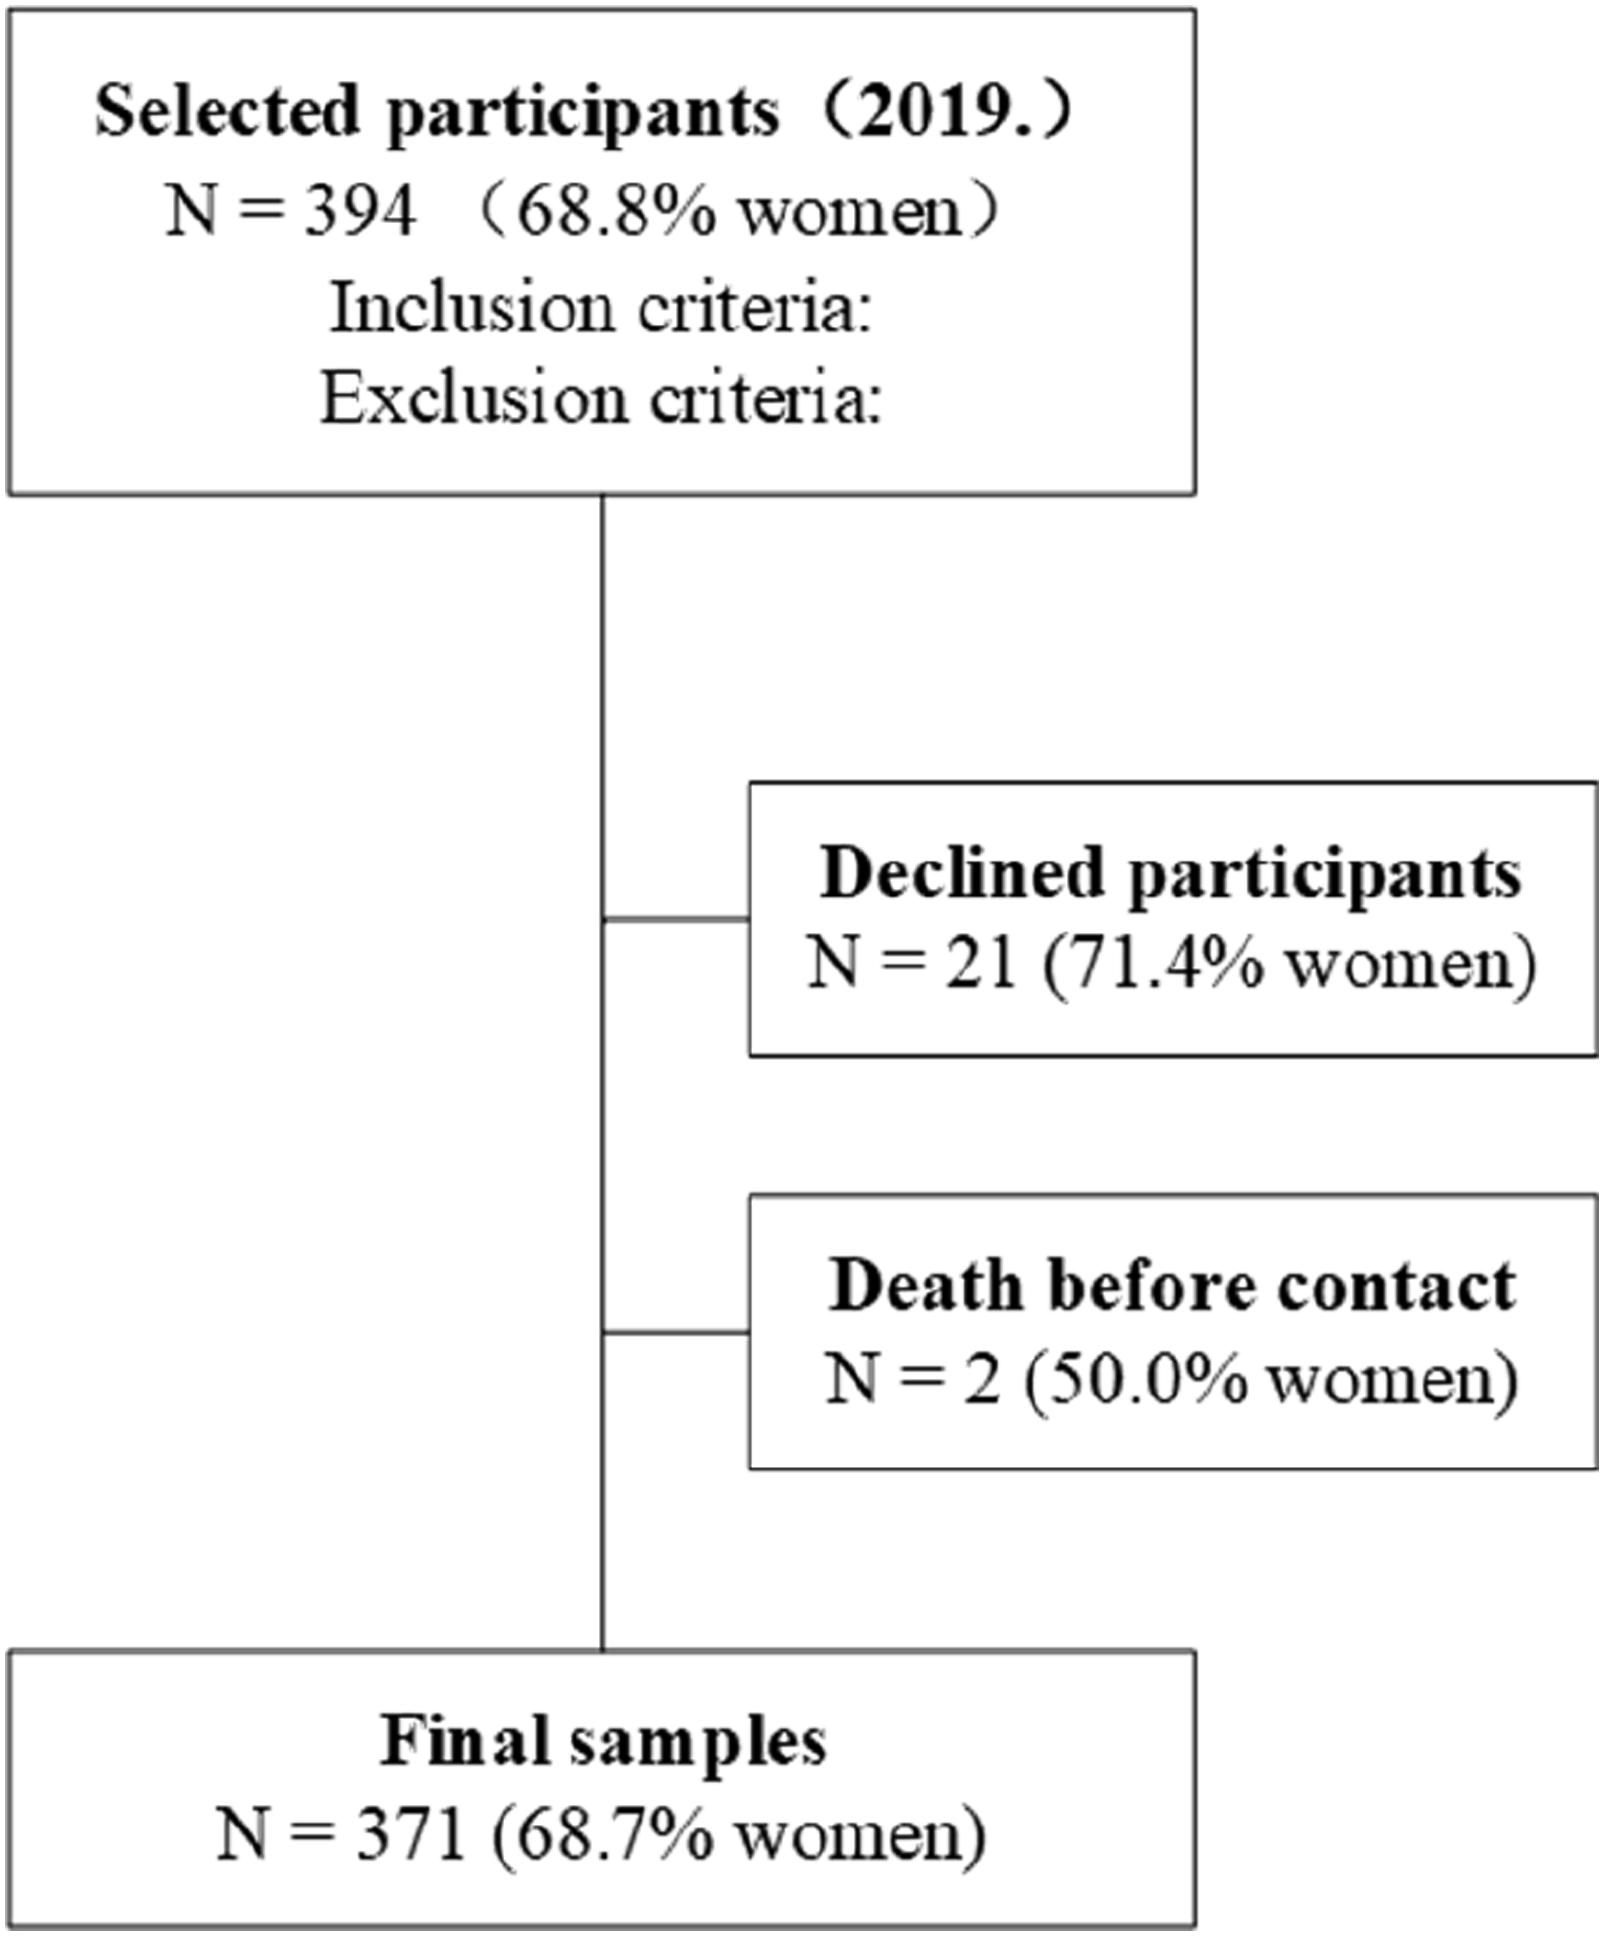
Methods
Measures
Demographic information, including gender, age, parity, and health behaviors (eg, visual acuity, auditory function, mobility, and medication history), was primarily sourced from electronic archives of nursing homes. Uncertain information was clarified through consultations with caregivers or family members. Additionally, trained nurses administered standardized assessments using tools such as the Mini-Mental State Examination (MMSE), Mini-cog, Clock Drawing Test, Alzheimer’s Disease 8-item Informant Questionnaire (AD8), Activities of Daily Living (ADL) scale, Epworth Sleepiness Scale, Cohen-Mansfield Agitation Inventory - Short Form (CMAI-Short), Clinical Dementia Rating (CDR), Neuropsychiatric Inventory (NPI), and Morse Fall Scale. Diagnosis of MCI and dementia were established by experienced psychiatrists through a comprehensive approach involving patient history review, informant interviews, and objective bedside mental status examinations, adhering to the 2011 National Institute on Aging and Alzheimer’s Association (NIA-AA) criteria.9,10
ML models
Figure 2 illustrates the modeling process of ML. We utilized five classifiers: Random Forests (RF), Gradient Boosting (GB), Support Vector Machine (SVM), k-Nearest Neighbors (k-NN), and Neural Network (NN). Further details on these models are provided in Appendix 6.1. These classifiers were chosen for their extensive use in clinical diagnostic studies and their demonstrated efficacy in distinguishing between individuals with dementia and MCI. Predictive outcomes from these models were leveraged for model optimization using a comprehensive dataset comprising 35 features. These features encompass demographic details (eg, gender, age), health metrics (eg, visual and auditory function, mobility), and data from 10 assessment scales. This dataset facilitated feature selection and performance evaluation, leading to the identification of optimal models and key features contributing to accurate diagnostics.
11
Machine learning process diagram.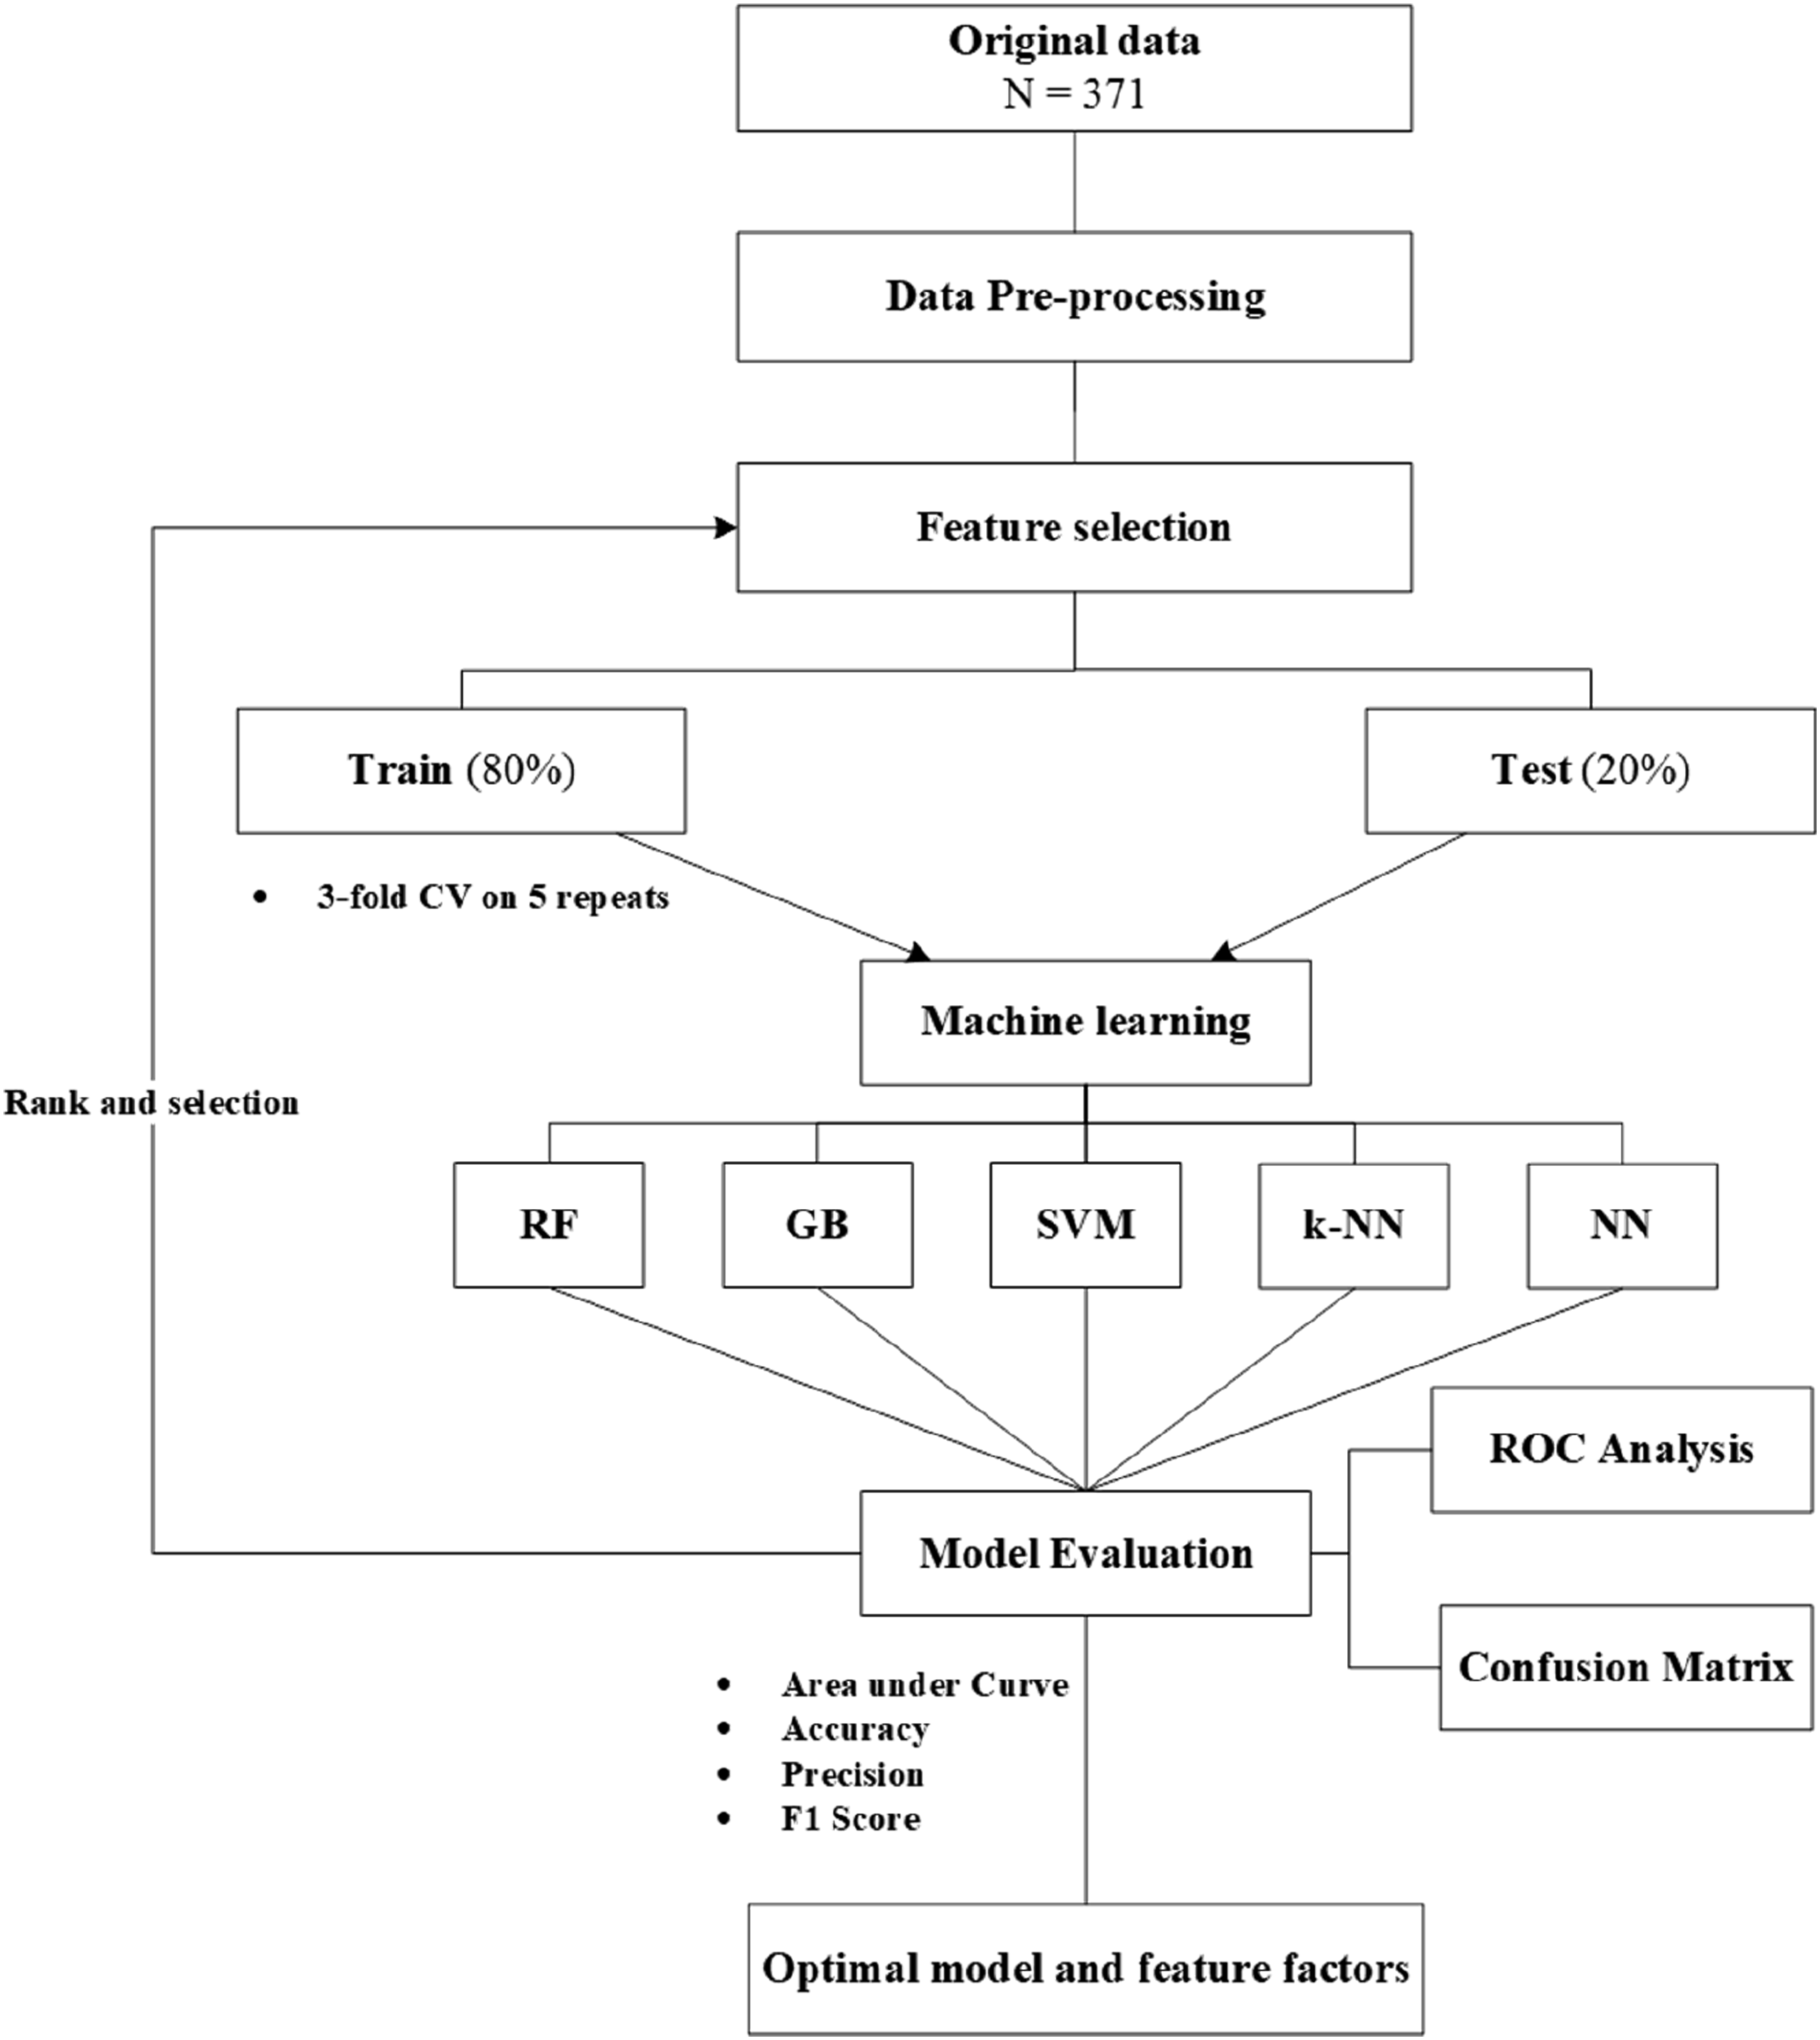
Meta-features
Meta-features are high-level statistical information or descriptive statistics that describe the features of a dataset. They help in understanding and analyzing the characteristics of the dataset, which can be used for selecting appropriate machine learning models and algorithms, as well as tuning the performance of models. 12
Data preprocessing and model optimization methods
The raw data is preprocessed by removing groups with missing values. Based on performance metrics such as Accuracy, AUC, Precision, F1 Score, and Confusion matrix results, suitable ML models and features are selected. Detailed descriptions of these performance metrics can be found in Appendix 6.2.
Data Statistics
The ML analysis software is Orange 3.35. We used one-way ANOVA or t-tests and χ2 tests for continuous and categorical variables, respectively. The figure was generated using GraphPad Prism 10.0.2.
Results
Baseline Characteristics
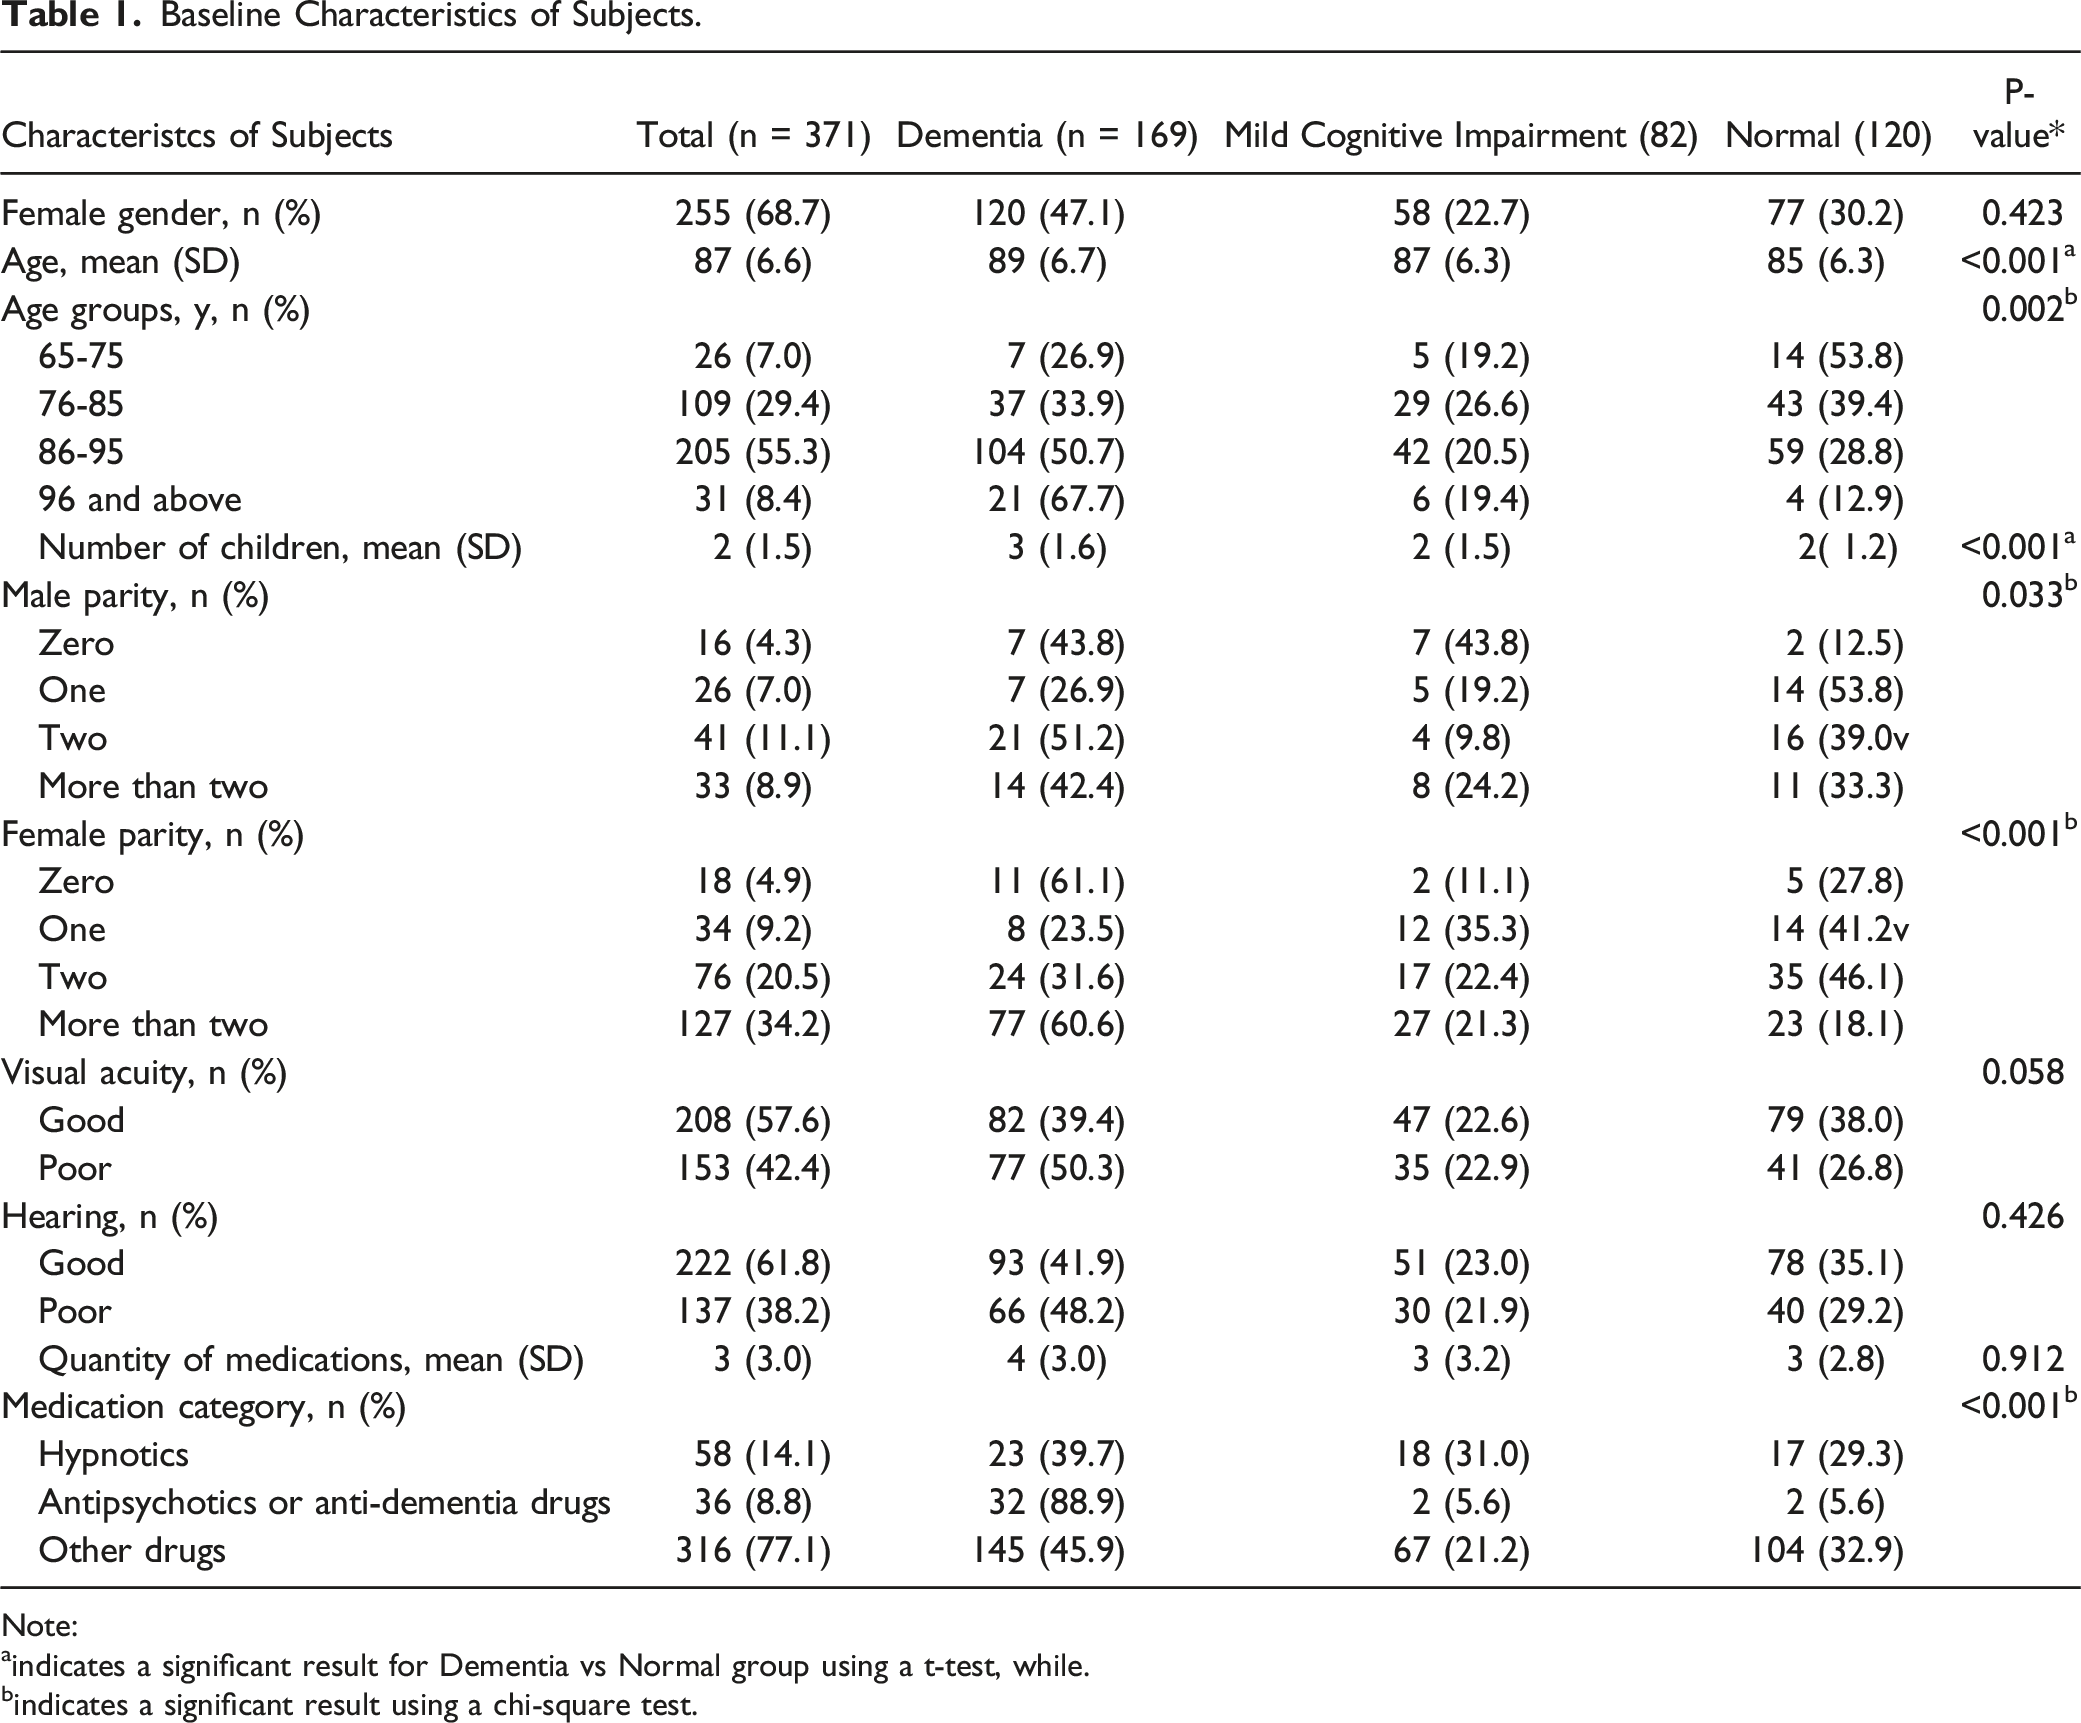
Baseline Characteristics of Subjects.
Note:
aindicates a significant result for Dementia vs Normal group using a t-test, while.
bindicates a significant result using a chi-square test.
Scale Assessment
Our study demonstrates that the distinction between MCI and the Normal group is relatively low for some scales, such as ADL, CMAI-Short, and Epworth Sleepiness. However, in Figure 3, apart from the Morse Scale, both the Dementia vs Normal group and the Dementia vs MCI group can be significantly differentiated (P < 0.01). Scale test results. A and B scale scores, C t test analysis results.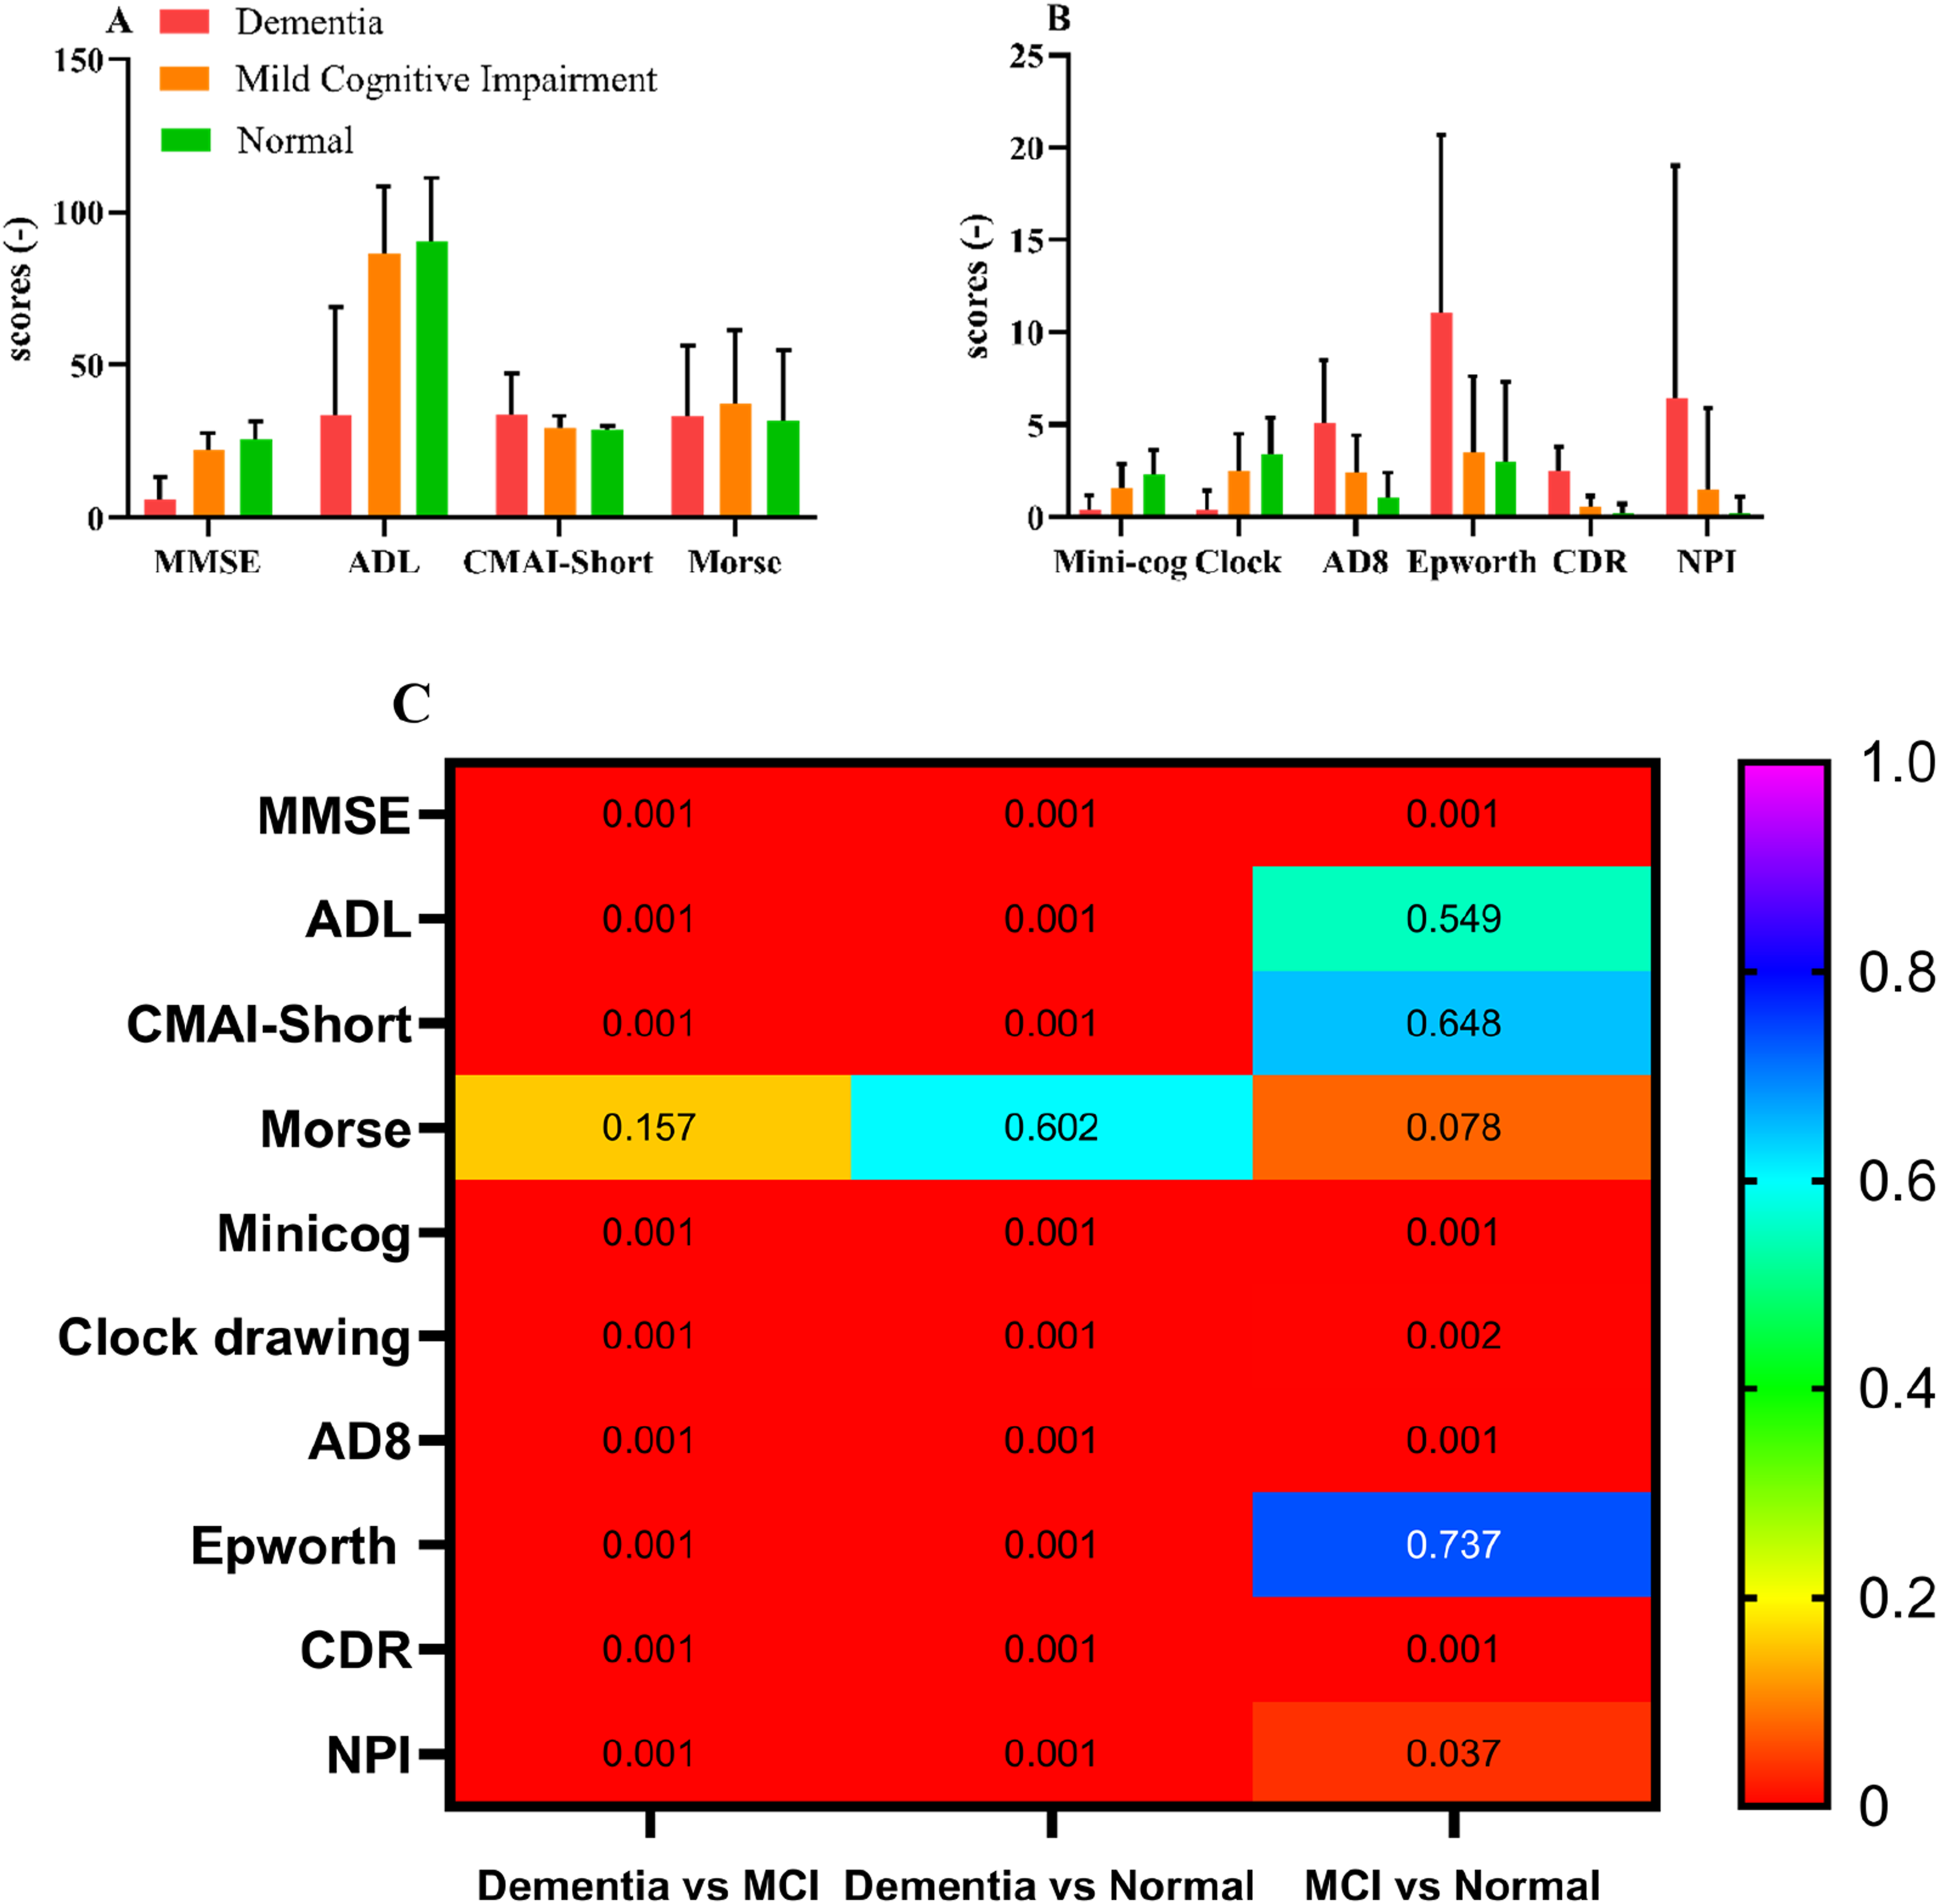
Modelling Results
Raw data model results
Figure 4 summarizes the predictive results of the raw data. The AUC values of the five machine learning models range from 0.812 to 0.955, while the CA ranges from 0.648 to 0.859. The best-performing model is GB, followed by RF. According to Information Gain, we obtained a ranking of the importance of the 35 features (Figure 4(C)), with the CDR Score being the most important. Modeling Results. A performance evaluation results of different models, B Confusion matrix results for actual proportions in the RF Model, and C Feature importance ranking results based on Information Gain. (D, M, and N means dementia, mild cognitive impairment, and normal, respectively).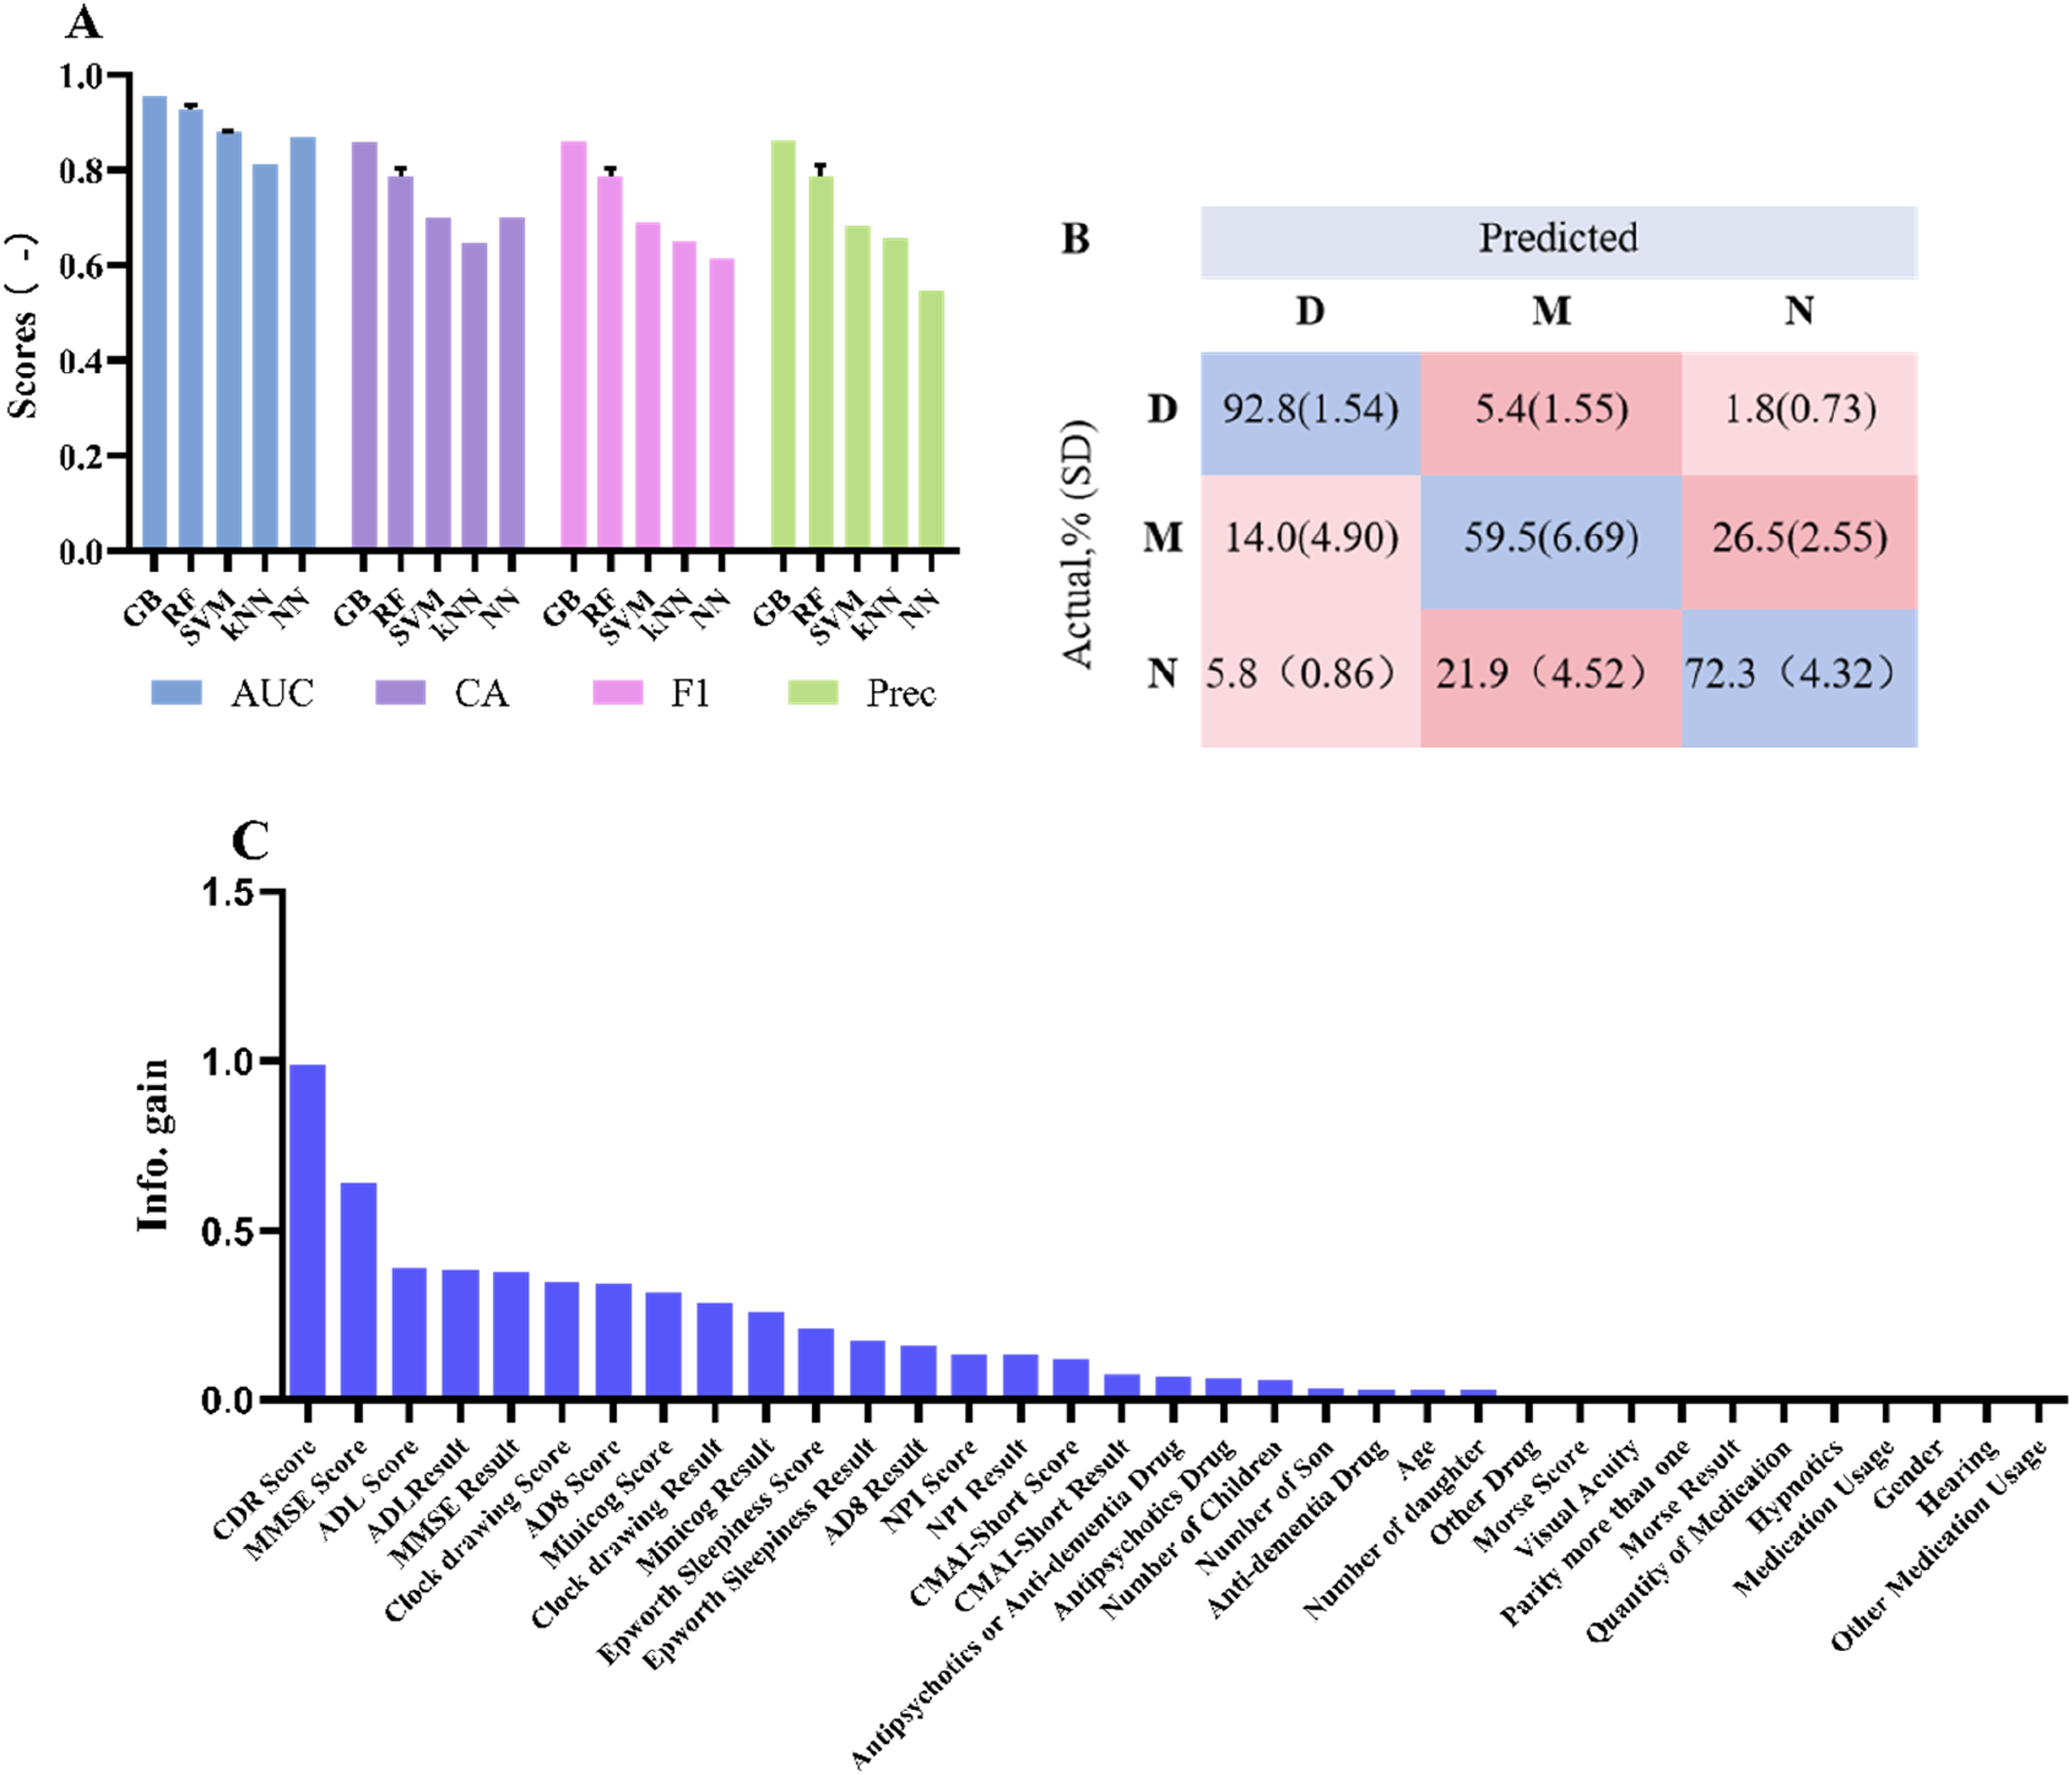
Optimized model results
Figure 5 presents the results of model optimization. Integrating the feature importance results and the data analysis results from Table 1, we narrowed down the 35 original features to 3 for training (CDR score, NPI score, NPI result) and 4 for meta-features (Parity more than one, Hypnotics, Antipsychotics or Anti-dementia Drug, Other Drug), as shown in Figure 5(B). Post-optimization, RF emerged as the best predictive model. The AUC improved from 0.927 (0.0101) to 0.961 (0.0007), and the CA increased from 0.787 (0.0176) to 0.894 (0.0029), as depicted in Figure 5(A). Feature selection and model optimization results. A Performance comparison of different models after feature optimization, B Feature selection results, C The confusion matrix for actual proportions in the optimized RF Model, and the significance comparison with the original data results. (D, M, and N means dementia, mild cognitive impairment, and normal, respectively).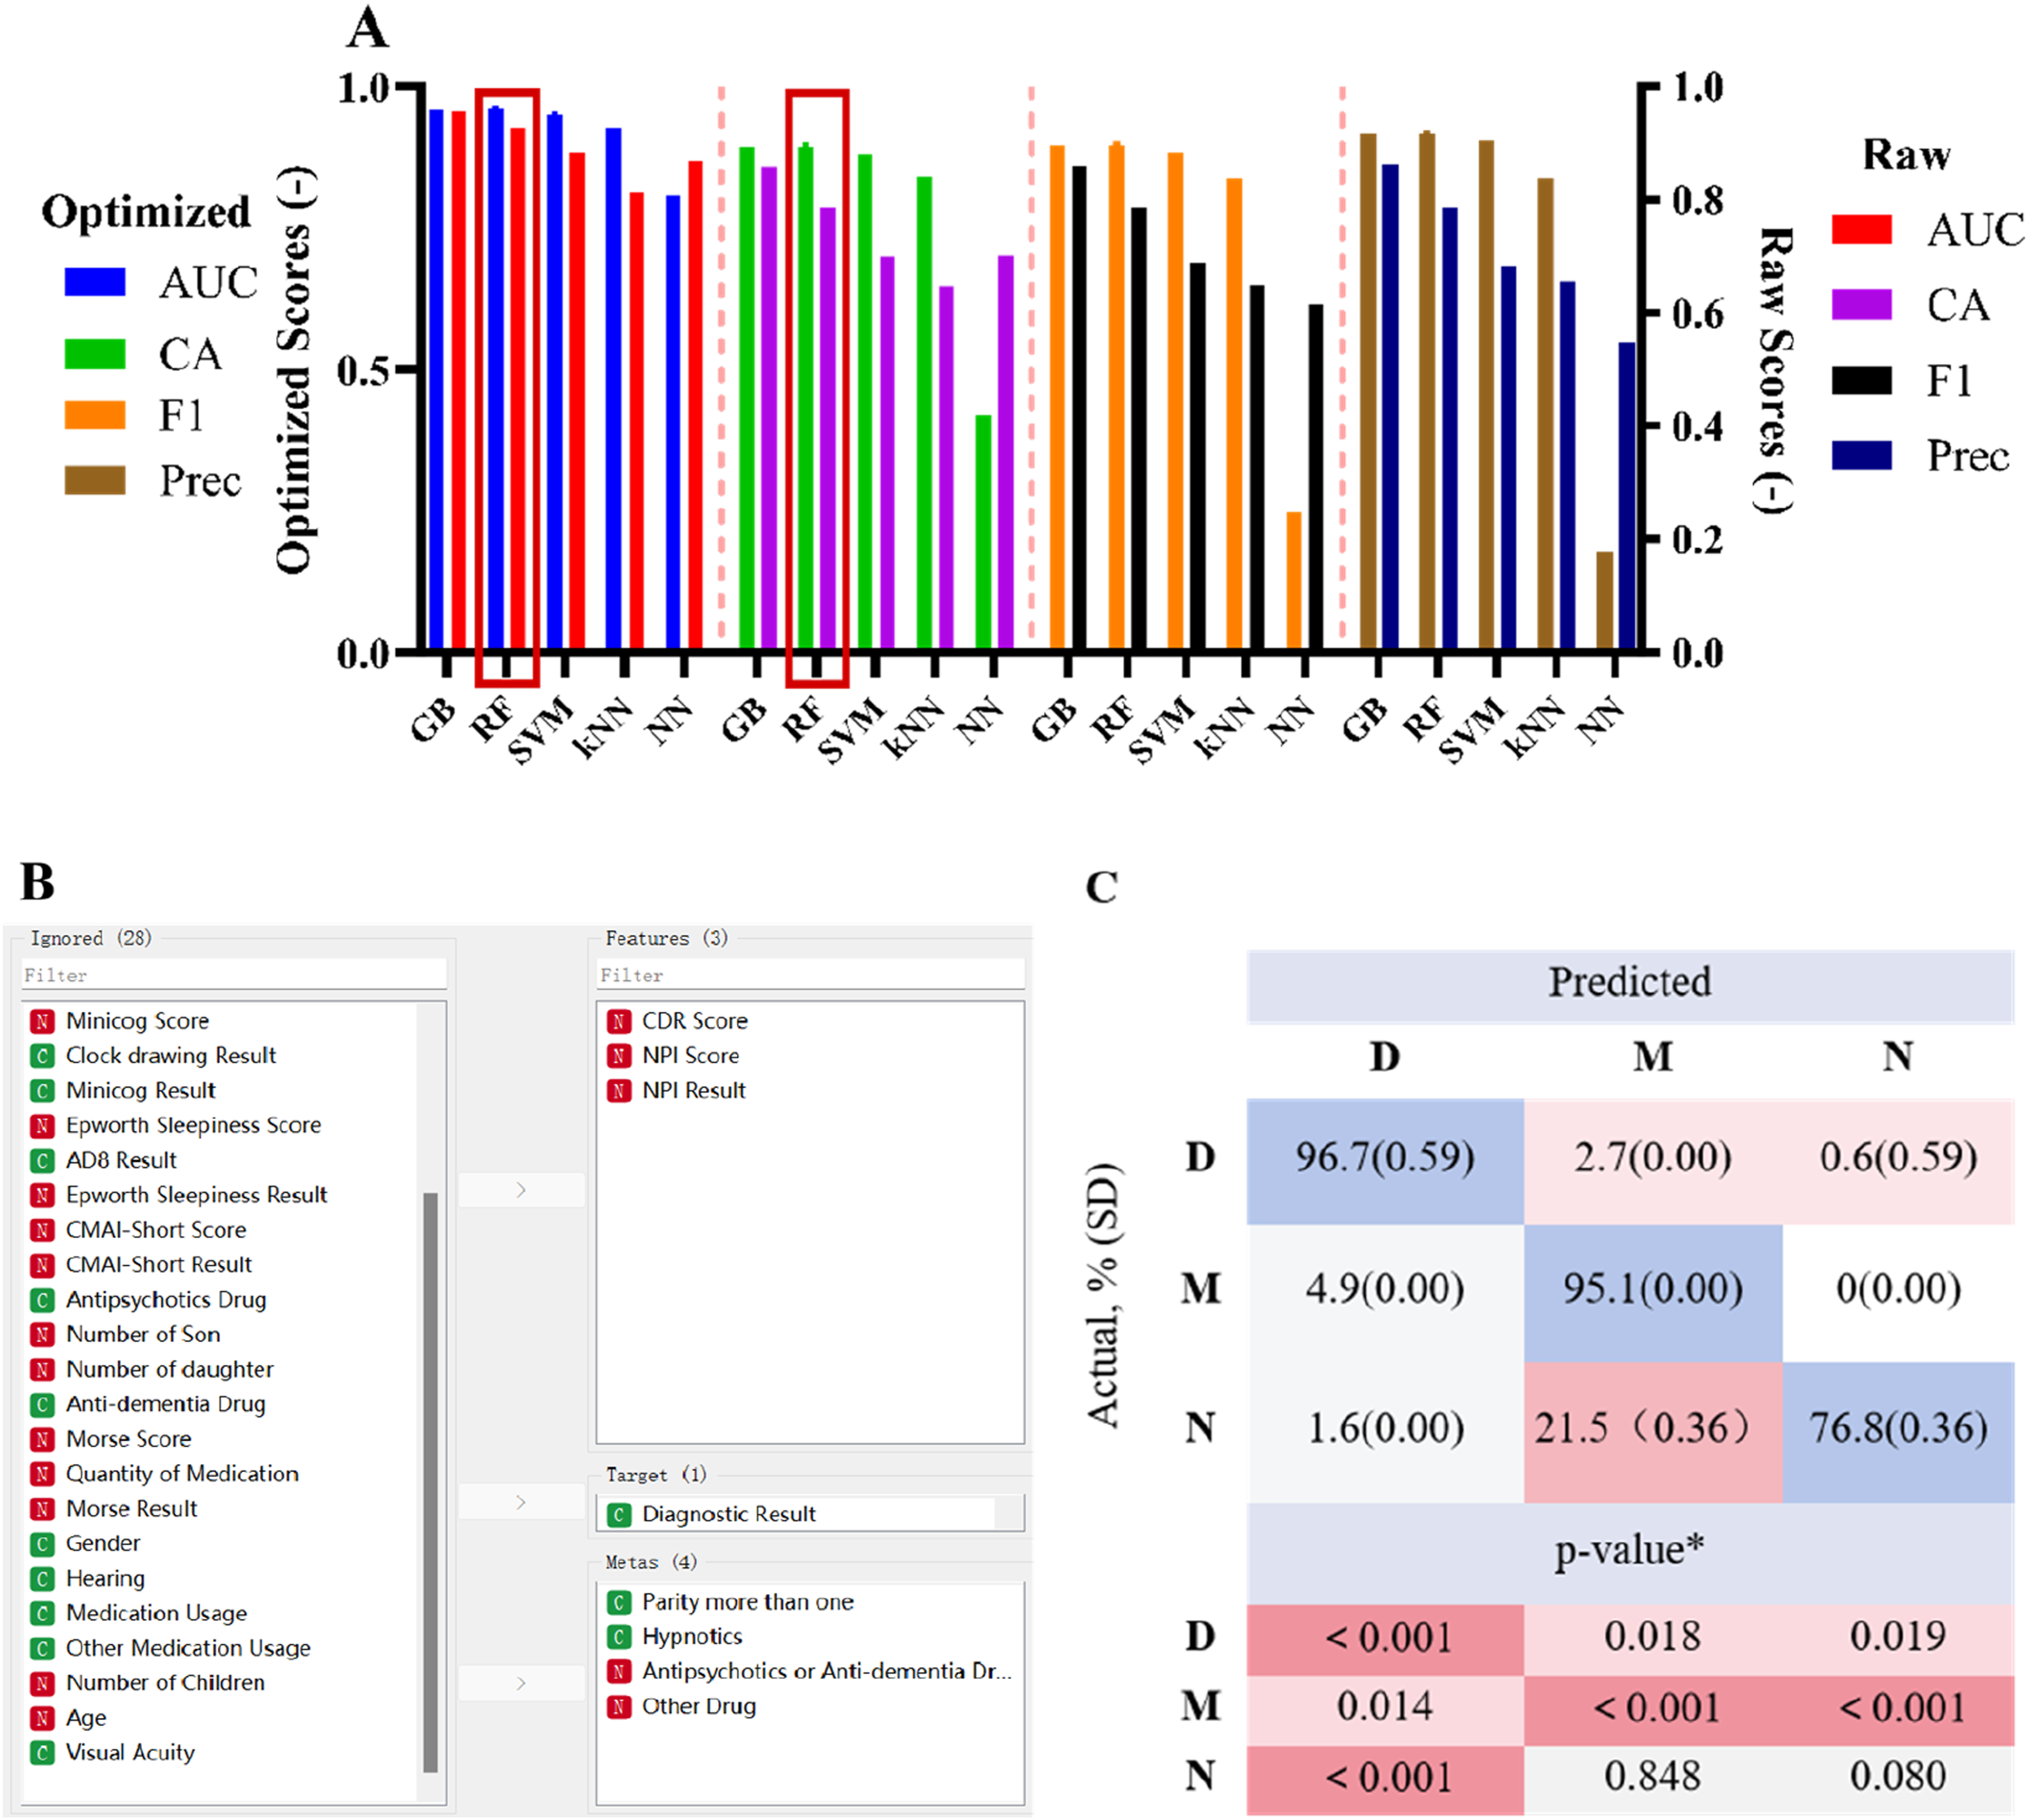
Figure 5(C) displays the confusion matrix results of the RF model. Regarding the improvement in the actual value ratios, post-optimization, both the dementia and MCI model judgments significantly improved compared to the original data, increasing from 92.8% to 96.7% and from 59.5% to 95.1%, respectively.
Discussion
This article proposes a classification model using machine learning to predict dementia and mild cognitive impairment in elderly individuals. The experiments demonstrate that through feature ranking and meta-feature analysis methods for model performance evaluation, critical feature factors, including CDR score, NPI score, NPI result, Parity more than one, Hypnotics, Antipsychotics or Anti-dementia Drug, Other Drug, were identified. The RF model outperforms existing machine models, exhibiting excellent discriminative ability, especially for patients with MCI.
Studies have observed that in females, a higher number of offspring is associated with an increased risk of dementia. 13 Our study found that this correlation was not exclusive to females (P < 0.001), as males who had more offspring also had a higher prevalence of dementia (P < 0.033). Various scales, such as MMSE, CDR, AD8, NPI, etc., are utilized in the early detection, assessment, screening, treatment monitoring, and quantification tracking of dementia or cognitive impairment.14-18 Doctors can diagnose whether a patient has dementia or cognitive impairment based on the results of these scales. We can rely on the results of most scales to assist in diagnosing the severity of dementia. However, we cannot determine which scale results are more reliable for diagnosis and the strength of the correlation between different scales and dementia diagnosis. Therefore, we need models such as ML for analysis and judgment to help us better select feature factors. Information Gain, AUC and CA are standard performance evaluation metrics in ML, frequently used by researchers to assess models for dementia or MCI.19,20 Meta-features are not original features used to train models but descriptors of the dataset’s inherent characteristics. They can assist in selecting suitable algorithms or models for data processing, enhancing model performance and generalization ability. 21 In our study, the CDR score is considered to be the most crucial predictive factor in ML, followed by NPI. The CDR 22 is a frequently employed cognitive diagnostic evaluation 23 that aligns with the gold standard criteria for diagnosing dementia. 24 On the other hand, NPI focuses on assessing behavioral issues related to neuropsychiatric symptoms, including depression, anxiety, hallucinations, and more. By combining the assessments from CDR and NPI, doctors can obtain a comprehensive understanding of the patient’s cognitive function and behavior.25,26
Our results indicate that we can utilize a RF model, using CDR score, NPI score, and NPI result as critical feature factors, while parity and medication status serve as meta-features, for model construction and application in the diagnosis of dementia and MCI.
There are several limitations in this research. Firstly, due to the cross-sectional nature of the study, we were unable to establish any causal relationships, emphasizing the necessity for future longitudinal studies. Secondly, the data were exclusively obtained from a single nursing home, underscoring the importance of conducting studies with larger sample sizes from multiple nursing homes to validate our observations. Additionally, the small sample size limited the effectiveness of neural network models, potentially leading to overfitting and reduced generalizability of the results.
Conclusion
This article proposes a machine learning classification model to predict dementia and mild cognitive impairment in the elderly. Experiments demonstrate that critical features, including CDR score, NPI score, NPI result, Parity of more than one, Hypnotics, Antipsychotics or Anti-dementia Drugs, and Other Drugs, were identified through feature ranking and meta-feature analysis. The RF model outperforms existing models, especially for patients with MCI. However, the model’s diagnostic performance for regular patients could be improved. Future efforts will focus on expanding new features (such as brain MRI or CT indicators) to enhance accuracy and differentiate regular patients better.
Supplemental Material
Supplemental Material - Identification of Dementia & Mild Cognitive Impairment in Chinese Elderly Using Machine Learning
Supplemental Material for Identification of Dementia & Mild Cognitive Impairment in Chinese Elderly Using Machine Learning by Tong-Tong Ying, Li-Ying Zhuang, Shan-Hu Xu, Shu-Feng Zhang, Li-Jun Huang, Wei-Wei Gao, Lu Liu, Qi-Lun Lai, Yue Lou and Xiao-Li Liu in American Journal of Alzheimer's Disease & Other Dementias®
Footnotes
Acknowledgments
We thank all the participants and their families who took part in this study. The authors would like to thank the Zhejiang Science and Technology Project for youth innovation in medical and health, research on the mechanisms of Mild Cognitive Impairment in older adults with coexisting hypertension (2023RC120), Zhejiang Provincial Natural Science Foundation (LQ19H090006) and the project of the Zhejiang Provincial Health Commission (2023KY006).
Author Contributions
T.-T. Y. and L.-Y. Z. contributed equally to this work. X.-L. L. conceived the project. L.-Y. Z. and S.-H. X. designed and performed the experiments. T.-T. Y., L. L., Q.-L. L. and S.-F. Z. was responsible for the collection of data. L.-Y. Z., L.-J. H. and W.-W. G. conducted the statistical analysis. Q.-L. L and Y. L. interpreted the data. T.-T. Y. and L.-Y. Z. wrote the manuscript and manuscript preparation. Overall, all authors provided suggestions during the preparation of the manuscript and approved the final version submitted for publication.
Declaration of Conflicting Interests
The author(s) declared no potential conflicts of interest with respect to the research, authorship, and/or publication of this article.
Funding
The author(s) disclosed receipt of the following financial support for the research, authorship, and/or publication of this article: This work was supported by the Zhejiang Science and Technology Project for youth innovation in medical and health, research on the mechanisms of Mild Cognitive Impairment in older adults with coexisting hypertension (2023RC120), Zhejiang Provincial Natural Science Foundation (LQ19H090006) and the project of the Zhejiang Provincial Health Commission (2023KY006).
Ethical Statement
Data Availability Statement
All the data used to support the findings of this study are included in the article.
Supplemental Material
Supplemental material for this article is available online.
Appendix
References
Supplementary Material
Please find the following supplemental material available below.
For Open Access articles published under a Creative Commons License, all supplemental material carries the same license as the article it is associated with.
For non-Open Access articles published, all supplemental material carries a non-exclusive license, and permission requests for re-use of supplemental material or any part of supplemental material shall be sent directly to the copyright owner as specified in the copyright notice associated with the article.