
Abstract
Dysregulation of the peripheral immune system is be involved in the neuroinflammation in Alzheimer disease (AD) and accelerate the disease progression. The contribution of immune cells, particularly B cells, to AD pathogenesis has gained attention in recent research. In this study, we investigated the role of Peripheral Blood Memory B cells (PBMBs) and their secreted Migration Inhibition Factor (MIF) in driving macrophage behavior in AD based on the scRNA-seq technique, immunofluorescence and flow cytometry. We discovered that MIF binds to the CD74-CD44 receptor complex on macrophages, influencing their behavior. The dysregulated macrophage response hampers the clearance of amyloid-beta (Aβ) plaques, exacerbating AD pathology. Targeting the MIF-CD74-CD44 signal pathway may hold therapeutic potential in modulating macrophage activity and mitigating neuroinflammation in AD. This study provides a further understanding of peripheral immune cells dysregulated in AD.
Keywords
Introduction
Alzheimer’s disease (AD) is a devastating neurodegenerative disorder characterized by the progressive loss of cognitive functions and memory decline. The exact etiology of AD remains elusive, but increasing evidence suggests that neuroinflammation plays a pivotal role in disease progression.1,2 Over the years, copious evidence from clinical and experimental research suggests peripheral immune system has been implicated in AD pathogenesis. 3 Moreover, peripheral immune cells, including macrophages, natural killer (NK) cells and neutrophils, are actively involved in the pathological response to AD. 4 Despite strong clinical implications, how peripheral immune cells influence AD progression remains enigmatic. 5 In addition, several large-scale studies have found no relationship between peripheral inflammation and AD.6,7 Peripheral immune cells across the BBB was not associated with neuroinflammation. 8 Therefore, it still needs further research.
Peripheral macrophages are among the major innate immune cells that can infiltrate the CNS in neuroinflammatory conditions. 9 Peripheral macrophages potentially restrict cerebral amyloid and participate in the progression of AD by infiltrating the brain.10,11 It is now generally accepted that M1 macrophages are thought to actively recruit to inflamed tissues and trigger pro-inflammatory innate immune responses. 12 Although previous research found that macrophages are associated with AD, but the accurate role of peripheral macrophages in AD remains unclear. Thus, understanding the factors that drive macrophage behavior in AD are critical for the development of targeted therapeutic interventions.
Recent research has shed light on the role of B cells in neuroinflammation and AD. 13 Peripheral Blood B cells have been shown to infiltrate the central nervous system (CNS) and contribute to AD pathogenesis through peripheral immune mechanisms, including secretion of various factors. 14 One of these factors is the Migration Inhibition Factor (MIF), a cytokine known for its pleiotropic effects on the immune system. In the context of AD, MIF has been investigated as a potential biomarker and contributor to the pathogenesis of the disease. 15 Studies have shown that increased levels of MIF have been observed in serum samples from AD patients compared to healthy controls. 16 These elevated MIF levels may reflect an inflammatory response associated with the disease process. 17 But there are as yet no studies to prove the reliability of MIF secreted by PBMBs in AD so far.
CD74 is an MHC class II-associated invariant chain expressed on the surface of various immune cells, including macrophages. 18 CD44 is a cell adhesion molecule involved in cell migration and inflammation. 19 It is known that the CD74-CD44 receptor complex, expressed on the surface of macrophages, has been identified as a key player in mediating the effects of MIF. 20 Binding of MIF to this receptor complex has been shown to modulate macrophage behavior, influencing their inflammatory response and phagocytic activity. 21 However, the specific role of PBMBs-secreted MIF in driving macrophage behavior in the context of AD remains relatively unexplored.
This study aims to investigate the functional consequences of MIF secretion by PBMBs and its interaction with the CD74-CD44 receptor complex on macrophages in AD. By deciphering the molecular mechanisms underlying the dysregulated macrophage behavior, this research may uncover potential therapeutic targets for mitigating neuroinflammation and slowing down AD progression.
Materials and Methods
scRNA-Seq Analysis
The scRNA-seq data (GSE181279) were obtained from the Gene Expression Omnibus (GEO), comprising 3 Alzheimer’s disease (AD) patients and 2 healthy control peripheral blood samples. 22 The scRNA-seq data were processed using the R package Seurat (v4.3.0). Quality control was performed to remove low-quality cells and genes. Cells with less than 200 genes sequenced and genes expressed in less than 3 cells were filtered out. The resulting PCA components were used for clustering the cells into distinct populations at a resolution of .1. Differential gene expression analysis was performed using the ‘FindAllMarkers’ function in Seurat with parameters min. pct = .25 and logfc. threshold = .25. The R package CellChat (v1.5.0) was utilized to analyze inferred cell-cell communications based on the scRNA-seq data. 23
Participants
RBC Lysing and Sample Preparing
Venous blood of all the participants was collected in EDTA-containing tubes. Lyse the RBC by the following procedure: ① Prepare the RBC Lysing solution: Dilute 10 mL Ammonium Chloride lyse (10x concentration) with 90 mL Millipore water. ② Pipette 750 μL blood into a 15 mL tube containing 10 mL RBC Lysing solution. ③ Invert/rock for 10min at room temperature. ④ Spin at 4°Cfor 10min at 300g; discard supernatant. ⑤ Re-suspend cell with 1 mL cold PBS/0.5%BSA. ⑥ Spin at 4°C for 10min at 300g; discard supernatant. ⑦ Fixation of Cells with 2% Paraformaldehyde (Sigma-Aldrich, #30525-89-4) 500 μL + PBS500 μL at room temperature for 10 minutes, Mixed and stored for later use.
Immunofluorescent Assay
Pipette blood samples into 1.5 mL EP tubes. Spin at 4°C for 10 minutes at 300g, then discard the supernatant. Add 200 μL of PBS/0.5% BSA and vortex. Next, incubate for 10 minutes with primary antibodies at 4°C. Spin at 4°C for 10 minutes at 300g, discard the supernatant, and add 200 μL of PBS/0.5% BSA. Incubate for 10 minutes with fluorescent-labeled secondary antibodies and DAPI at 4°C. Spin at 4°C for 10 minutes at 300g, discard the supernatant, and smear. Seal the slices with an anti-fluorescence quencher. Immunofluorescent images were captured using the fluorescence microscope (Leica DMI300B). The fluorescent intensity was acquired using the software ImageJ. The primary antibodies used in this study include: Rat-anti-human CD19 (Invitrogen, #11-0193-82), Mouse-anti-human CD27 (Sigma-Aldrich, #SAB4700131), Rabbit-anti-human MIF (Affinity, #DF6404), Mouse-anti-human CD68 (Invitrogen, #14-0688-82), Rat-anti-human CD44 (Invitrogen, #14-0441-82), and Goat-anti-human CD74 (Invitrogen, #PA5-143198). The secondary antibodies used in this study include: A594 Goat Anti-Rabbit IgG (Affinity, #S0006), A647 Goat Anti-Mouse IgG (Bi Yuntian, #A0473), A488 Donkey-anti-Mouse IgG (Invitrogen, #A21202), A647 Donkey anti-Rabbit IgG (Invitrogen, #A32795), and DAPI (Invitrogen, #D1306).
Enzyme-Linked Immunosorbent Assay (ELISA)
Blood samples were collected into EDTA tubes, and the upper plasma layer was separated by centrifugation at 3500 r/min for 10 minutes, then stored in a refrigerator at −80°C until further use. On the day of testing, samples were removed and dissolved at 4°C and rewarm to room temperature before testing. Plasma levels of amyloid-β (Aβ)40 and Aβ42 were measured using ELISA kits (Aβ40 ELISA kit, JL41245, and Aβ42 ELISA kit,JL41255) purchased from Jiangsu Biotechnology Co., LTD.
Flow Cytometry
Lyse 10 mL of blood by incubating it in a working solution of Ammonium Chloride Red Blood Cell Lysis Solution for a maximum of 10 minutes on a rocker at room temperature (RT). Wash the blood 2 times (2x) in 20-50 mL of RT PBS 1% BSA. Harvest 1 × 10^7 cells/mL after red blood cell lysis. Re-suspend the blood in 1 mL of PBS 1% BSA, centrifuge at 1200 r/min for 5 minutes, and discard the supernatant. Re-suspend the cells in PBS containing 1‰ Zombie Yellow and incubate at room temperature in the dark for 20 minutes. Add PBS (containing 1% BSA), centrifuge at 1200 r/min for 5 minutes, and discard the supernatant. Add 100 μL of PBS (containing 1% BSA) containing 5 μL CD45-AF700, 5 μL CD11b-FITC, 5 μL F4/80-APC-Cy7, and 5 μL CD86-PE and incubate for 20 minutes at 4°C in the dark. Resuspend the cells in PBS containing 1% BSA, and discard the supernatant by centrifugation at 1200 r/min for 5 minutes. With 100 μL of Fixation/Permeabilization solution, incubate the cells at 4°C, avoiding light, for 20 minutes. Add 500 μL of 1× True-Nuclear™ Perm Buffer and discard the supernatant by centrifugation at 1200 r/min for 5 minutes. Resuspend the cells by adding 100 μL of 1× Perm/Wash™ buffer containing 5 μL CD206-APC and incubate for 30 minutes at 4°C in the dark. Add 500 μL of 1× Perm/Wash™ buffer and discard the supernatant by centrifugation at 1200 r/min for 5 minutes. Resuspend the cells by adding 400 μL of PBS containing 1% BSA and acquire data by flow cytometry (CytoFLEX S). Analyze the fixed cells within 24 hours. The fluorescent-coupled antibodies used in this study include Alexa Fluor® 700 anti-human CD45 (BioLegend, #304024), FITC anti-mouse/human CD11b (BioLegend, #101206), PE anti-mouse CD86 (BioLegend, #105008), APC anti-mouse CD206 (MMR) (Invitrogen, #141708), and APC/Cyanine7 anti-mouse F4/80 (BioLegend, #123118).
Statistical Analysis
All statistical analyses were conducted using GraphPad Prism5. The measurement data were expressed as Mean ± SD, and an unpaired t test was employed to compare the 2 groups of data following normal distribution and homogeneity of variance. Spearman’s rank correlation test was used to analyze the correlation between the indicators. A P-value of less than .05 was considered statistically significant.
Results
Memory B Cells and Macrophages Clustering Identification
The single-cell RNA-seq profiling of the GSE181279 dataset was used to group the cells. In total, 10 cell clusters were identified based on enriched genes expressed by each cell type (Figure 1A), including 2 B cell subpopulations and macrophages. All the B cells were characterized by a high expression level of CD19, while 2 subsets could be distinguished by high expression of CD79B and CD27, namely Mature B cells and Memory B cells, which were preferentially expressed in clusters 2 and 10, respectively (Figure 1B). Meanwhile, CD68 and MS4A7 were used to identify macrophages, which were preferentially expressed in cluster 6 (Figure 1B). To better explore the cell-cell communications between macrophages and B cells in the peripheral immune system of AD, 2 B cell subpopulations and macrophages identified from scRNA-seq data were isolated for further analysis using the R package CellChat (Figure 1C). Both macrophages and Memory B cell clusters were significantly increased in the AD group compared with the Healthy group, while the Mature B cell showed a decreasing trend in the AD group (Figure 1D). In the subsequent analysis, we mainly focused on the macrophages cluster and Memory B cell cluster. More importantly, in the subsequent immunofluorescence semi-quantitative analysis, it was also observed that the average expression levels of Macrophages and Memory B cells in AD patients were higher than those in healthy controls (Figure 3D). Identification of 2 B Cell Subclusters and Macrophages from AD Peripheral Blood. (A) UMAP plot showing 10 cell types in both Healthy and AD peripheral blood. (B) VIN plot displaying the expression levels of features for B cells and Macrophages. CD68 and MS4A7 for Macrophages, CD19 for all B cells, and CD79 B and CD27 for newly identified B cells. (C) Isolation of 2 B cell subclusters and Macrophages from the peripheral blood. (D) Stacked bar plot illustrating the comparison of the frequencies of 2 B cell subclusters and Macrophages.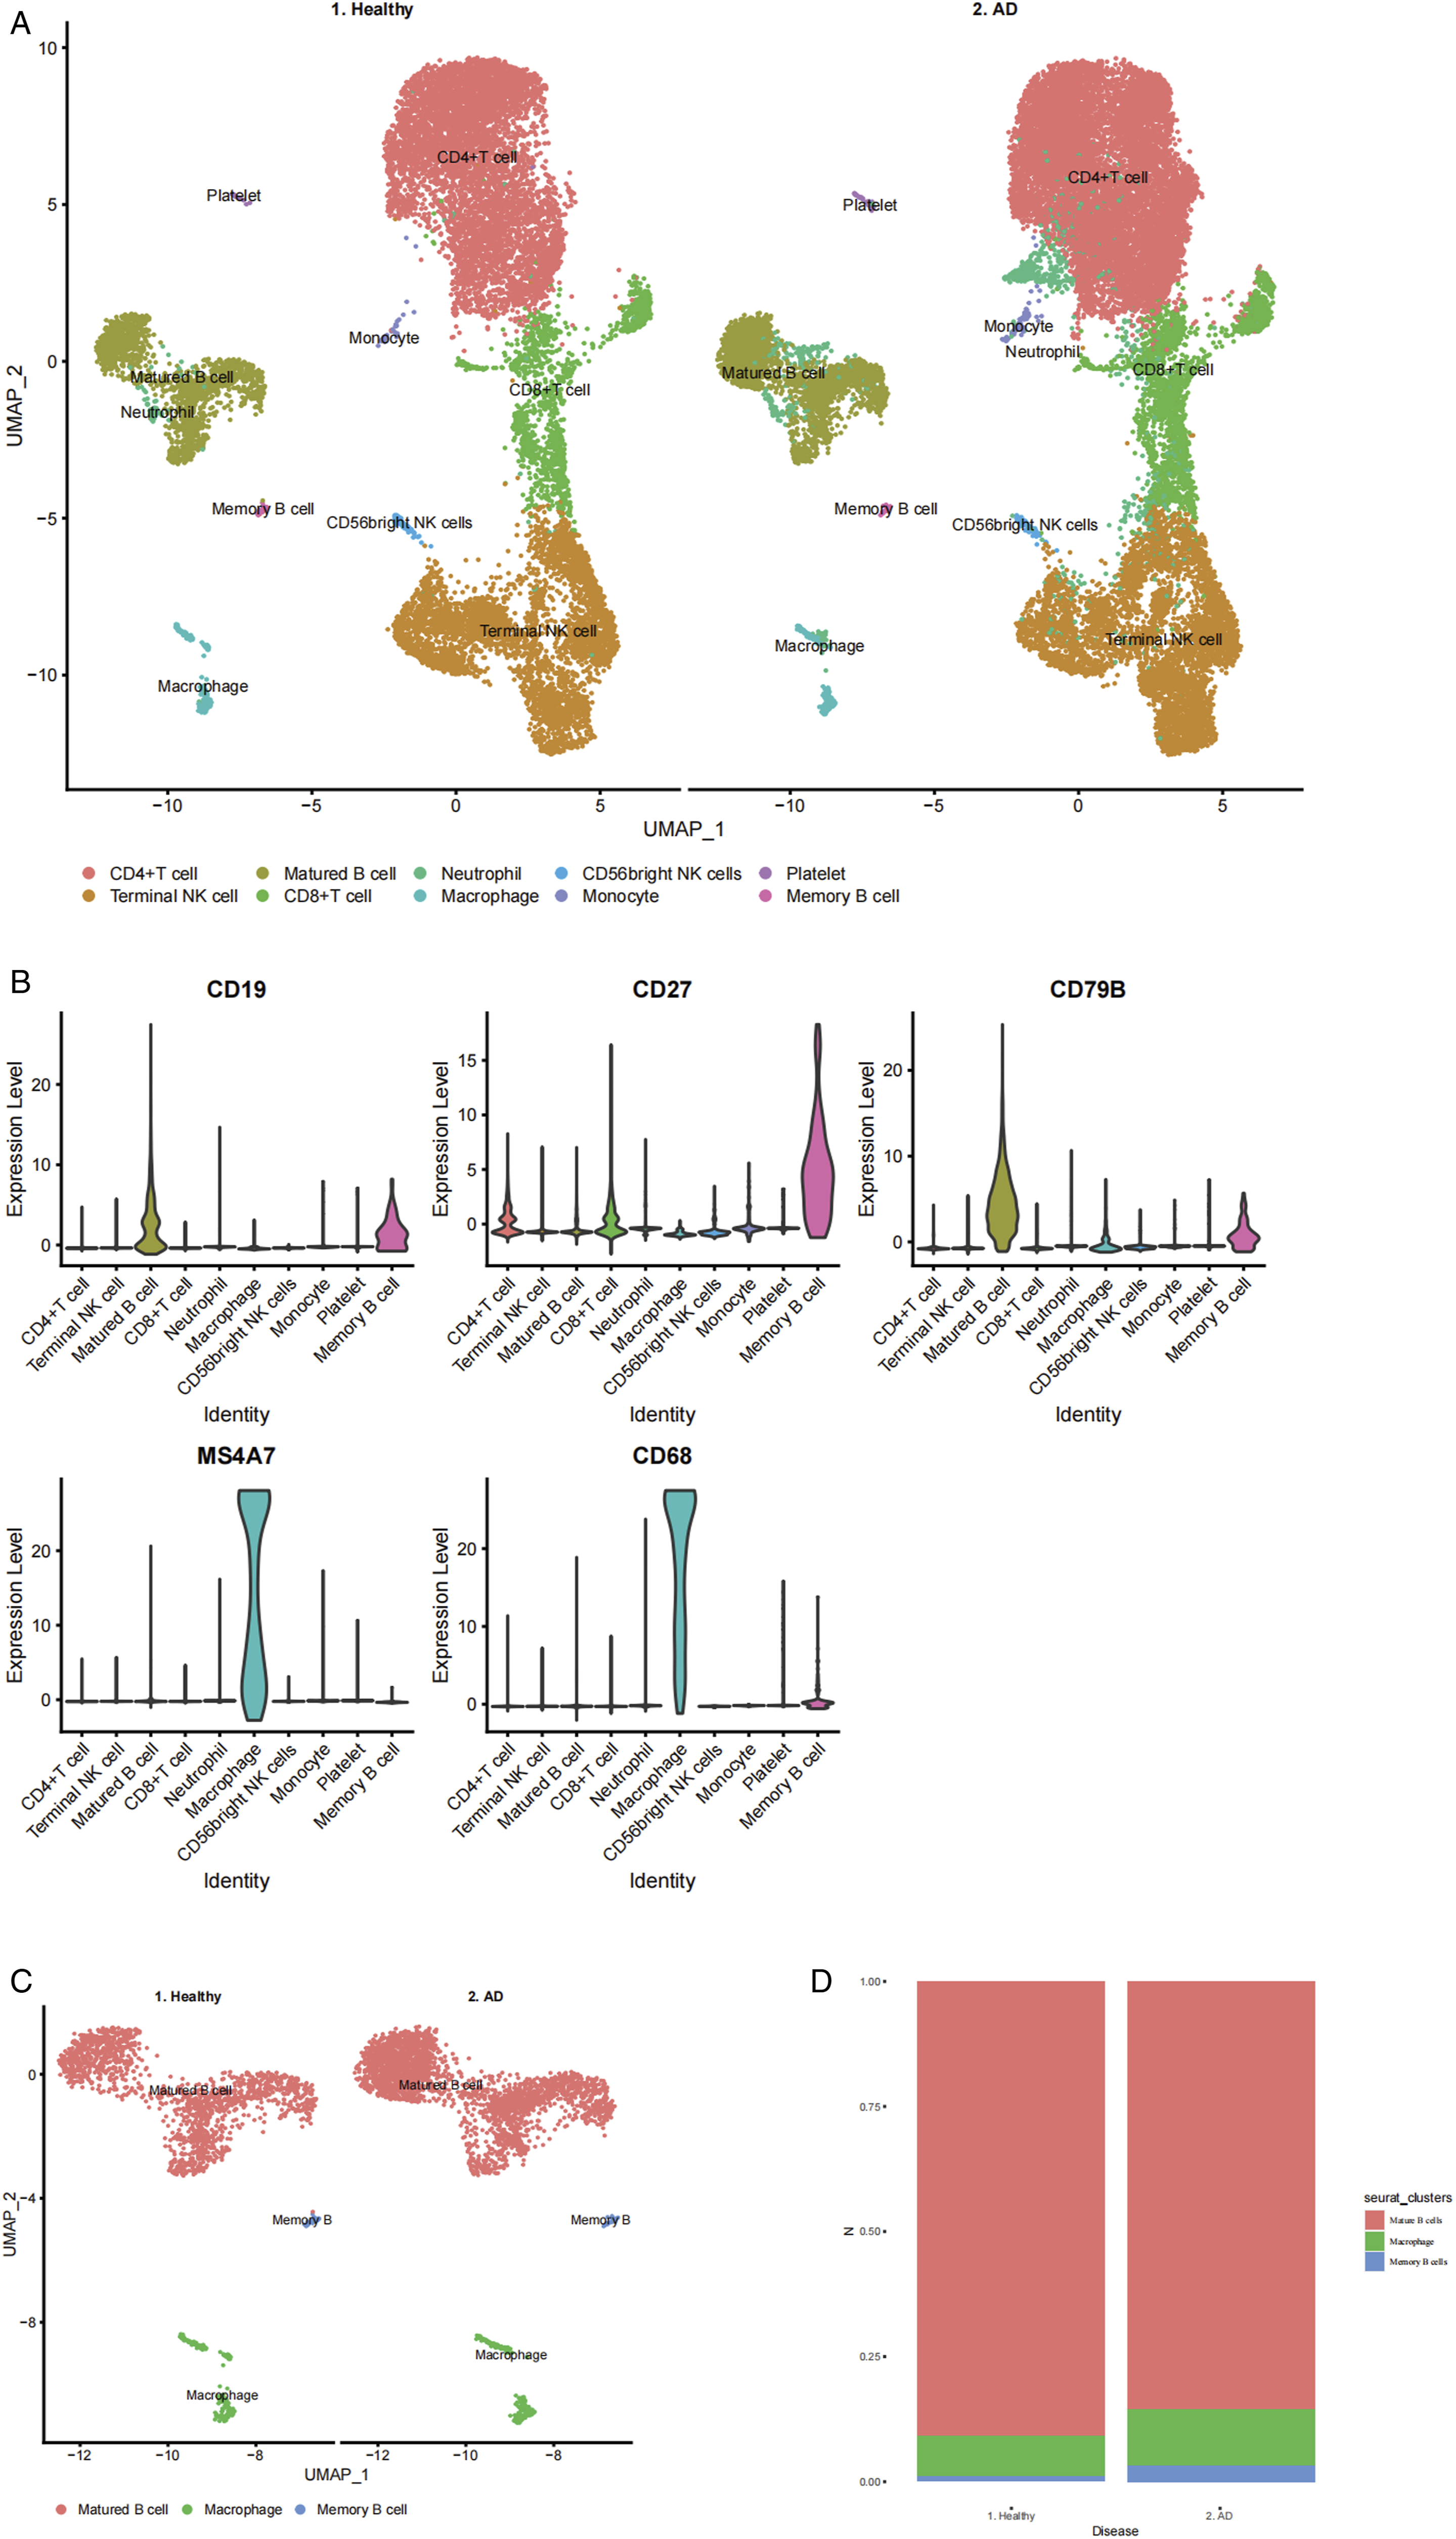
Memory B Cells - Secreted MIF Conducted a Major Signal Between Memory B Cells and Macrophages in AD
A global analysis of cell-cell communication among these 10 clusters showed a decrease in the number of interactions but an increase in interaction strength in AD compared to Healthy (Figure 2A). We then compared the number of interactions and interaction strength among different cell populations using a circle plot. As expected, both the cell-cell interaction numbers and the interaction strength between macrophages and Memory B cells increased (Figures 2B). Since Memory B cells and macrophages were identified as significant peripheral immune cells in AD, we intensively investigated the signaling pathways that contribute to the communication between Memory B cells and macrophages. Then, the signals between Memory B cells and macrophages were examined and compared in AD. Among these, MIF derived from Memory B cells emerged as the major signal interacting with macrophages in AD (Figure 2C-E). Identification of the Signaling Pathway between Macrophages and Memory B Cells. (A) Comparison of the total number of interactions and interaction strength in Healthy and AD. (B) Comparison of the number of interactions and interaction strength among different cell populations. (C) Plot of the aggregated cell-cell communication network at the signaling pathway level. (D) Computation of the contribution of each ligand-receptor pair to the MIF signaling pathway. (E) Dot plot demonstrating that MIF is the major signaling target for Macrophages and Memory B Cells in AD.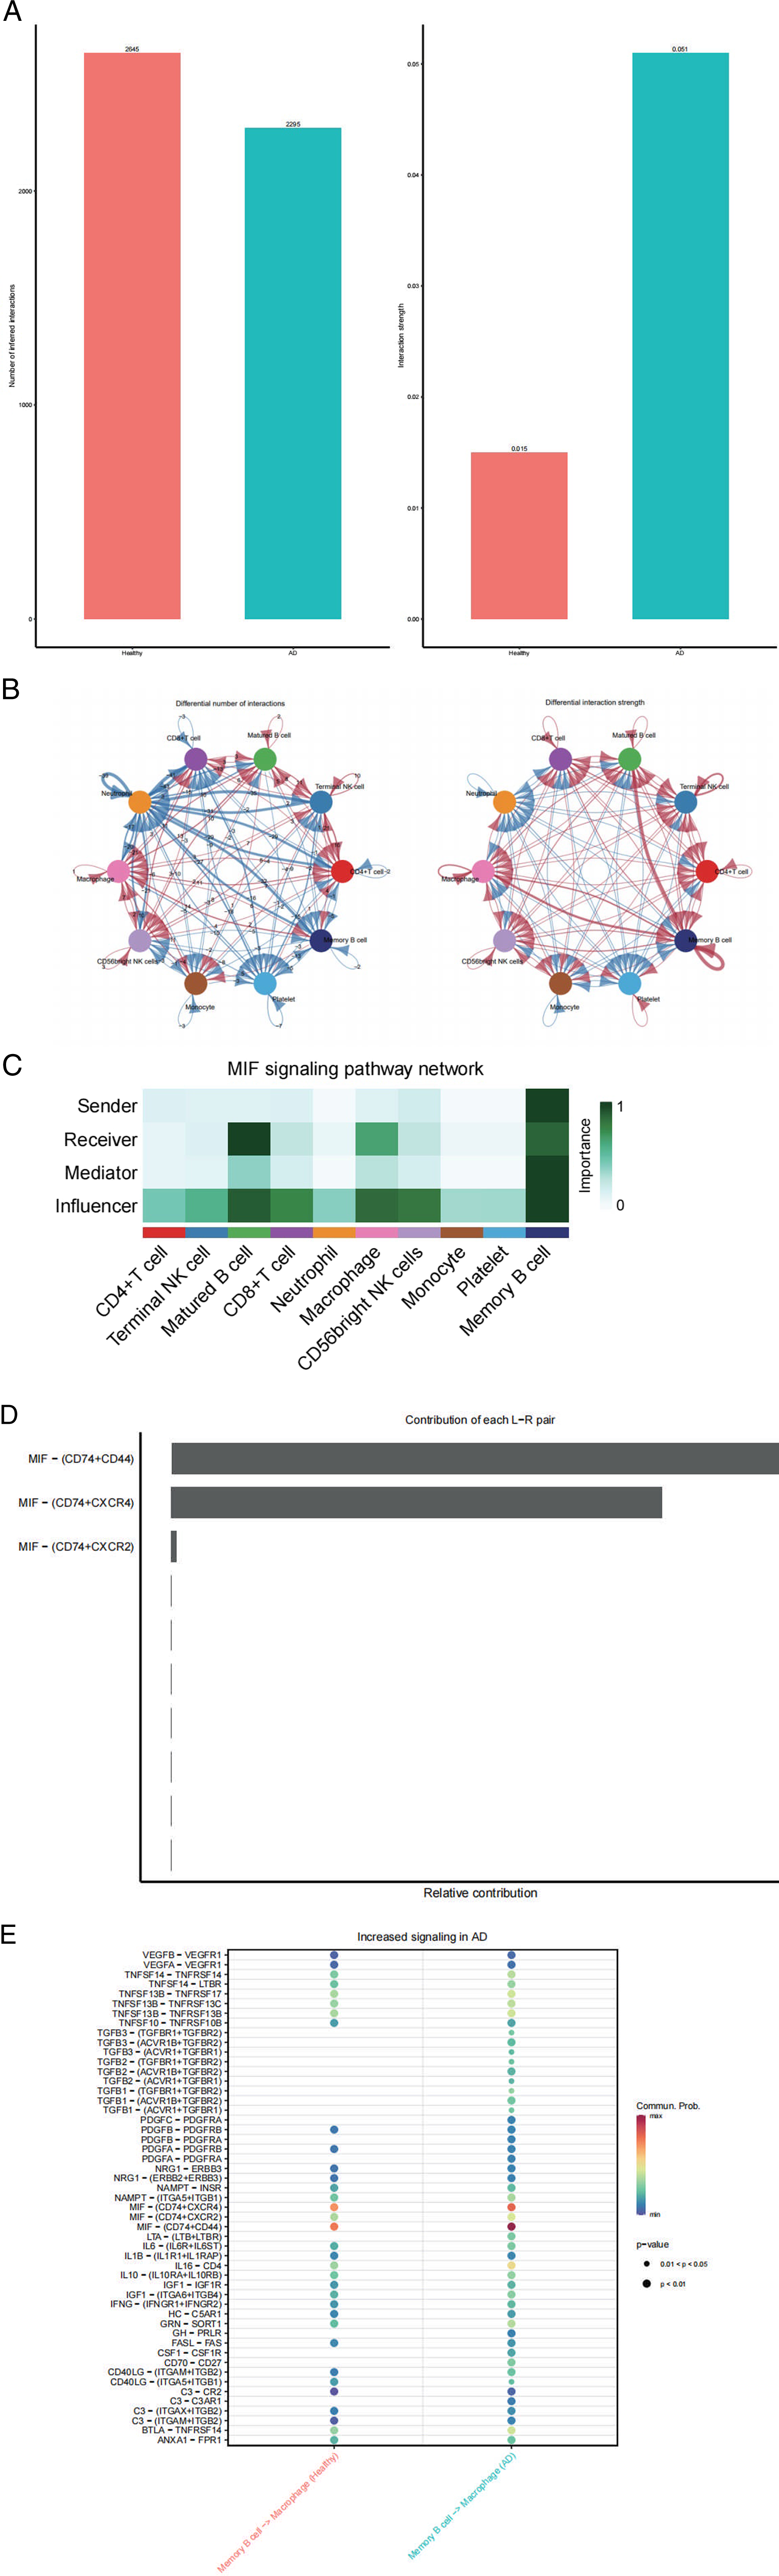
Consistently, the genetic expression VINPlot showed that MIF was mainly produced by Memory B cells, and macrophages significantly expressed the CD74-CD44 receptor complex for MIF (Figure 3A) in AD. Furthermore, the Immunofluorescent assay of AD showed that the main source of MIF was expressed on Memory B cells (Figure 3B), while the CD74-CD44 receptor complex was expressed on macrophages (Figure 3C). Double immunofluorescent staining revealed co-localization of MIF and CD74-CD44 receptor complex proteins in macrophages (Figure 3E). Memory B Cells - Secreted MIF Conducts a Major Signal between Memory B Cells and Macrophages in AD. (A) VIN plot showing that MIF is mainly produced by Memory B Cells, and Macrophages significantly express the CD74-CD44 receptor complex. (B) Immunofluorescent imaging analysis demonstrating MIF expression on Memory B Cells. (C) Immunofluorescent imaging analysis revealing CD74-CD44 receptor complex expression on Macrophages. (D) The immunofluorescence semi-quantitative expression of macrophages and memory B cells. ***P < .001. (E) Double immunofluorescent staining showing co-localization of MIF and CD74-CD44 receptor complex proteins.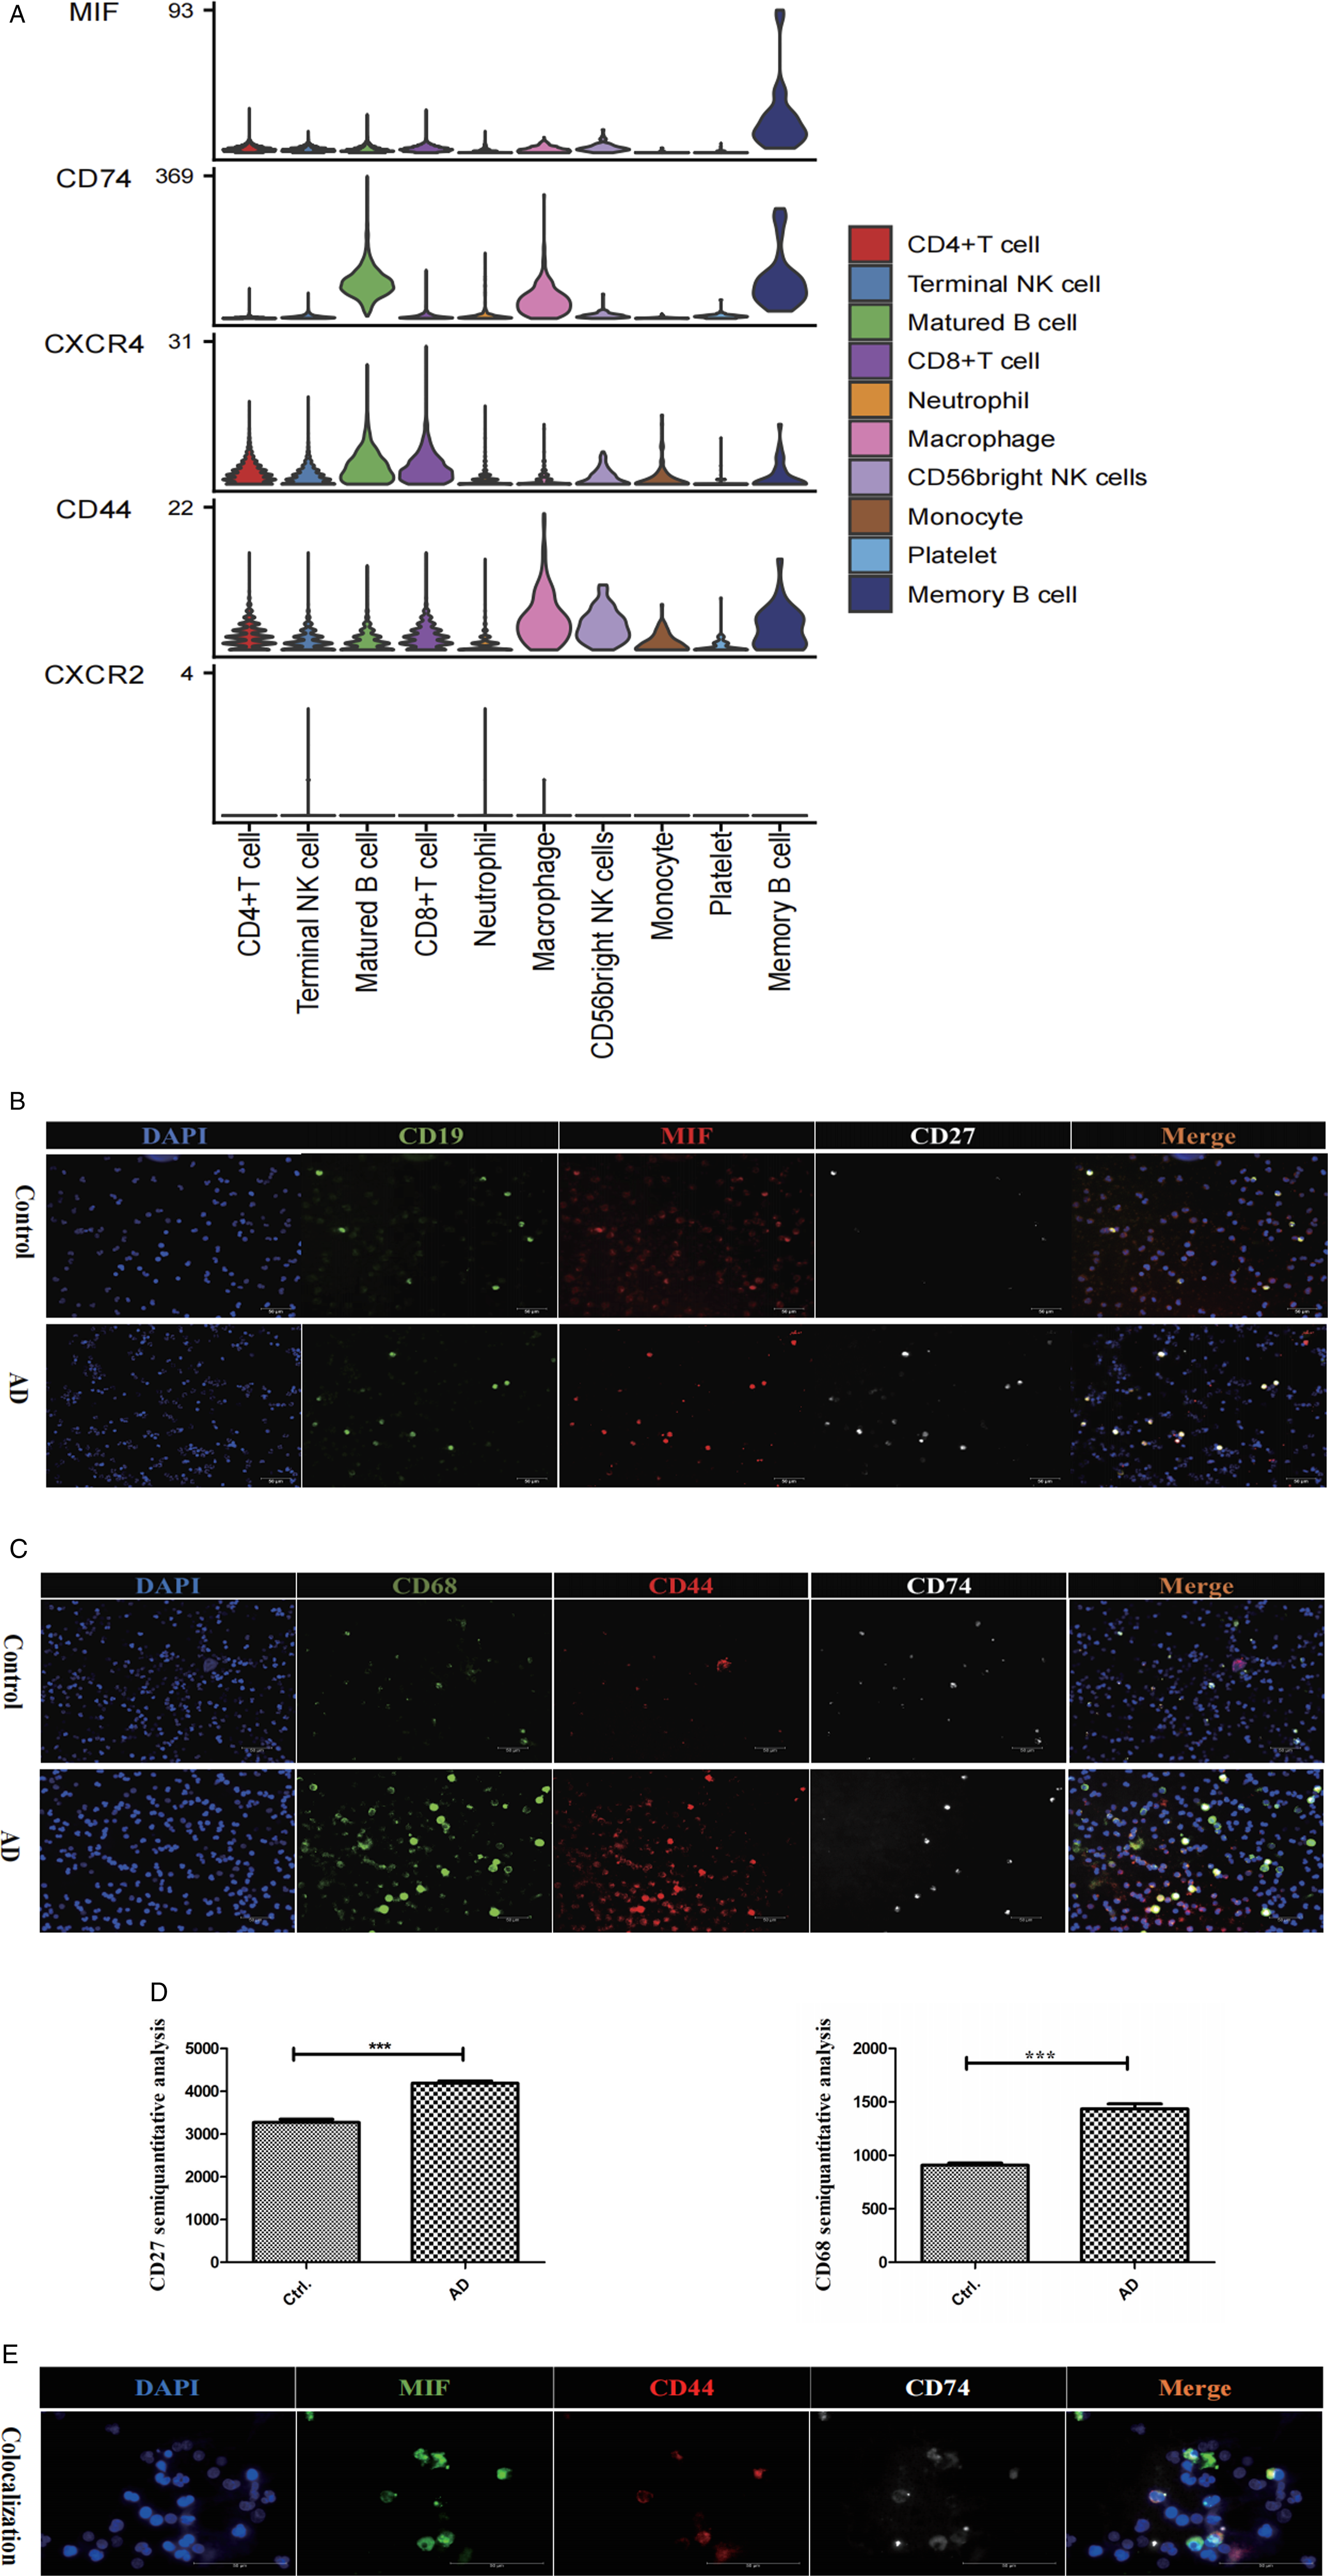
Memory B Cells - Secreted MIF Drives Macrophage Behavior in AD
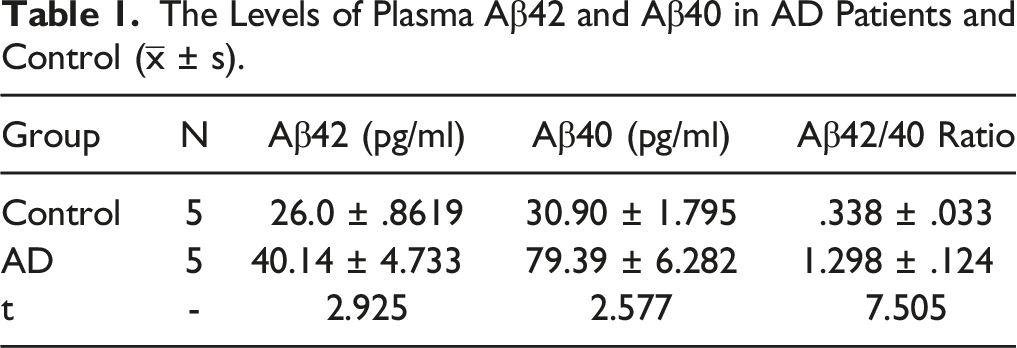
To validate and determine which macrophage phenotypes exist in AD, peripheral blood from AD patients and healthy controls was analyzed using flow cytometry. Based on the flow cytometry analysis, we found that M1 macrophages were significantly increased in the AD group compared to the Healthy group (Figure 4A and B). This suggests that M1 macrophages could be the primary macrophage phenotype in the development of AD. Hence, we hypothesized that MIF, driving the transformation of macrophages into M1 macrophages, plays an active role in AD, as these M1 macrophages are recruited to the brain to clear amyloid plaques. To confirm this, the levels of Aβ42 and Aβ40 were detected by ELISA, and the data are presented in Table 1. The results showed that the levels of Aβ42 in the AD group were significantly lower than those in the healthy control group, while Aβ40 levels were significantly higher (P < .05). We analyzed the association among plasma Aβ40 levels, Aβ42 levels, Aβ42/40 ratio, and M1 Macrophages using Spearman’s rank correlation test. Increased M1 Macrophages were negatively correlated with plasma Aβ42 levels (r = −.9152, P < .05) and Aβ42/40 ratio (r = −.9636, P < .05), but positively correlated with Aβ40 levels (r = .9758, P < .05) (Figure 4C). This is an important finding in the understanding of the association between plasma Aβ and M1 Macrophages. The negative correlation suggests that as M1 Macrophages levels increase, the levels of Aβ42 and the Aβ42/40 ratio decrease. This negative correlation could imply that higher M1 Macrophages activity or presence is associated with reduced levels of Aβ42, possibly indicating a role of M1 Macrophages in clearing or influencing the metabolism of Aβ42. In addition, the positive correlation indicates that as M1 Macrophages levels increase, so do the levels of Aβ40. This positive correlation might suggest that M1 Macrophages are associated with increased levels of Aβ40. It could be indicative of a different role of macrophages in the metabolism or clearance of Aβ40 compared to Aβ42. M1 Macrophages Were the Main Macrophage Phenotype in AD. (A) Flow cytometry analysis validating that M1 macrophages were the predominant macrophage phenotype in AD. (B) Dot plots displaying the statistical analysis of M1 macrophages in AD (n = 5) compared with Healthy (n = 5). Data represents consistent results from at least 3 independent experiments. ***P < .001. (C) The correlation among plasma Aβ40, Aβ42 levels, Aβ42/40 ratio and M1 Macrophages. ***P < .001. The Levels of Plasma Aβ42 and Aβ40 in AD Patients and Control (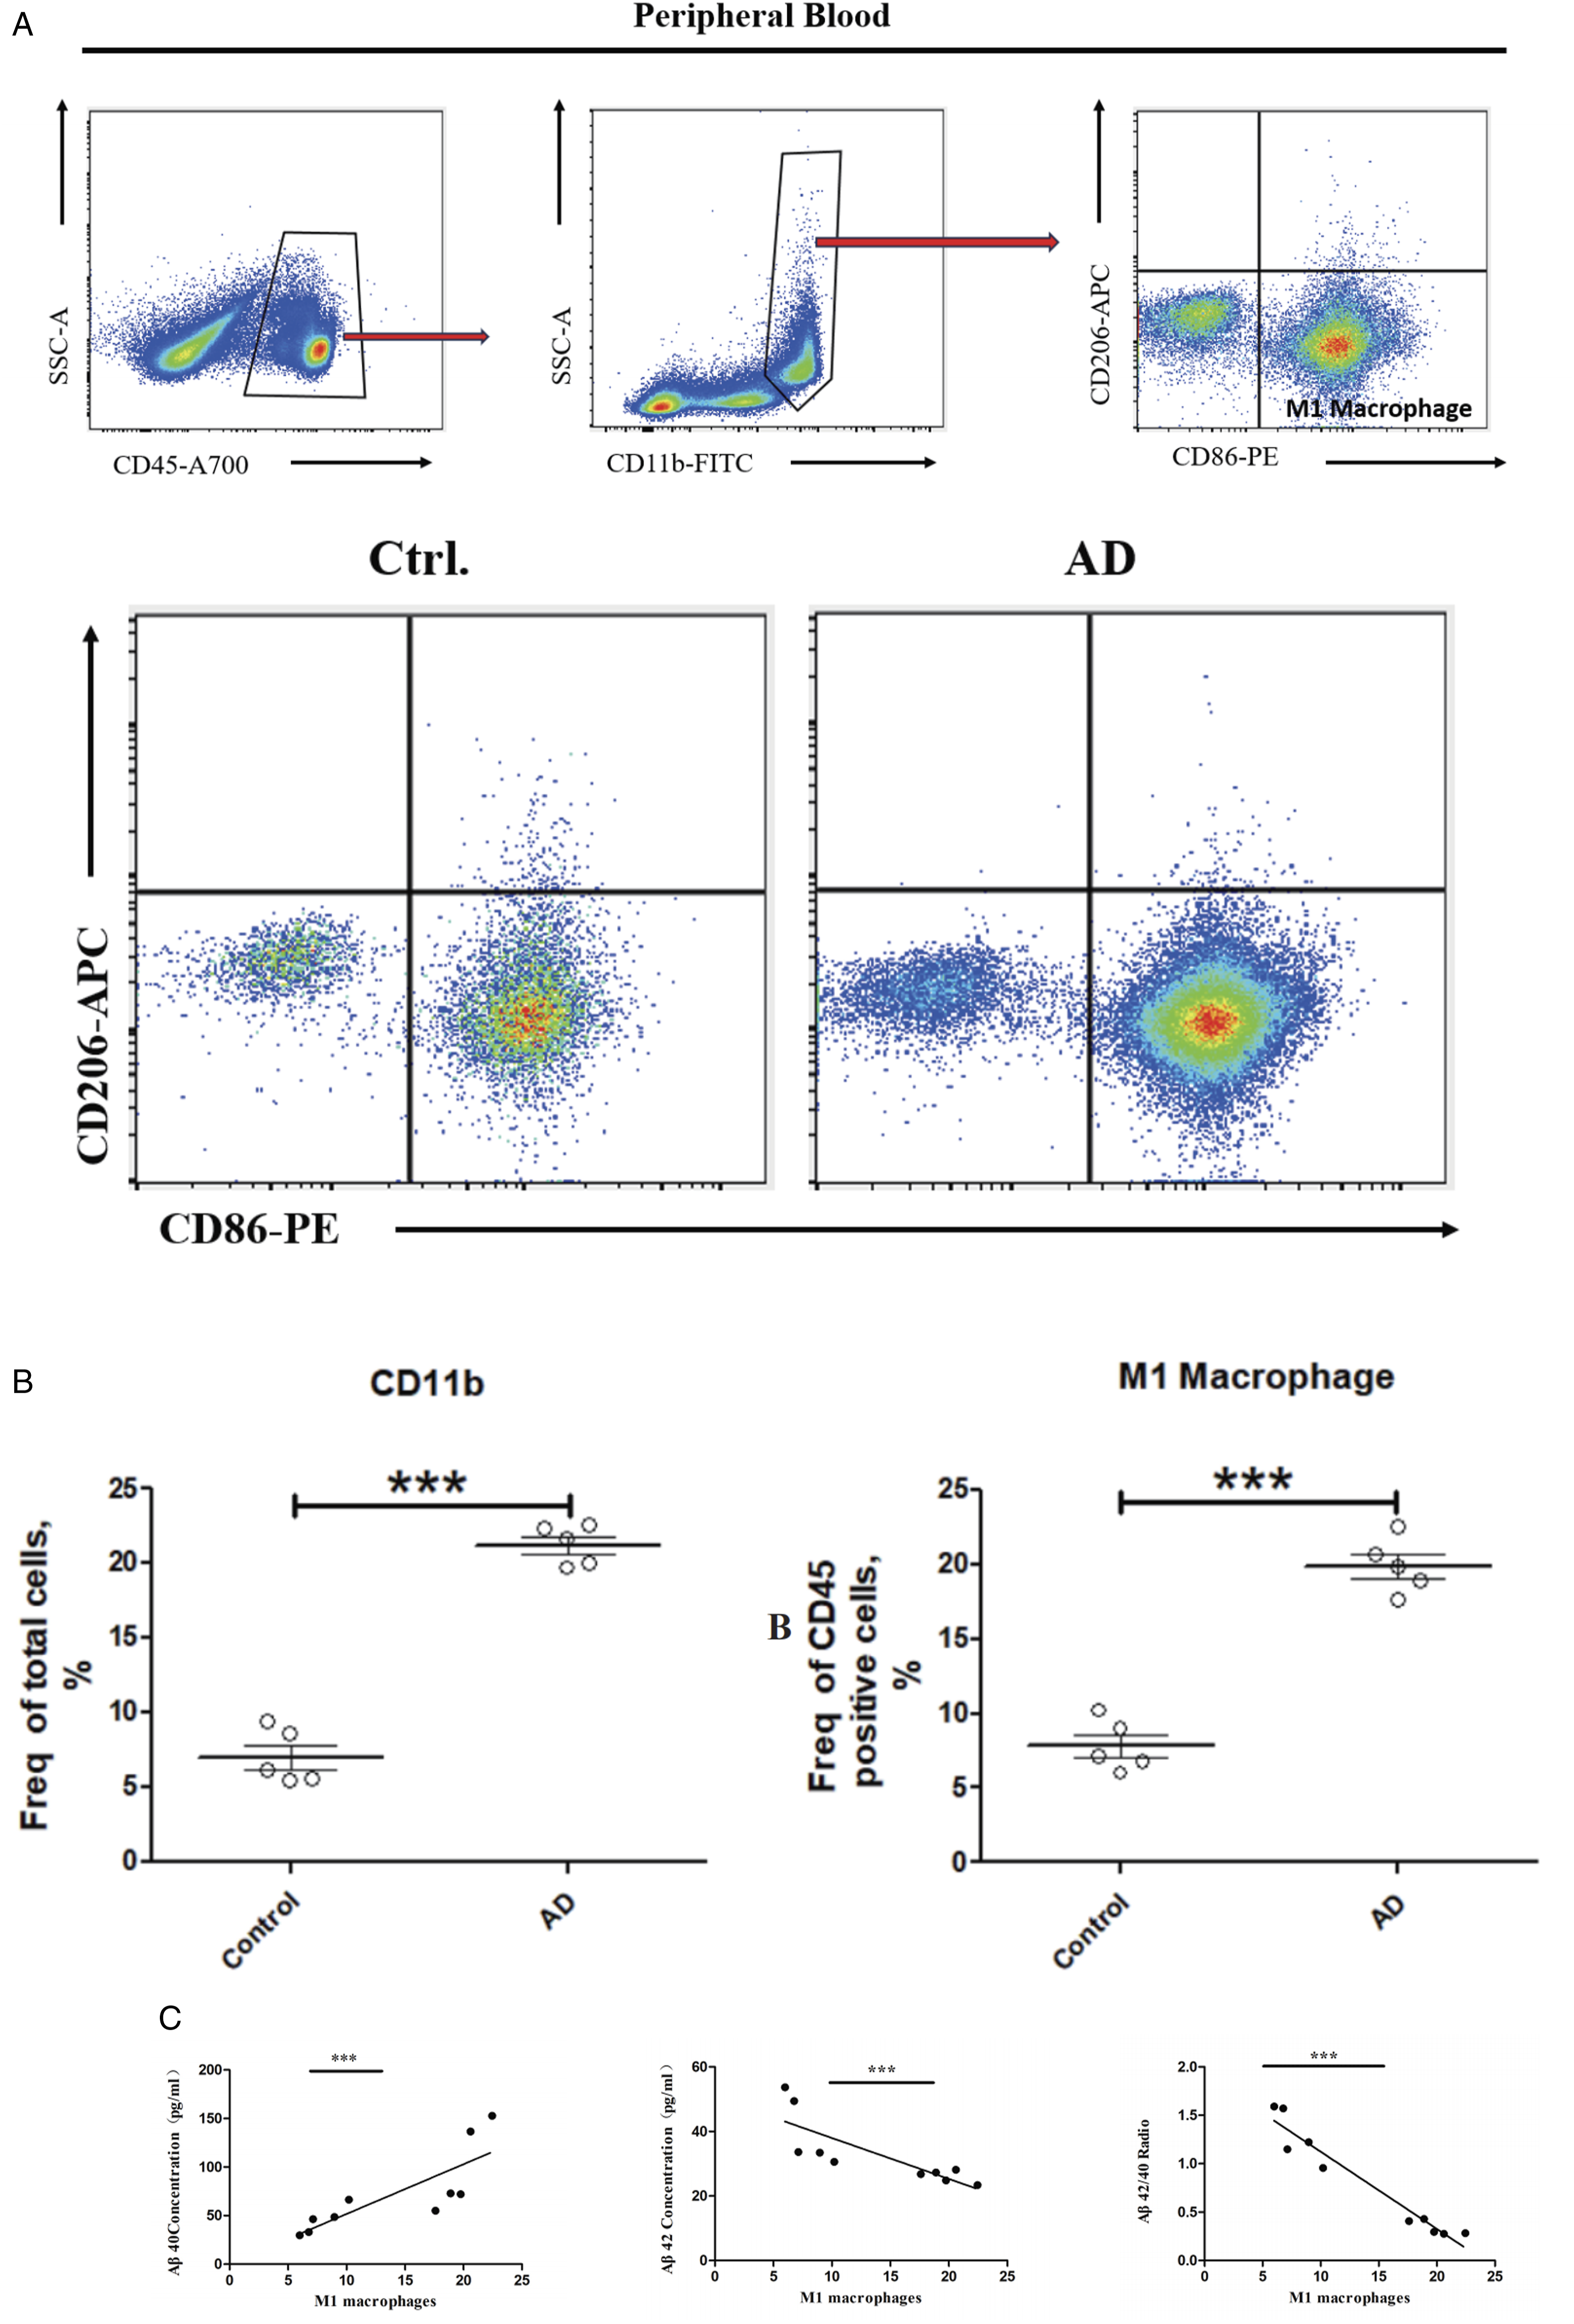
Discussion
Immune dysfunction as a cause of AD pathogenesis and progression was previously thought to be restricted to the immune process in the CNS, but accumulating data indicate pivotal contributions of the peripheral immune system as well. 5 Both central and peripheral immune responses are closely related to pathological alterations in AD. 9 At the same time, there is growing evidence that peripheral immune cells are involved in the occurrence of AD. 25 Although the role played by peripheral immune cells in AD pathogenesis is prominent, their specific mechanism is still not clear. This study helps to better understand the molecular mechanism of peripheral immune cells in AD.
The present study provides compelling evidence that MIF secreted by PBMBs plays a critical role in modulating macrophage behavior in the context of AD. The identification of PBMB-secreted MIF as a key mediator in the neuroinflammatory process is consistent with the emerging understanding of B cell involvement in AD. Previous research has highlighted the presence of B cells in the CNS and their ability to influence the neuroinflammatory response through cytokine secretion and antigen presentation. 26 The current study extends this knowledge by elucidating the specific role of MIF in driving macrophage behavior in AD. The dysregulation of macrophage behavior observed in response to MIF binding likely contributes to the chronic neuroinflammation seen in AD. Macrophages in AD brains have been shown to accumulate around amyloid-beta (Aβ) plaques and phagocytose Aβ, but their inflammatory response is often not sufficient to clear the toxic aggregates effectively. 27 The MIF-mediated alterations in macrophage activity might hamper their ability to efficiently clear Aβ, 28 thereby contributing to plaque persistence and disease progression. Our study yielded a similar pattern of results. The findings highlight distinct associations between macrophage levels and various Aβ measures within the context of AD. These correlations offer valuable insights into potential interactions between macrophages and Aβ species in the AD milieu. It is crucial to interpret these findings within the broader context of the understanding of neuroinflammation and immune responses in Alzheimer’s pathology.
The interaction between MIF and the CD74-CD44 receptor complex is of particular interest in this study. Likewise, our study found, in agreement with previous studies, that MIF exerts its effects through binding to the CD74-CD44 receptor complex on macrophages, 29 leading to dysregulated macrophage behavior and exacerbation of neuroinflammation, which is a hallmark feature of AD pathology. Our results showed that the increase in the number of peripheral blood macrophages in patients with AD is due to the fact that MIF binding to the CD74-CD44 receptor complex induces a signaling cascade that results in the regulation of macrophage proliferation and survival. 30 Moreover, we confirmed that M1 macrophages were the most relevant cell type to AD. MIF regulates the conversion of macrophages from AD patients to M1 macrophages that might migrate from the peripheral blood to the brain in an attempt to clear amyloid deposits. This finding is in line with previous research showing that MIF induces pro-inflammatory responses and modulates macrophage polarization in other inflammatory conditions. 31 Nevertheless, our results showed an increase in macrophages in AD patients compared to controls, which contradicts previous some studies. 22 We speculate that this discrepancy may be related to the stage of the disease that the patients are in. The changes of macrophages phenotypes depend on the disease stages and severity; 12 mastering the stage-specific switching of M1/M2 phenotypes within appropriate time windows may provide better therapeutic benefit. 29 Further research is needed to provide deeper insights into this phenomenon.
The findings of this study have potential therapeutic implications. Targeting the MIF-CD74-CD44 axis could be a promising approach for regulating macrophage behavior and ameliorating neuroinflammation in AD. Previous studies have shown that blocking MIF or interfering with its downstream signaling pathways can alleviate neuroinflammation and reduce neuronal apoptosis in AD models. 15 Similarly, CD74 and CD44 have also been proposed as potential therapeutic targets in various inflammatory diseases and cancers. 32 Modulation of CD74 and CD44 function might show promise for the effective amelioration of AD. Further clinical studies are needed to confirm this.
However, some questions still remain unanswered. Further research is needed to elucidate the precise mechanisms by which MIF binding to the CD74-CD44 receptor complex influences macrophage polarization and function in AD. Additionally, the understanding of the relationship between peripheral blood macrophage phenotypes and AD is still unclear. The cause of the change in peripheral blood macrophages remains unclear. New findings could provide further insights into this phenomenon. Moreover, in this study, we don’t investigate the cross-talk between PBMBs, other immune cells, and the CNS microenvironment, which could provide a more comprehensive understanding of the complex immune response in AD.
Conclusions
In conclusion, this study highlights the critical role of MIF secreted by PBMBs and its interaction with the CD74-CD44 receptor complex in driving macrophage behavior in AD. The identification of this novel pathway provides valuable insights into the neuroinflammatory mechanisms underlying AD pathogenesis. Targeting the MIF-CD74-CD44 axis could hold therapeutic promise in modulating macrophage activity and ameliorating neuroinflammation in AD.
Footnotes
Authors’ Contributions
Bo Liu, Wei Luo, and Ling Huang contributed equally to this work.
Declaration of Conflicting Interests
The author(s) declared no potential conflicts of interest with respect to the research, authorship, and/or publication of this article.
Funding
The author(s) received no financial support for the research, authorship, and/or publication of this article.