
Abstract
Keywords
Significance Statement
• Unlike APOE ε4, there was little evidence that diabetes was a risk factor for AD. • APOE ε4 allele primarily impacts LTM, while diabetes results in a decline in WM.
Introduction
Alzheimer’s Disease (AD) is the most common cause of dementia, yet vascular dementia, Lewy Body dementia, and frontotemporal dementia also account for many cases.1–3 Cognitive symptoms overlap between AD and other dementias, and AD can be definitively diagnosed only postmortem. 4 Thus, there is need for better early diagnosis of AD. Accurate assessment of risk factors will be key. One of the best characterized genetic risk factors for AD is the Apolipoprotein E (APOE) ε4 allele,5,6 one of three polymorphisms of the apolipoprotein E gene. 7 The apoE protein normally promotes clearance of triglyceride-rich lipoproteins, 8 but APOE ε4 is associated with increased very low-density lipoprotein levels. 9 Carriers of at least one ε4 allele have 2 to 3 times higher risk of being diagnosed with AD and are diagnosed 10–15 years earlier per allele as compared to non-carriers.10–12 In addition, APOE ε4 is associated with accelerated cognitive decline,13,14 and thus carriage may predict AD diagnosis at an early stage of the disease. 10
Diabetes has been proposed to be another risk factor for AD,15–17 and several recent studies have attempted to characterize the physiological relationship between diabetes and AD.18–20 Similar to APOE ε4, both Type I and Type II diabetes are associated with cognitive impairment.21–23 Further, previous studies have suggested that the combination of APOE ε4 and diabetes increases the risk of AD more than each factor alone.24,25 The pathophysiology underlying this possible interaction is not entirely known but may be linked to intersecting influences on amyloid processing and thus on AD. 26 Nevertheless, only a few studies with restricted demographic samples 25 have examined the hypothesized association between APOE ε4 and diabetes specifically with respect to AD diagnosis. Moreover, the general trend points to diabetes increasing the risk of AD diagnosis,27,28 but disagreement exists between past studies. Thus, an important unanswered question is the extent to which diabetes alone or in combination with APOE ε4 carriage predicts AD diagnosis.
The present study assessed the interaction between APOE ε4 and diabetes in the context of AD diagnosis by analyzing a large and diverse participant population. Key questions were whether presence of diabetes would correspond with increased odds of a diagnosis of AD and whether diabetes would exacerbate the relationship between APOE genotype and AD diagnosis. The results indicated that diabetes did not substantively increase the risk of being diagnosed with AD and did not exacerbate the risk associated with APOE ε4 allele carriage. Instead, the current results suggested that diabetes was a risk factor for a working memory impairment, which would complicate AD diagnosis and may be why previous studies have found a relationship between diabetes and AD. The present study also replicated previous associations between the APOE ε4 allele and AD diagnosis and extended those prior findings by identifying an association between the APOE ε4 allele and AD diagnosis above and beyond its association with cognitive impairment. In addition, the present study found that the cognitive impairment associated with the APOE ε4 allele was more related to long-term memory impairments, whereas the cognitive impairment associated with diabetes was more related to working memory impairments. This differing pattern of cognitive impairment will be useful for differentially diagnosing AD vs non-AD cognitive impairments.
Methods
Participants and Diagnosis of AD
A retrospective cohort study was conducted on participants from the NIA-funded National Alzheimer’s Coordinating Center (NACC) database, which included data (n = 33456) collected (longitudinally for many participants) from 2005 to 2016 at 29 Alzheimer’s Disease Centers (ADCs). Data collection and AD diagnoses have been previously described.29–31 Briefly, a standardized clinical evaluation that included neuropsychological tests was used to diagnose participants into three categories: AD, cognitive impairment without AD (e.g., MCI), and cognitively unimpaired. Data were also collected regarding health, cognition, and demographics. Participants included referred patients and community members. Informed consent was obtained.
Diabetes and APOE Genotype Measures
Diagnosis of diabetes was based on patient self-report and was split into three categories: Absent, Remote and/or Inactive, Recent and/or Active, with “remote” and “recent” referring to the time of diabetes diagnosis. No other confirmatory testing, including biomarkers or medication history, was available regarding diabetic status. The individuals who identified as Remote and/or Inactive were excluded, making diabetes a binary variable: no diabetes or diabetes. Information about whether diabetes was Type I or Type II was available for only 126 participants (109 Type II), due to the diabetes categorization question not being included in the general intake forms. APOE genotype was available for 24336 participants and was presented as 0, 1, or 2 APOE ε4 alleles in the NACC database. Of the 4204 who self-reported diabetes, 2803 (66.6%) had APOE genotype information.
Statistical Analyses
The following sections describe the statistical models used to assess the relationship between APOE genotype, diabetes, and AD diagnosis (see Supplementary Materials for full details of all models). Unless otherwise noted, the following self-report variables were included as predictors: gender, race, education, age, congestive heart failure, hypertension, hypercholesterolemia, thyroid disease, vitamin B12 deficiency, atrial fibrillation, heart attack/arrest, years of cigarettes smoking, and alcohol abuse (Supplementary Table 1 and Supplementary Table 2). All statistical analyses were performed using R software, version 3.4.1. Unless otherwise noted, confidence intervals (CI) indicate 95% confidence intervals.
Multinomial Logistic Regression Models
Risk of AD diagnosis and cognitive impairment was estimated first using multinomial logistic regression models, an extension of binary logistic regression used when the dependent variable has more than two levels (e.g., three diagnostic outcomes as in the present study). 32 Multinomial logistic regression requires that one category of the dependent variable be chosen as the reference level, which in our study was a diagnosis of being cognitively unimpaired. Thus, odds ratios (ORs) reported here for independent variables quantify risk of AD diagnosis vs no cognitive impairment. Missing data were imputed using multiple imputation by chained equations. 33 The first multinomial logistic model (Model 1) was based on the diagnosis made at a participant’s first ADC visit. The second model (Model 2) was the same as Model 1 except that it used the diagnosis made on a participant’s last visit, which was presumably the most accurate indicator of a person’s likelihood of eventual AD diagnosis. A third model (Model 4; numbered according to order in Results) dropped all predictors as well as APOE genotype from Model 2 to assess the influence of these variables on the estimated association between diabetes and AD risk. A fourth model (Model 5) added APOE genotype to Model 4 to quantify the risk of AD associated with diabetes and APOE ε4 without predictors.
Mixed Effects Model
To be able to include data from all visits rather than a single visit (as was possible with the multinomial logistic regression models), a mixed effects model (Model 3) was used to assess the risk of being diagnosed with AD at any visit. Specifically, using a subject-specific random effect, the mixed effects model took into account within-subject correlation between visits. AD diagnosis was binarized as yes or no after excluding participants diagnosed with cognitive impairment without AD. ORs were obtained similarly to the approach used in the multinomial logistic models.
Structural Equation Modeling
SEM combines regression and factor analysis to estimate the causal relationships among constructs.34–36 SEM was used with longitudinal data in the present study to model how the factors of working memory (WM), verbal fluency (VF), and long-term memory (LTM), as well as decline in all three (WMD, VFD, and LTMD, respectively), mediated the influence of APOE genotype and diabetes on conversion to AD diagnosis in individuals not diagnosed with AD on their first visit (Supplementary Table 3 and Supplementary Figure 1). SEM involves a collection of models, but the specific analysis reported here is referred to as Model 6 for clarity.
Results
Participant Inclusion and Demographics
Demographic Information and Neuropsychological Measures (n = 24,108).
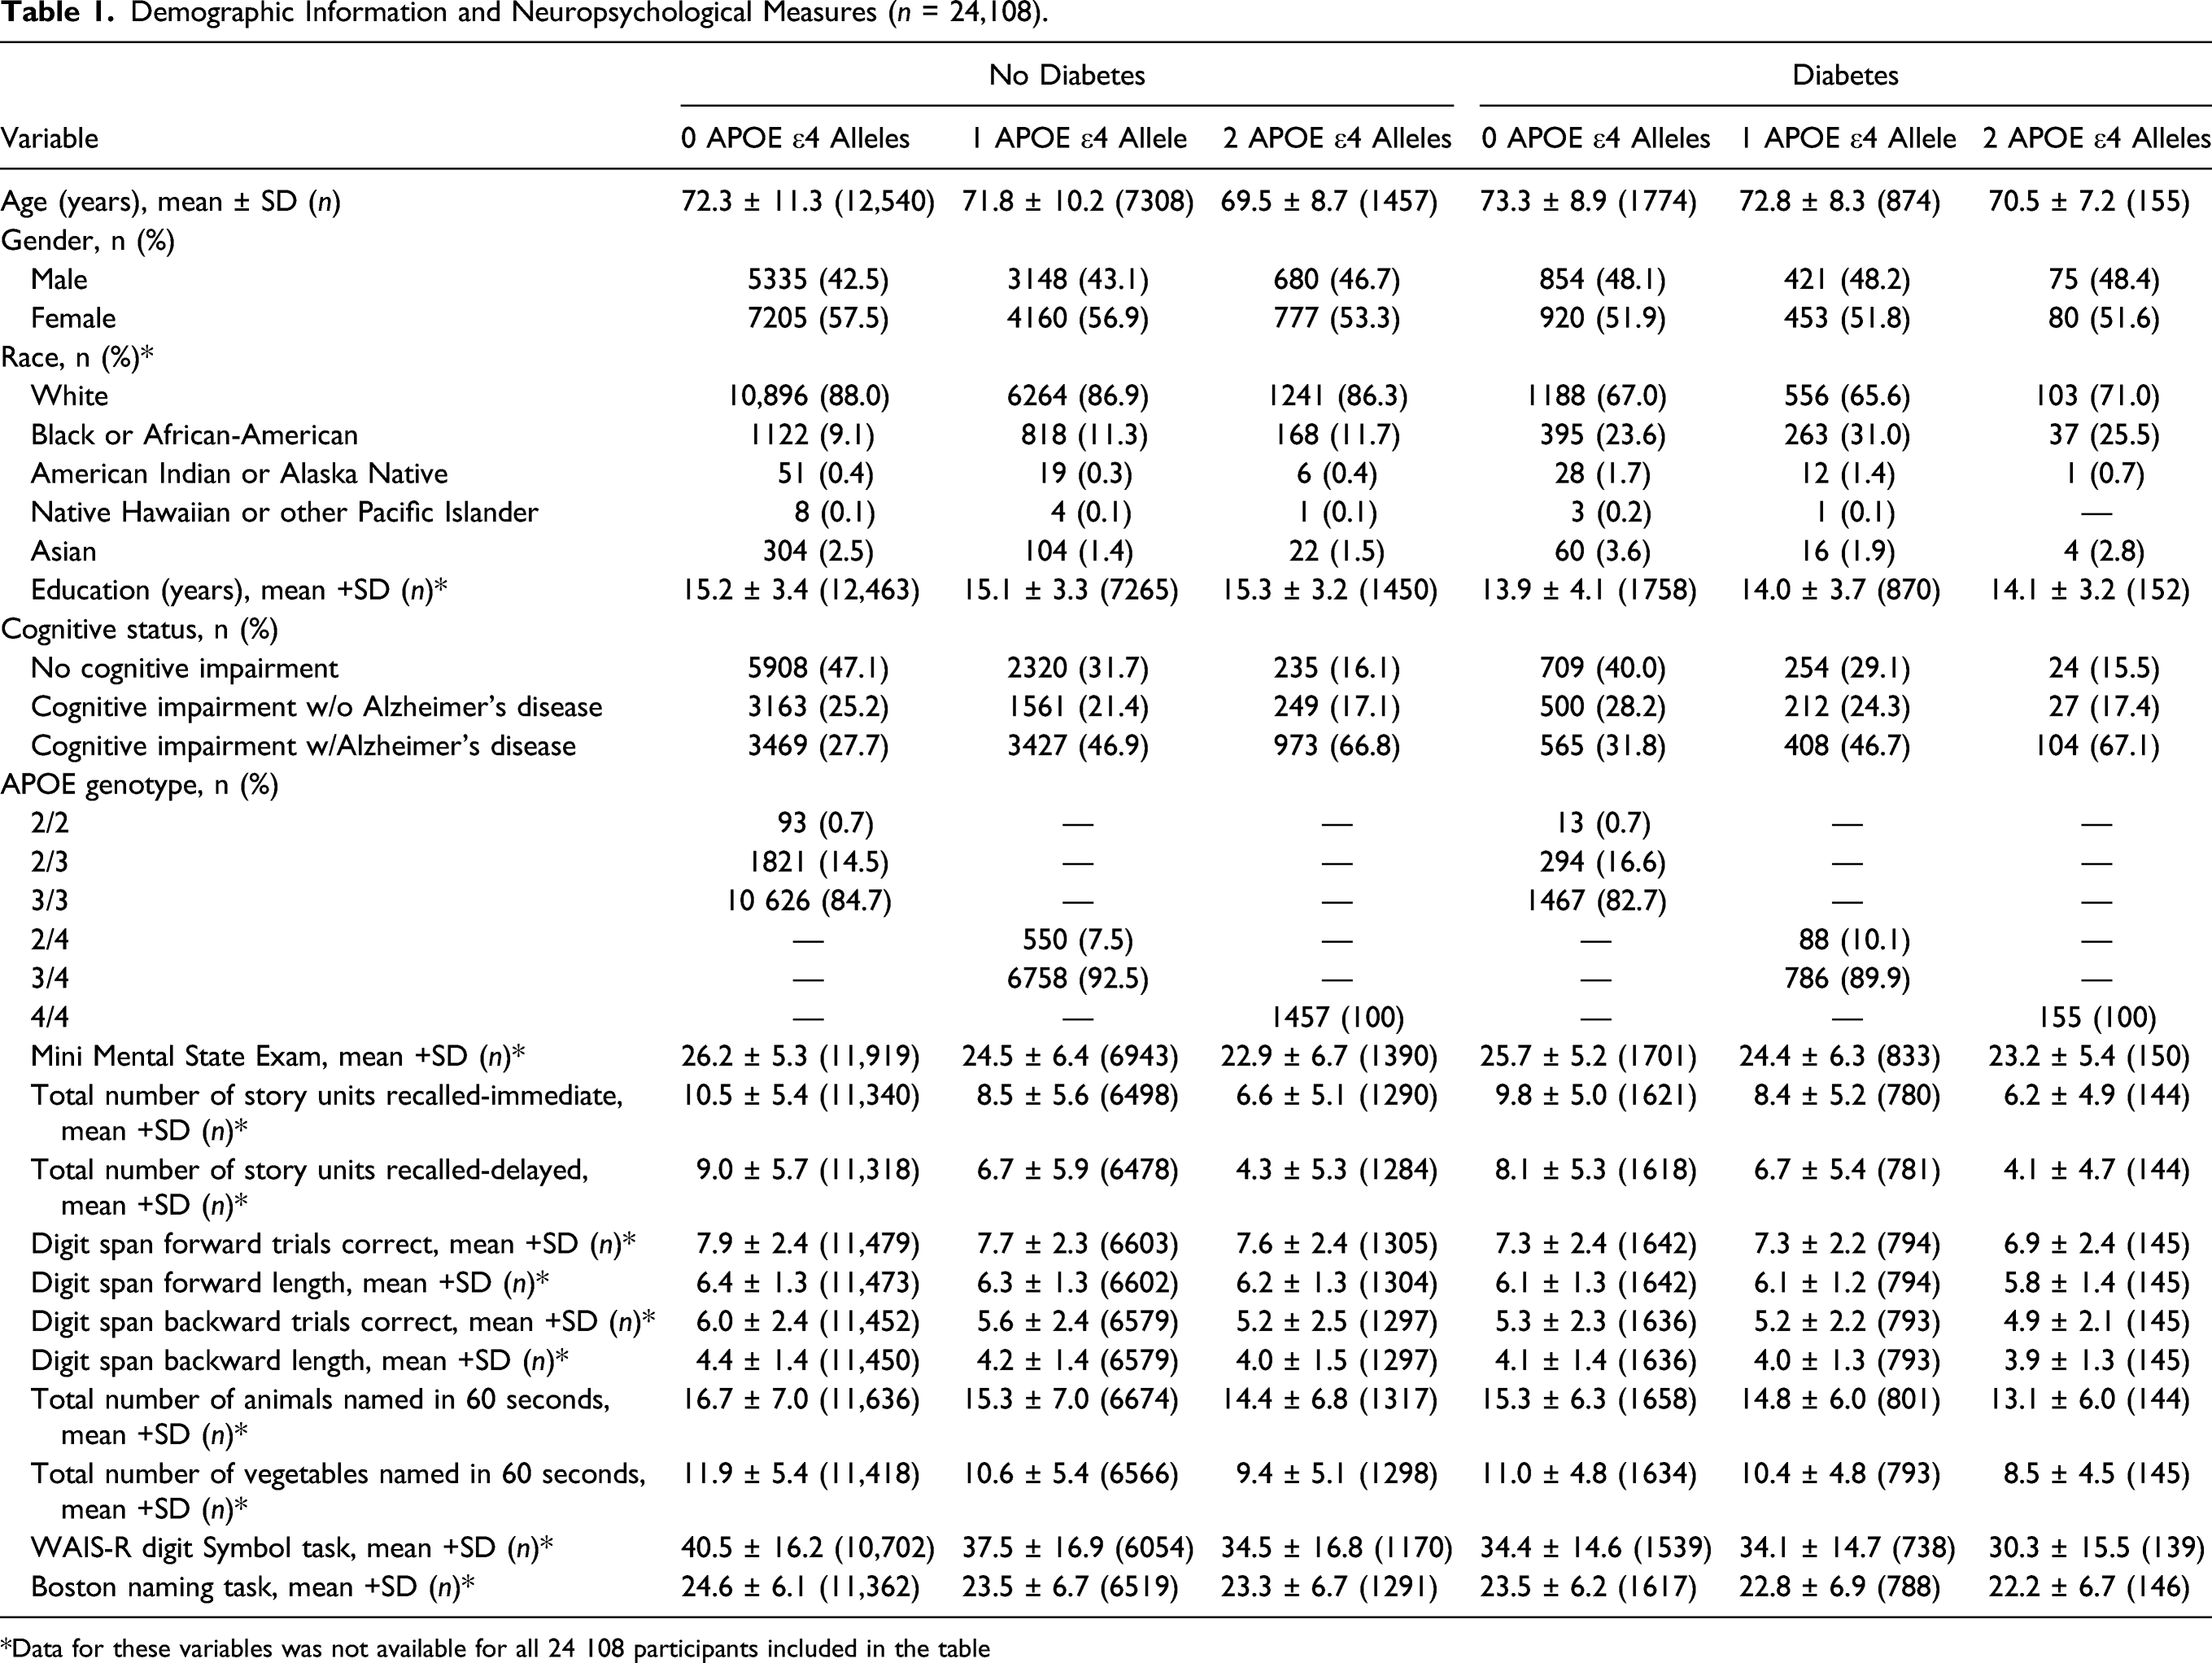
*Data for these variables was not available for all 24 108 participants included in the table
Diabetes, APOE ε4, and Likelihood of AD Diagnosis
Risk Of Cognitive Impairment Associated With Diabetes and APOE ε4; OR (95% CI).

Odds ratios are presented as 1 APOE ε4 vs. 0 APOE ε4, 2 APOE ε4 vs. 0 APOE ε4, diabetes vs. no diabetes, diabetes/1 APOE ε4 vs. no diabetes/1 APOE ε4, and diabetes/2 APOE ε4 vs. no diabetes/2 APOE ε4. All models were adjusted for gender, race, education, age, congestive heart failure, hypertension, hypercholesterolemia, thyroid disease, vitamin B12 deficiency, atrial fibrillation, heart attack/cardiac arrest, years smoked cigarettes, and alcohol abuse.
One consideration for the above analysis is that some participants who were not diagnosed with AD during their first ADC visit were later diagnosed with AD on return visits. Accordingly, the above analysis was repeated with the AD diagnosis from each participant’s final visit (Model 2). The results are shown in Figure 1 and Table 2, which contrast again the strong relationship between APOE genotype and AD diagnosis as compared to the weak relationship between diabetes and AD diagnosis. As compared to participants with zero APOE ε4 alleles, participants with one or two APOE ε4 alleles had 2.71 (CI: 2.55–2.88) and 9.37 (CI: 8.14–10.78) times higher odds of being diagnosed with AD, respectively. In contrast, participants with diabetes showed only 1.07 times higher odds of being diagnosed with AD, a value that did not differ significantly from 1.0 (CI: 0.96 to 1.18). Furthermore, participants with diabetes and one or two APOE ε4 alleles had, respectively, 0.98 (CI: 0.82–1.16) and 0.73 (CI: 0.48–1.09) times the odds of being diagnosed with AD as compared to participants with no diabetes and the same number of APOE ε4 alleles. Odds Ratios for final Alzheimer's disease diagnosis from the imputed multinomial logistic regression model. (Model 2). From left to right, odds ratios are presented as 1 APOE ε4 allele vs. 0 APOE ε4 alleles (OR, 2.71; 95% CI, 2.55–2.88), 2 APOE ε4 alleles vs. 0 APOE ε4 alleles (OR, 9.37; 95% CI, 8.14–10.78), diabetes vs. no diabetes (OR, 1.07; 95% CI, 0.96–1.18), diabetes vs. no diabetes given that an individual has 1 APOE ε4 allele (OR, 0.98; 95% CI, 0.82–1.16), and diabetes vs. no diabetes given that an individual has 2 APOE ε4 alleles (OR, 0.73; 95% CI, 0.48–1.09). Odds ratios are plotted on a log scale. Error bars represent 95% CI’s.
To capitalize more fully on the longitudinal data set, a generalized linear mixed effects analysis (Model 3) was conducted to permit inclusion of all data across repeat visits for participants who revisited ADCs (n = 17,994). The results, shown in Table 2, were similar to those obtained with the multinomial logistic regression models. Specifically, as compared to participants with zero APOE ε4 alleles, participants with one or two APOE ε4 alleles had 2.81 (CI: 2.69–2.94) and 9.85 (CI: 8.94–10.86) times higher odds of being diagnosed with AD, respectively. In contrast, participants with vs without diabetes showed only 1.13 (CI: 1.04–1.23) times higher odds of being diagnosed with AD. Further, participants with diabetes and one or two APOE ε4 alleles had, respectively, 0.75 (CI: 0.65–0.86) and 0.70 (CI: 0.50–0.96) times the odds of being diagnosed with AD as compared to participants with no diabetes and the same number of APOE ε4 alleles, values that were statistically significantly lower than 1.0.
The ORs reported here for an AD diagnosis for diabetics vs non-diabetics were lower than those previously reported using relatively few predictors (ORs ranging from 1.07 to 1.14 here vs 1.53 and 1.65 in Zhang et al. 2017 28 and Arvanitakis et al. 2004, 16 respectively). Accordingly, multinomial logistic regression analysis based on AD diagnosis at a participant’s last visit was conducted with diabetic status as the sole independent variable (Model 4) and with only diabetic status and APOE genotype as independent variables (Model 5). The results are shown in Table 2, which indicated that dropping predictors led to increased diabetes ORs for AD diagnosis (Model 4 OR = 1.18, CI: 1.09–1.27; Model 5 OR = 1.32, CI: 1.20–1.46), offering partial explanation for past results with fewer predictors.
Another consideration for the present study was that status of diabetes was based on self-report and did not distinguish between Type I and Type II diabetes, which constitute approximately 5.6% and 91.2% (3.3% and 94.9% for ≥65 years of age), respectively, of individuals with diabetes in the US.
38
Therefore, a simulation was conducted by running Model 21,000 times, each time excluding a randomly selected (with replacement) 5% of individuals with diabetes. The rationale was that the distribution of these resulting 1000 ORs for AD diagnoses for diabetics vs non-diabetics would reflect the range of possible ORs if the analyses were conducted with only diabetics diagnosed with Type II diabetes. The mean odds ratio of this subsampled distribution was 1.09, with a minimum of 1.05 and a maximum of 1.13 (Figure 2). Thus, restricting the analyses to include only diabetic individuals with Type II diabetes would likely not have substantially altered the present findings. Sensitivity Analysis; Histogram of simulated risk for Alzheimer's disease (AD) due to diabetes. The multinomial logistic regression analyses based on a participant’s AD diagnosis at last visit (Model 2) was repeated. 1000 times, each time following a removal of a random 5% (with replacement) of the individuals with diabetes (5% based on national averages of adults with diabetes who are diagnosed with Type I diabetes). The mean odds ratio of this subsampled distribution was 1.09, with a minimum of 1.05 and a maximum of 1.13.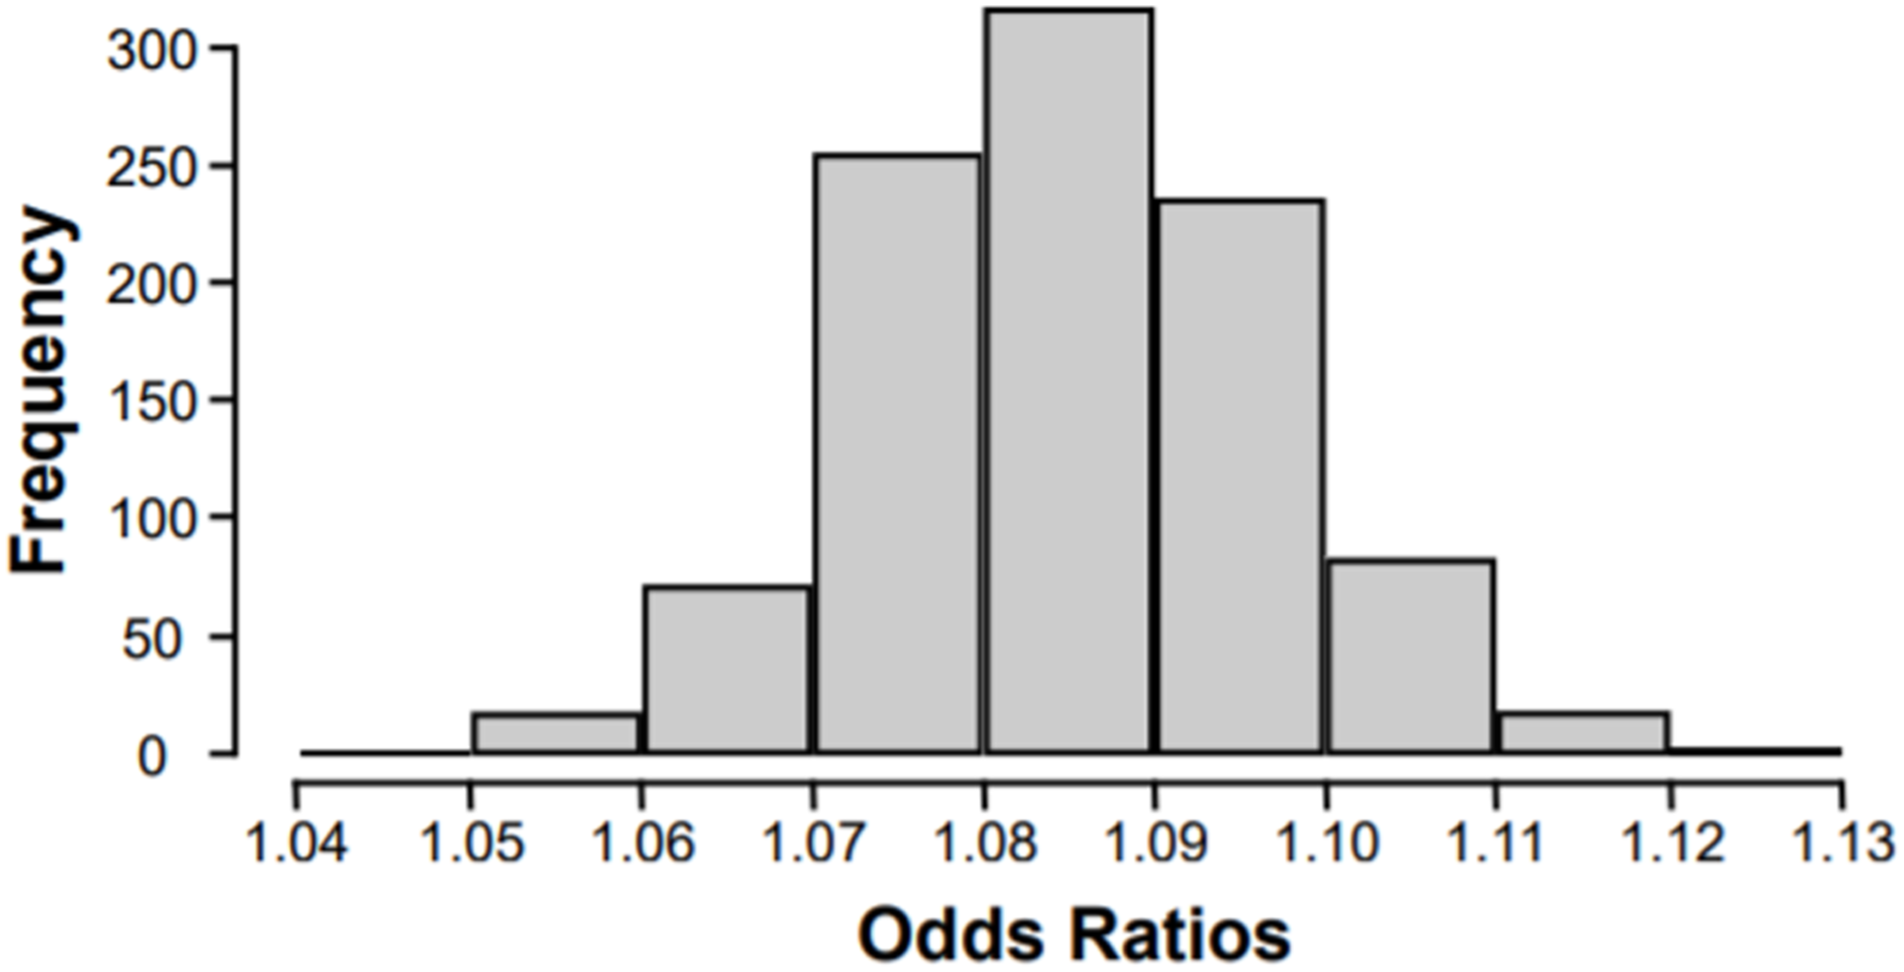
Cognitive Decline as a Mediator of Diabetes, APOE ε4, and AD Diagnosis
The final analysis was a SEM (Model 6) that used cognitive performance along with diabetic status and APOE genotype to distinguish which initially non-AD participants would eventually be diagnosed with AD. Cognitive performance was split into factors of long-term memory (LTM), verbal fluency (VF), and working memory (WM) as well as declines in these scores (LTMD, VFD, and WMD, respectively).
39
Initial cognitive scores and cognitive decline represented mediator variables between diabetic status and APOE genotype and the dependent variable of eventual AD diagnosis. Figure 3 shows statistically significant path weights for the SEM and indicates that there were significant direct associations between APOE genotype and AD diagnosis as well as significant indirect associations mediated by initial LTM scores and LTM and VF decline. In contrast, diabetes was associated with lower WM scores as well as decline in WM and VF scores but was not directly associated with eventual AD diagnosis. All cognitive measures were significantly related to AD diagnosis, but those uniquely related to APOE genotype (LTM and LTM decline) were more strongly correlated with AD diagnosis than those uniquely related to diabetic status (WM and WM decline). Of note, the only statistically significant interactive effect of diabetes and APOE ε4 was on VF decline, consistent with past reports that verbal fluency declines in both AD-related and AD-unrelated dementias.
40
Structural equation model of APOE ε4 alleles or diabetes influencing eventual conversion to AD via initial impairments in LTM, VF, or WM as well as declines in all three (LTMD, VFD, and WMD, respectively). The presence of one or two APOE ε4 alleles, but not diabetes, predicted conversion to AD. Presence of APOE ε4 alleles primarily impaired long-term memory, whereas diabetes primarily impaired working memory. LTM and LTMD were stronger predictors than WM or WMD for conversion to AD. Solid lines represent significant effects (p < .05). Arrowheads show the directionality of each relationship. Path weights are based on the standardized beta coefficients for each edge. Additional predictors including gender, race, education, age, congestive heart failure, hypertension, hypercholesterolemia, thyroid disease, vitamin B12 deficiency, atrial fibrillation, heart attack/cardiac arrest, years smoked cigarettes, and alcohol abuse were included in the model, but omitted in this diagram.
Discussion
Analyses of a large, longitudinal, and demographically diverse participant sample revealed that APOE ε4 genotype was strongly associated with AD diagnosis but that diabetes was, at most, very weakly associated with AD diagnosis. The finding that APOE ε4 is associated with AD diagnosis is consistent with previous studies,5,12,41 thus providing evidence that the current data set and analytic approach was capable of identifying a robust association when one existed. For example, even though only 1626 out of 24,336 individuals with genotype information had two APOE ε4 alleles, the main analyses (Models 1–3) identified a strong association between two ε4 alleles and AD diagnosis (odd ratios relative to zero ε4 alleles ranged from 8.81 to 9.85). In comparison, for the 4204 diabetics out of 33,091 participants with diabetes status information, the odds ratios for AD risk relative to non-diabetics ranged from 1.07 to 1.14, some of which were not significantly different from 1.0 and all of which were very close to 1.0. Thus, in light of the findings for APOE ε4 genotype, the weak-to-no association between diabetes and AD is not attributable simply to statistical power or analytic approach.
The lack of a reliable association between diabetes and AD diagnosis reported here differs from several previous studies.15,21 A previous meta-analysis concluded that diabetes is a risk factor for AD but also noted that ten of sixteen studies reviewed did not identify a significant association. 15 A possible explanation for the inconsistency of these past results, supported by analyses reported here, is that omission of important predictors, especially in a smaller dataset, could lead to spurious associations between diabetes and AD by failing to account for demographic or health-related risk factors common to both diseases. 42 Sample sizes in similar studies ranged from 826 to 2574 vs 33,456 participants in the current study, and one study that concluded that Type II diabetes modifies the relationship between APOE ε4 and dementia enrolled only Japanese-American men. 25 Another possibility raised by the current results is that diabetes correlates particularly with WM impairments, which could lead to misdiagnosis if not distinguished from the LTM impairments that were better indicators of early AD. Taken together, the current results thus extend past AD research on APOE ε4 (e.g., showing an allele number-dependent association in a large sample) but also offer clarity regarding the exclusion of diabetic status as a major risk factor for AD.
A recent study that investigated possible interactions between diabetes and APOE genotype found that diabetes was associated with cognitive decline for APOE ε2 and ε3 carriers but not for ε4 carriers. 23 In comparison, in the present study, the association between diabetes and AD diagnosis was weak and non-significant, even when limited to carriers of only ε2 and ε3 alleles (Model 2; OR = 1.12; CI: 0.90–1.36). The different findings can possibly be explained by noting that the prior study (Shinohara et al., 2020) used a general measurement of dementia (Clinical Dementia Rating), whereas the current study used AD diagnosis specifically as the primary outcome variable. These differences further highlight the importance of using domain-specific profiles of cognitive impairment to help distinguish AD-related cognitive decline from AD-unrelated cognitive decline.
The added clarity is important because multiple credible hypotheses have been offered recently regarding the pathophysiological link between AD and Type II diabetes.18,19 Potential overlapping mechanisms include increased oxidative stress, inflammation, and insulin resistance. 19 For example, insulin resistance coupled with relative insulin deficiency has been proposed to lead to accumulation of β-amyloid (Aβ) in addition to diabetes. 43 Nevertheless, the current results suggest that any pathophysiological link is not straightforward. Indeed, some of the analyses reported here (Model 3) indicated that the presence of diabetes in APOE ε4 carriers actually decreased the risk of AD diagnosis. Explanations for these apparent neuroprotective effects remain speculative, particularly as the numbers of self-reported diabetics with two APOE ε4 alleles was relatively low. Nevertheless, whereas both diabetes and APOE ε4 lead to insulin resistance at the GLUT4 receptor and subsequently increased Aβ production, there is evidence that APOE ε4 disproportionately activates neurotoxic pathways that insulin is not involved in to precipitate AD pathology. 44 In addition, the detrimental effects of insulin resistance at the GLUT4 receptor in Type II diabetes may be offset by insulin sensitivity at the GLUT1 and GLUT3 receptors, which are highly expressed in the brain. 45 In any case, the current results suggest that the pathophysiological mechanisms by which diabetes impacts the brain are not the same as those in AD. In support of the differing effects on the brain, the current results indicated that APOE genotype was associated with impairments in LTM, a hallmark of early AD, whereas diabetes was associated with impaired WM, a feature of vascular dementia rather than AD. 46 In contrast, both diabetes and APOE genotype were associated with verbal fluency decline, which is consistent with prior reports that declines in verbal fluency are associated with both AD-related and AD-unrelated dementias. 40 Further research will be needed to fully understand the etiology of this common cognitive impairment.
In this study, with a larger dataset, more expansive co-variates, and structural equation modeling as never used before to answer this specific question, we contrasted the relative AD risk between APOE ε4 genotype and diabetic status. The results indicated that that APOE ε4, like others have reported before, is strongly associated with AD risk, whereas diabetic status is not, which adds important evidence to the contentious question about the relative risk for AD diagnosis diabetics face as compared to non-diabetics. In fact, several of the analyses in this study served to clarify why past studies have found an association between diabetes and AD, and subsequently point out how this study, with the inclusion of common risk factors for both AD and diabetes (e.g., hypertension) avoids the pitfalls that have led to spurious associations between diabetes and AD. The structural equation model, in particular, enabled the parceling out of the overlapping profiles of cognitive impairment that can complicate physicians’ diagnoses. A novel finding was that diabetes was shown to predict a very specific type of cognitive decline, but not AD, whereas APOE genotype is shown to predict AD even after accounting for cognitive decline. In fact, the SEM potentially allows clinicians to focus on working memory when faced with diabetics with cognitive decline, a domain of cognition that seemed to be disproportionately impacted by diabetes relative to AD. Highlighting the differing profiles of cognitive decline will aid clinicians when diagnosing AD vs other types of dementia.
Even while providing potentially valuable data for clinical decision making, this study is not without limitations. Most stem from the challenges of working with a previously collected retrospective dataset. The self-report nature of the diabetes diagnosis, unconfirmed with clinical testing, limits the conclusions that can be drawn, particularly since we report a weak-to-no association between diabetes and AD diagnosis, which is essentially a null result. In addition, the relatively few individuals who had two APOE ε4 alleles and diabetes may preclude the ability to draw strong conclusions about putative interactions between those factors. For example, one possible explanation is that diabetes reduced the odds of AD diagnosis in ε4 allele carriers, thus resulting in few individuals with diabetes, ε4 allele(s), and AD. However, an alternate possibility is that these significant results are a type I error and that the database did not offer a large enough sample size to make definitive statements about any possible protective effects of diabetes with respect to APOE ε4 genotype and AD diagnosis.
In conclusion, the results suggest that, unlike APOE ε4, diabetes is not a major risk factor for AD. The finding that APOE ε4 correlates with impairment of LTM to increase odds of AD diagnosis provides clinicians with additional insight to make the most accurate diagnosis possible. Moreover, eliminating diabetes as a risk factor for AD is just as informative, and associating diabetes with WM rather than LTM impairments will potentially aid the tricky distinction between, for example, vascular dementia and AD. Our findings also provide clues into the pathological mechanisms of AD and inform future study designs that may investigate APOE ε4, diabetes, and cognition. In particular, future work incorporating more physiological biomarkers such as serum insulin, HbA1c, and CSF β-amyloid levels could further clarify the distinctions between the pathophysiology of diabetes and AD.
Supplemental Material
sj-pdf-1-aja-10.1177_15333175211070912 – Supplemental Material for Reassessing Diabetes and APOE Genotype as Potential Interacting Risk Factors for Alzheimer’s Disease
Supplemental Material, sj-pdf-1-aja-10.1177_15333175211070912 for Reassessing Diabetes and APOE Genotype as Potential Interacting Risk Factors for Alzheimer’s Disease by Kaushik Ravipati, Yunxiao Chen and Joseph R. Manns in American Journal of Alzheimer's Disease & Other Dementias®
Footnotes
Author Contributions
Ravipati had full access to all of the data in the study and takes responsibility for the integrity of the data and the accuracy of the data analysis. Concept and Design: All authors. Acquisition, analysis, or interpretation of data: All authors. Drafting of the manuscript: All authors. Critical Revision of the manuscript: All authors. Statistical Analysis: Ravipati and Chen. Supervision: Manns.
Declaration of Conflicting Interests
The author(s) declared no potential conflicts of interest with respect to the research, authorship, and/or publication of this article.
Funding
The author(s) disclosed receipt of the following financial support for the research, authorship, and/or publication of this article: This work was supported by the Emory University College of Arts and Sciences.
Data Availability
The NACC database is funded by NIA/NIH Grant U01 AG016976. NACC data are contributed by the NIA-funded ADCs: P30 AG019610 (PI Eric Reiman, MD), P30 AG013846 (PI Neil Kowall, MD), P30 AG062428-01 (PI James Leverenz, MD) P50 AG008702 (PI Scott Small, MD), P50 AG025688 (PI Allan Levey, MD, PhD), P50 AG047266 (PI Todd Golde, MD, PhD), P30 AG010133 (PI Andrew Saykin, PsyD), P50 AG005146 (PI Marilyn Albert, PhD), P30 AG062421-01 (PI Bradley Hyman, MD, PhD), P30 AG062422-01 (PI Ronald Petersen, MD, PhD), P50 AG005138 (PI Mary Sano, PhD), P30 AG008051 (PI Thomas Wisniewski, MD), P30 AG013854 (PI Robert Vassar, PhD), P30 AG008017 (PI Jeffrey Kaye, MD), P30 AG010161 (PI David Bennett, MD), P50 AG047366 (PI Victor Henderson, MD, MS), P30 AG010129 (PI Charles DeCarli, MD), P50 AG016573 (PI Frank LaFerla, PhD), P30 AG062429-01(PI James Brewer, MD, PhD), P50 AG023501 (PI Bruce Miller, MD), P30 AG035982 (PI Russell Swerdlow, MD), P30 AG028383 (PI Linda Van Eldik, PhD), P30 AG053760 (PI Henry Paulson, MD, PhD), P30 AG010124 (PI John Trojanowski, MD, PhD), P50 AG005133 (PI Oscar Lopez, MD), P50 AG005142 (PI Helena Chui, MD), P30 AG012300 (PI Roger Rosenberg, MD), P30 AG049638 (PI Suzanne Craft, PhD), P50 AG005136 (PI Thomas Grabowski, MD), P30 AG062715-01 (PI Sanjay Asthana, MD, FRCP), P50 AG005681 (PI John Morris, MD), P50 AG047270 (PI Stephen Strittmatter, MD, PhD). Role of the Data Provider: The data providers had no role in design and conduct of the study, collection, management, analysis, and interpretation of the data; and preparation, review, or approval of the manuscript or the decision to submit for publication.
References
Supplementary Material
Please find the following supplemental material available below.
For Open Access articles published under a Creative Commons License, all supplemental material carries the same license as the article it is associated with.
For non-Open Access articles published, all supplemental material carries a non-exclusive license, and permission requests for re-use of supplemental material or any part of supplemental material shall be sent directly to the copyright owner as specified in the copyright notice associated with the article.