
Abstract
This paper was aimed to analyze the microRNA (miRNA) signatures in Alzheimer disease (AD) and find the significant expressions of miRNAs, their target genes, the functional enrichment analysis of the confirmed genes, and potential drug treatment. The miRNA expression information of the gene expression profile data was downloaded from the Gene Expression Omnibus database. The total data sample size is 1309, including 1021 AD samples and 288 normal samples. A total of 21 differentially expressed miRNAs were obtained, of which 16 (hsa-miR-6761-3p, hsa-miR-6747-3p, hsa-miR-6875-3p, hsa-miR-6754-3p, hsa-miR-6736-3p, hsa-miR-6762-3p, hsa-miR-6787-3p, hsa-miR-208a-5p, hsa-miR-6740-3p, hsa-miR-6778-3p, hsa-miR-595, hsa-miR-6753-3p, hsa-miR-4747-3p, hsa-miR-3646, hsa-miR-6716-3p and hsa-miR-4435) were up-regulated and 5 (hsa-miR-125a-3p, hsa-miR-22-3p, hsa-miR-24-3p, hsa-miR-6131 and hsa-miR-125b-1-3p) were down-regulated in AD. A total of 6 miRNAs (hsa-miR-595, hsa-miR-3646, hsa-miR-4435 hsa-miR-125a-3p, hsa-miR-22-3p and hsa-miR-24-3p) and 78 miRNA-disease-related gene sub-networks were predicted, and 116 ceRNA regulatory relationship pairs, and the ceRNA regulatory network were obtained. The results of enrichment analysis suggested that the main target pathways of several miRNAs differentially expressed in AD were mitogen-activated protein kinase signal pathway. According to the prediction results of Drug-Gene Interaction database 2.0, we obtained 53 pairs of drug-gene interaction, including 7 genes (PTGS2, EGFR, CALM1, PDE4D, FGFR2, HMGCR, cdk6) and 53 drugs. We hope our results are helpful to find a viable way to prevent, delay the onset, diagnose, and treat AD.
Introduction
Dementia is a common neurodegenerative disease in the elderly, accompanied by progressive mental decline and personality changes. Alzheimer’s disease (AD), the most common form of dementia, influenced more than 50 million people worldwide. 1 It robs people of their independence, becomes the fifth leading cause of death, and will bring huge social burden. Hence, it would be important to identify early screening and potential therapeutic targets for AD.
At present, the diagnosis of AD mainly depends on neuropsychological evaluation, cerebrospinal fluid or PET imaging to determine the pathological markers amyloid beta or tau protein. 2 But these methods have their limitations. Neuropsychological evaluation may be influenced subjectively. As an invasive operation, cerebrospinal fluid sampling lacks convenience and is not easily accepted by patients. PET imaging is expensive and difficult to be popularized due to objective conditions. In addition, to date, there are no effective drugs to reverse the pathological process of AD. Therefore, there is an urgent need for a simpler, lower-cost and specific test method. It also hopes that effective drugs for AD could appear early.
In recent years, microRNA (miRNA) is expected to become a new biological marker for disease diagnosis. 3 As we all known, miRNA is a kind of non-coding single-stranded RNA molecule with a length of about 21-24 nucleotides encoded by endogenous genes, which plays an important role in the post-transcriptional regulation of gene expression in eukaryotes. 4 Recently, many studies have reported the feasibility of miRNAs in blood, 5 -8 cerebrospinal fluid, 9,10 or brain tissue 11 -13 as AD biomarkers. And miRNAs were proved to function in the regulation of amyloid β (Aβ) metabolism 14 -17 and Tau expression and function. 18,19 Especially, the collection of blood samples has been fully popularized, and blood-based marker determination will be an ideal choice. 20 Hence, many groups have explored the association between serum miRNAs and AD.
In the present study, we conducted a bioinformatics analysis to analyze miRNAs in AD via using the miRNAs expression profile data set of AD obtained from a Gene Expression Omnibus (GEO) Dataset. Moreover, the functional enrichment analyses, transcriptional regulatory (TF) analysis, a predictive analysis of drug–gene interactions in AD were also carried out to in our study. We hope our study may bring a promising target to prevent, delay the onset, diagnose, and treat AD.
Methods
Data Acquisition
The data in our study were obtained from Gene expression profile data (GSE120584) 21,22 which contains 1309 serum samples (1021 AD samples and 288 normal samples). The expressions of miRNAs were retrieved from the National Center for Biotechnology Information GEO repository (www.ncbi.nlm.nih.gov/geo). The AD subjects were diagnosed as a probable or possible AD according to the criteria of the National Institute on Aging Alzheimer’s Association workgroups. 23 The included AD subjects in this study were all the probable ADs.
Data Preprocessing and Differential miRNA Screening
After downloading the data, all data needed to be preprocessed. First we calculate mean and standard deviation (SD) using a set of pre-selected negative control signals (background signals) that the top and bottom 5% of which were removed. Then we replace signal values greater than mean+2SD of the background signals using log2 (signal–mean) and labeled effective signals. Next, we replace the remaining signal values by the minimum of the effective signals–0.1. We also replace undetected signal values by the average signal of each miRNA signals. In addition, a set of pre-selected internal control miRNAs (miR-149-3p, miR-2861 and miR-4463) which had been stably detected in more than 500 serum samples were used to normalize the signals across different microarrays.
The limma R package (version 3.10.3, http://www.bioconductor.org/packages/2.9/bioc/html/limma.html) was used to analyze the differential expression of samples by the classic Bayesian method. The miRNAs with P Value < 0.05 and | logFC | > 0.379 (FC >1.3) after Benjamini&Hochberg (BH) correction were regarded as differentially expressed miRNAs. 24
Prediction of Differentially Expressed miRNA Target Genes
We predict target gene via inputting differential miRNAs in miRWalk 2.0(http://zmf.umm.uni-heidelberg.de/apps/zmf/mirwalk2/miRretsys-self.html) and adding 5 databases (miRWalk, Microt4, miRanda, miRMap and Targetscan). 25 Then we got a list of predicted miRNA-target regulation relation pairs. Finally we selected regulation relation pairs which exist in all the 5 databases to construct a miRNA regulation network.
Functional Enrichment Analyses of Differentially Expressed miRNA Target Genes
Using the predicted target genes which regulated by miRNAs as the background, the clusterProfiler package 26 (Version 3.2.11, Http://www.bioconductor.org/packages/release/bioc/html/clusterprofiler.html) was used to analyze the Kyoto Encyclopedia of Genes and Genomes (KEGG) pathway enrichment analysis 27 and Gene Ontology (GO) biological process (BP) enrichment analysis. 28 The threshold value about significant result was set as adjuctive P Value < 0.05, count ≥5 after BH correction. The related functions of the target miRNAs were screened out from the results of KEGG pathway and GO BP enrichment. Then these genes were obtained as the key genes for subsequent analysis.
Analysis of Genes Which Were Directly Related to Diseases
In order to obtain disease-related genes, we used “Alzheimer Disease” as a keyword in the Comparative Toxicogenomics Database (http://ctd.mdibl.org/). 29 When inference score was more than 15, the genes would be chosen to compare with the key genes in the previous analysis to obtain disease-related genes.
Analysis of miRNA-TF Regulatory Complex Network
We used Web Gestalt (http://www.webgestalt.org/) 30 to carry out TF-target enrichment prediction on disease-related genes by using the over representation Enrichment Analysis enrichment method.
The disease-related genes were contained in the predicted TF-target gene regulation network, so that a miRNA-disease-related gene sub-network was obtained. The predicted TF-target gene regulation network and the miRNA-disease-related gene sub-network were integrated. Then a miRNA-TF-disease-related gene complex network was constructed. The network was constructed using Cytoscape software (http://www.cytoscape.org/). 31
miRNA-Long Non-Coding RNA (lncRNA) Network Construction
We used DIANA-LncBase v.2 database 32 (http://carolina.imis.athena-innovation.gr/Diana-tools/web/index.php?R=lncbasev2%2Findex) Prediction Module to predict the lncRNA which linked to miRNA-disease-related gene sub-network, and screen lncRNA-miRNA with a score equal to 1. Then we integrated the information between lncRNA regulating miRNA and miRNA regulating disease-related gene, so that a lncRNA-miRNA-target gene was constructed.
Prediction and Analysis of Small Molecules of Drugs
We used Drug-Gene Interaction database 2.0 (DGIdb2.0) 33 (http://www.dgidb.org/) to predict disease-related genes. Parameter setting drug database was limited to Drug Bank and FDA. All drug-gene relationship pairs were predicted to construct drug-gene network diagram. DGIdb was used to dig existing resources, and produce assumptions about how genes were targeted in therapy or used preferentially in drug development.
Results
Identification of Differentially Expressed miRNAs
According to the screening criteria, a total of 21 differentially expressed miRNAs were obtained, of which 16 miRNAs (hsa-miR-6761-3p, hsa-miR-6747-3p, hsa-miR-6875-3p, hsa-miR-6754-3p, hsa-miR-6736-3p, hsa-miR-6762-3p, hsa-miR-6787-3p, hsa-miR-208a-5p, hsa-miR-6740-3p, hsa-miR-6778-3p, hsa-miR-595, hsa-miR-6753-3p, hsa-miR-4747-3p, hsa-miR-3646, hsa-miR-6716-3p and hsa-miR-4435) were up-regulated and 5 miRNAs (hsa-miR-125a-3p, hsa-miR-22-3p, hsa-miR-24-3p, hsa-miR-6131 and hsa-miR-125b-1-3p) were down-regulated in AD (Table 1). The results were also shown in the volcano map Figure 1.

The volcanic map of identification of significantly expressed miRNA. The red dots represent significantly up-regulated miRNAs and the green dots represent significantly down-regulated miRNAs.
The Differentially Expressed miRNAs Genes Between AD and Normal Samples.

Enrichment Results of miRNA
Figure 2A shows the 132 KEGG results of up-regulated miRNAs (hsa-miR-3646, hsa-miR-4435 and hsa-miR-595). Figure 2B shows the 65 KEGG results of down-regulated miRNAs (hsa-miR-125a-3p, hsa-miR-125b-1-3p and hsa-miR-22-3p). Figure 3A reveals 575 BP results of up-regulated miRNAs (hsa-miR-3646, hsa-miR-4435 and hsa-miR-595). Figure 3B reveals 515 BP results of down-regulated miRNAs (hsa-miR-125a-3p, hsa-miR-22-3p and hsa-miR-24-3p). We can see miRNAs effect different pathways, such as mitogen-activated protein kinase (MAPK) signaling pathway and oxytocin signaling pathway (Figure 2). Meanwhile, the BP enrichment analysis showed that these genes were mainly associated with learning or memory, axonogenesis, cognition, forebrain development, axon development, neuron projection guidance, Ras protein signal transduction, the wnt signaling pathway, cell−cell signaling by wnt, and regulation of actin filament−based process (Figure 3).

A, It reveals the 132 KEGG results of up-regulated miRNAs (hsa-miR-3646, hsa-miR-4435 and hsa-miR-595). B, It reveals the 65 KEGG results of down-regulated miRNAs (hsa-miR-125a-3p, hsa-miR-125b-1-3p and hsa-miR-22-3p). The tendency of GeneRatio was represented by the size of the circle. The tendency of P value was represented by the color.
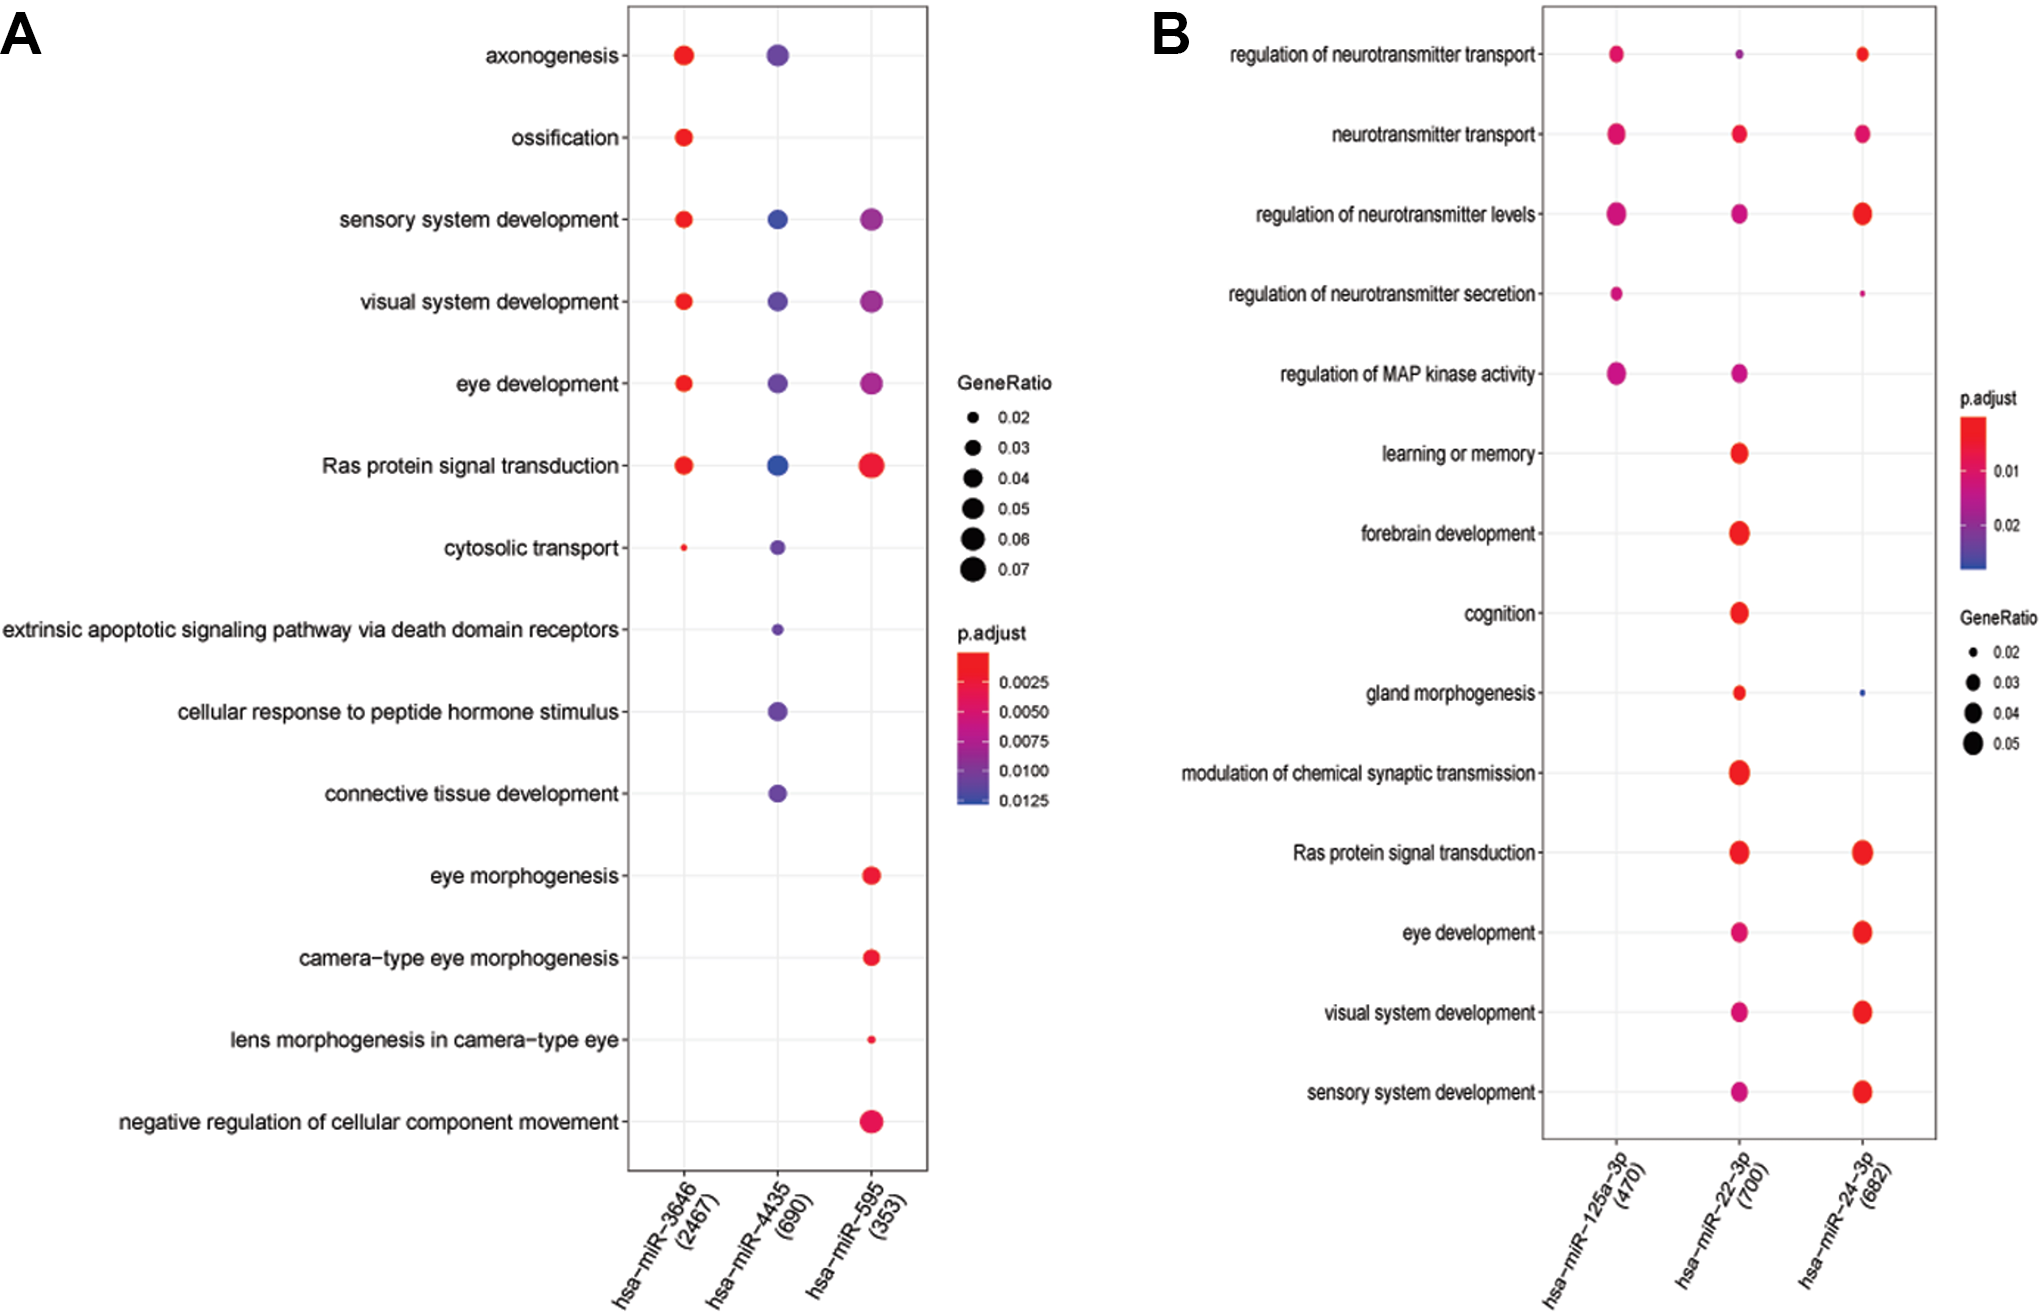
A, It reveals 575 BP results of up-regulated miRNAs (hsa-miR-3646, hsa-miR-4435 and hsa-miR-595). B, It reveals 515 BP results of down-regulated miRNAs (hsa-miR-125a-3p, hsa-miR-22-3p and hsa-miR-24-3p). The tendency of GeneRatio was represented by the size of the circle. The tendency of P value was represented by the color.
miRNA-TF-Target Regulatory Network
According to the method described above, 97 disease-related genes were obtained by comparing the genes with influence score >15 and the key genes analyzed in the previous step. Then, a total of 10 TF, 53 disease-related genes and 123 TF-Target regulatory relationship pairs were predicted. After that 6 miRNAs and 78 miRNA-disease-related gene sub-networks were obtained. As showed in Figure 4, miRNA-TF-target regulatory network was obtained after sorted out from the previous 2 networks. Three miRNAs (hsa-miR-595, hsa-miR-3646 and hsa-miR-4435) were increased in AD, and 3 miRNAs (hsa-miR-125a-3p, hsa-miR-22-3p and hsa-miR-24-3p) were decreased in AD. Nine TF (E2F1, AACTTT, E4BP4, NFAT, HLF, USF, MYC, MYCMAX and MAX) indicated a close connection in miRNA-TF-target regulatory network. Moreover, many genes were involved in the miRNA-TF-target regulatory network, such as SORT1, IL-13, and HNRNPC.

miRNA-TF-target regulatory network diagram. Yellow circles are disease-related genes, red triangles are up-regulated miRNA, green chamfers are down-regulated miRNA, and orange hexagons are TF.
CeRNA Network
After integrated miRNA-disease-related gene subnetwork, we obtain 6 miRNAs, 53 disease-related genes and 116 ceRNA regulatory relationship pairs, and the ceRNA regulatory network was obtained by using cytoscape, as showed in Figure 5.

lncRNA-miRNA-target regulation network diagram. Yellow circles are disease-related genes, red triangles are up-regulated miRNA, green chamfers are down-regulated miRNA, and blue squares are lncRNA.
Analysis of Drug-Gene-Interaction Genes Directly Related to Diseases
According to the prediction results of DGIdb, we obtained 53 pairs about drug-gene interaction, including 7 genes (PTGS2, EGFR, CALM1, PDE4D, FGFR2, HMGCR, cdk6) and 53 drugs. The network diagram is shown in Figure 6.

Drug-gene-interaction diagram. Yellow circles are disease-related genes, and purple diamonds are drugs.
Discussion
AD is a neurodegenerative disease with poor prognosis, which often has pathophysiological changes before clinical diagnosis. Before the disease progressed to AD stage, AD-related biomarkers in blood, cerebrospinal fluid and brain had changed. As mentioned above, miRNA is becoming the main candidate to help diagnose AD and judge prognosis.
In our study, 21 differentially expressed miRNA were found significantly in AD. Moreover, these miRNAs have less study to verify the connection to AD. From the miRNA-TF-target regulatory network, we can see these miRNAs influence many genes which have been confirmed to influence AD, such as HNRNPC, 34,35 IL13, 36 SORT1 37 and HMGCR. 38 The results indicate modulating these miRNAs may influence the expression of these AD-related genes. For instance, further prediction analysis showed that hsa-miR-3646 targeted HNRNPC genes. HNRNPC is a member of heterogeneous nuclear ribonucleoproteins family, and it is also associated with Aβ metabolism. HNRNPC participates in the post-transcriptional regulation of amyloid precursor protein (APP) mRNA through specific interaction with 3’-untranslated region. 34 In addition, HNRNPC also promotes APP translation by competing with FMRP gene for the same region. 35 We can draw sound reasoning that modulating hsa-miR-3646 may influence Aβ metabolism via altering the expression of HNRNPC. And all that, the significantly miRNAs in our study may disclose the possible correlations to AD, and become a meaningful direction to early screening and treat AD.
The results of KEGG and GO enrichment analysis suggested that the main target pathways of several miRNAs differentially expressed in AD were MAPK signal pathway. MAPK has attracted tremendous attention due to its roles in numerous cellular events, including mitogenesis, differentiation, cell survival and apoptosis, 39 and MAPK signal pathway has been confirmed involved in AD pathological process. 40 -43 Our results showed mir-3646, mir-4435, mir-125a-3p and mir-22-3p were involved in MAPK signal pathway. The main BP enrichment results included axonogenesis, axon guidance, forebrain development, etc. In a word, our analysis shows that there are significant disorders of miRNAs expression in AD patients, and their role in AD may be influenced by their regulation in key pathways. However, further validation tests are needed to study the reliable relationship and its possible mechanism.
LncRNAs range from ∼200 bases to hundreds of kilobases. Previous study indicated an important role in maintaining cellular physiology in AD. 44 These lncRNAs were implicated the synaptic plasticity and memory in different regions and cell types. 45,46 Our results indicated 30 lncRNAs may be involved in AD pathological process. However, none of them were examined in AD patients or any animal/cell experiment. Together, these findings highlight emerging roles for lncRNAs in AD pathophysiology. In addition, this evidence supports the notion that lncRNAs may serve as AD markers and candidates for AD diagnosis and therapy.
Although many groups have spent much time and money to explore the treatment AD, but now only a few drugs were confirmed useful to AD patients. Interesting, many drugs were involved in our drug-gene-interaction network. Inspiring, some of them were undergoing the examination its effect on AD, such as statins (simvastatin, 47,48 lovastatin, 49 and aspirin 50,51 ). Although these studies have not yet obtained conformance evaluation of AD in human populations, the results in Figure 6 indicate that more drugs may be available for the treatment of AD in the future.
Since a rising number of miRNAs were proved a significant role in the molecular, cellular, physiologic, and epidemiologic levels in AD. In the integrated bioinformatics analysis, we predict significant miRNAs, its target genes, and its possible ways in AD, and most of them have not yet been proved in recent studies. Our results reveals that miRNAs play an important role in AD pathogenesis, and we hope effective miRNAs-based interventions will become a viable way to prevent, delay the onset, diagnose, and treat AD. However, there are some limitations in this study. First, a comprehensive and detailed analysis in a larger sample of patients was needed to further validate our findings. Moreover, the subsequent correlated experimental research is needed to verify our results.
Footnotes
Authors’ Note
Conception and design of the research: XZ; acquisition of data: LL, WD and TM; analysis and interpretation of data: XZ, JH and LL; Statistical analysis: TM; drafting the manuscript: XZ; revision of manuscript for important intellectual content: XZ. All authors read and approved the final manuscript.
Declaration of Conflicting Interests
The authors declared no potential conflicts of interest with respect to the research, authorship, and/or publication of this article.
Funding
The authors disclosed receipt of the following financial support for the research, authorship, and/or publication of this article: This work was supported by grants from the National Natural Science Foundation of China (No. 81801054), the National Natural Science Foundation of Jiangsu province (No. BK20180166), Wuxi Top Talent Support Program for young and middle-aged people of Wuxi Health Committee (No. HB2020023) and China Postdoctoral Funding.