
Abstract
Objective:
To find a suitable dividing value to classify cystatin C and evaluate the association between cognition and levels of cystatin C.
Methods:
Using data from the China Health and Retirement Longitudinal Study, We conducted a longitudinal analysis of a prospective cohort of 6,869 middle-aged and older Chinese without cognitive impairment at baseline. Levels of cystatin C were categorized into 2 groups by method of decision tree. Logistic regression models evaluated whether cystatin C was related to cognitive impairment.
Results:
Respondents were categorized as lower levels of cystatin C and higher levels of cystatin C, cut-point was 1.11 mg/L. Higher levels of cystatin C was associated with the odds of cognitive impairment (OR, 1.56; 95% CI, 1.10-2.22) after multivariable adjustment. Respondents with higher levels of cystatin C had worse cognition scores.
Conclusions:
We found a suitable dividing value of cystatin C in middle-aged and older Chinese.
Significance Statement
Some studies have shown that cognitive dysfunction was significantly associated with elevated levels of serum cystatin C. However some reviews had shown the different results, that lower levels of cystatin C represent an important predictor of the conversion of MCI to AD. The association between cognition and levels of cystatin C is inconsistent, which is not conducive to clinical application.
The cut-point of cystatin C was diverse in different articles. For example, there was a scholar categorized cystatin C into 3 groups (≤1.0, 1.0-1.25, ≥1.25 mg/L). Other classification of cystatin C were ≤0.9, 0.91-1.01, 1.02-1.15, ≥1.16 mg/L. It is observed that the tertile or quartile division was unstable and variable in different studies, and it was not conducive to clinical use.
Introduction
Cognitive impairment is one of the costliest disabilities, making successful aging without cognitive impairment a paramount goal for society. 1 Recent studies have shown that cognitive impairment may be associated with poorer kidney function. 2 -4 Serum or plasma creatinine have become the most commonly used serum marker of renal function. These years a new serum measurement of kidney filtration, cystatin C, is much less affected by age, sex, and muscle mass compared to serum creatinine. 5 -7 It is possible that cystatin C may also be a biomarker of cognitive function.
Cystatin C is an endogenous cysteine inhibitor, produced by nearly all human cells and available in all body fluids. It is excreted into the bloodstream, filtered in the renal glomerulus, and metabolized by the proximal tubule. 7 -9 Cystatin C has been linked to risk of cognitive impairment through genetic and neuropathological studies. 10 -12 Mark 13 found higher levels of cystatin C (≥1.02 mg/L) was associated with impaired cognition in elders. Yaffe et al 14 determined that among community-resident elders, those with elevated cystatin C (≥1.25 mg/L) had lower scores on cognitive tests. While other studies have reported low level of cystatin C might be a marker of future risk of AD. 15,16 The association between cognition and levels of cystatin C is inconsistent. In addition the cut-point of cystatin C was diverse in different articles, which is not conducive to clinical application.
The goal of this analysis was to find a suitable dividing value to classify cystatin C, and evaluate the association between cystatin C and cognitive impairment in elders without memory-related disease at the baseline, using data from the CHARLS.
Methods
Study Population
This was a longitudinal study conducted using the China Health and Retirement Longitudinal Study (CHARLS) baseline dataset. CHARLS is nationally representative longitudinal survey of persons in China 45 years of age or older and their spouses, including assessments of social, economic, and health circumstances of community-residents. The national baseline survey for the study was conducted between June 2011 and March 2012 and involved 17 708 respondents. CHARLS respondents are followed every 2 years, using a face-to-face computer-assisted personal interview.
To be included in the current analysis, respondents needed to be aged 45 and older and have complete data on age, gender, education, body mass index (BMI), smoke, drink, physical activity, blood pressure, hypertension, diabetes or high blood sugar, stroke, memory-related disease, and cognition scores. Those respondents with memory-related disease or cancer were excluded at the baseline, and 6869 respondents in this cohort were eligible for inclusion, detailed screening process was shown in Figure 1.
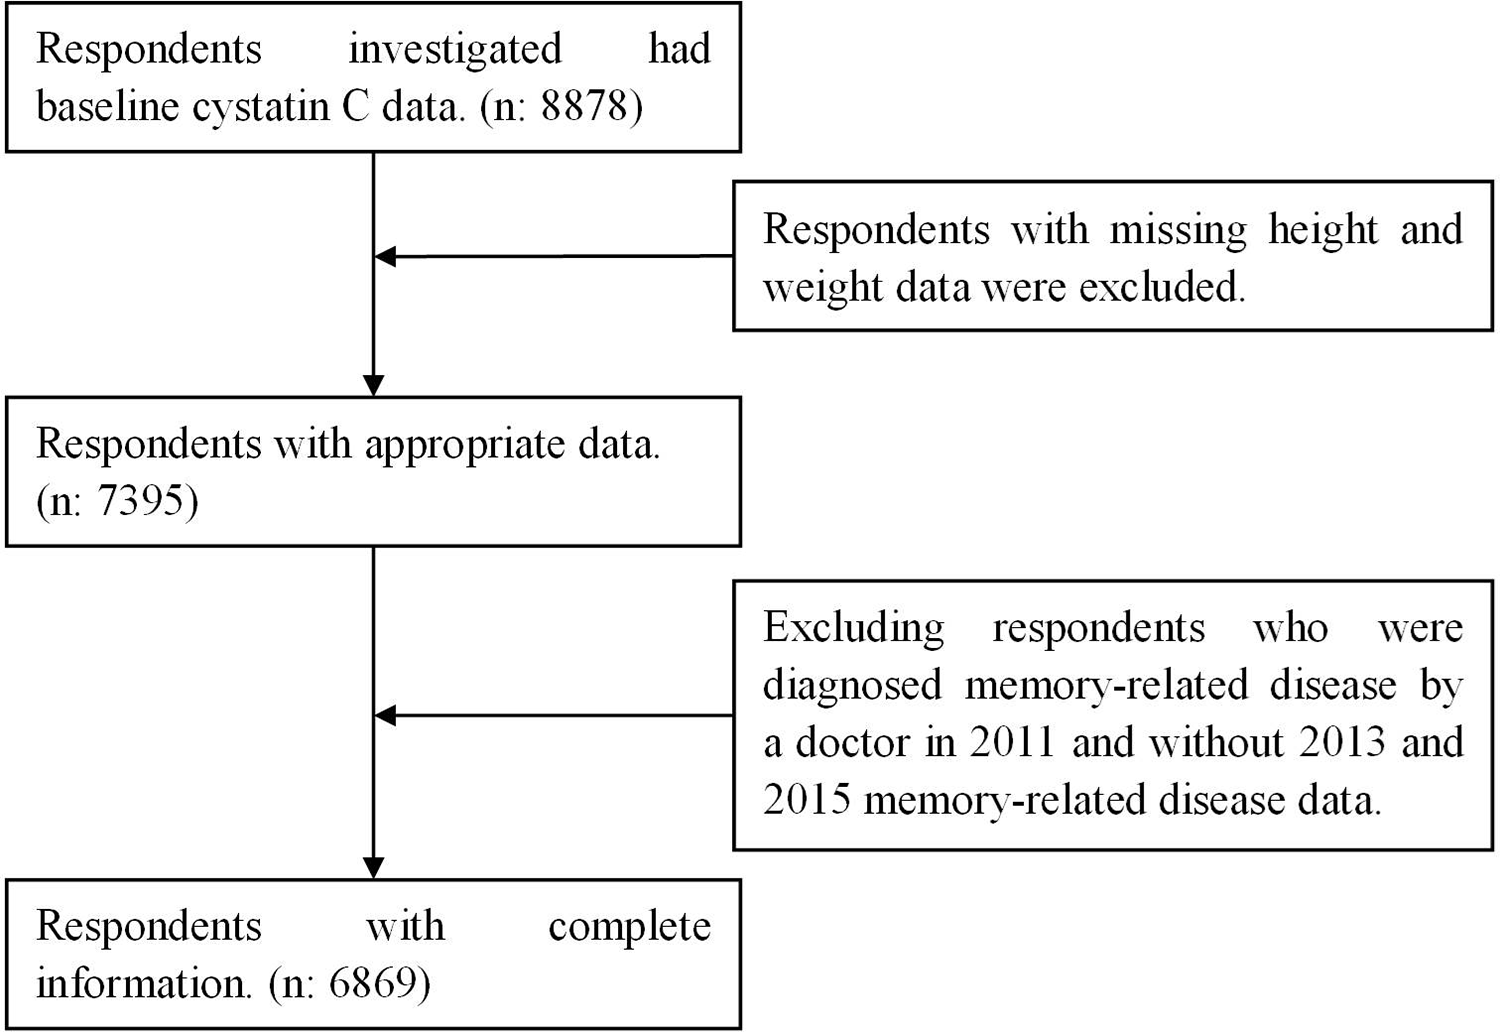
Sample quality control flow chart.
Measurements
Measurements of Cystatin C and Other Blood Samples
Venous blood samples were collected from each respondent by medically-trained staff from the China Center for Disease Control and Prevention (CDC), based on a standard protocol. These samples were then immediately stored frozen at −20ºC and transported to the Chinese CDC in Beijing within 2 weeks where they were placed in a deep freezer and stored at −80ºC until assay at Clinical Laboratory of Capital Medical University. Then cystatin C, glycosylated hemoglobin (HbA1c), glucose, a lipid panel (total, high density lipoprotein, low density lipoprotein cholesterol, and triglycerides), creatinine and uric acid were measured from whole blood samples. Cystatin C was measured by particle-enhanced turbidimetric assay, with an analytical range of 0.5-8 mg/L and between-assay coefficient of variation of <5%. The assay was performed using Roche kits (Roche Diagnostics, Basel, Switzerland) on a Hitachi 7180 chemistry analyzer (Hitachi, Tokyo, Japan). HbA1c levels were measured using the Boronate affinity HPLC method. Glucose and serum lipid levels were tested using an enzymatic colorimetric method. The serum creatinine levels were measured usingarate-blanked and compensated Jaffe creatinine method. Uric acid levels were analyzed by uric acid plus method.
Cognitive Assessment
Whether respondents developed memory-related disease diagnosed by a doctor is the main outcome. The cognitive scores were calculated from the questions in the cognition & depression section of the questionnaire. Consistent with prior CHARLS publications, 17,18 3 cognition scores were used: items from the Telephone Interview of Cognitive Status (TICS-10), word recall, figure drawing. 17 The first cognitive measure is based on some components of the mental status questions of the TICS battery established to capture intactness or mental status of individuals. 19 Ten mental status questions from the TICS were used in CHARLS: serial subtraction of 7 from 100 (up to 5 times), data (year, month, day), day of the week, and the current season. 17 The TICS-10 score was the aggregate number of correct answers and ranged from 0 to 10. 17,20 The second is words recall, interviewers read a list of 10 nouns, and respondents were asked immediately to recall as many of the words as they could in any order. About 10 minutes later, after the respondents had finished measurements of self-reported depression, numeracy and drawing, they were asked again to recall as many of the original words as possible. This test measures episodic memory. The episodic memory score consisted of the average number of immediate and delayed word recalls and ranged from 0 to 10. 21 Our third measure is whether respondents had replicated the figure as similarly as possible, when a picture of 2 overlapped pentagons was shown in the survey. This task assessed visuospatial abilities. 22 Respondents who successfully completed the task received a score of 1, and those who failed received a score of 0.
Other Measures
Demographic background, biomarker, health status and functioning, blood sample were contained in this study. Demographic background included age, gender, education, education was categorized into 2 groups: low level of education were illiterate, did not finish primary school but capable of reading or writing, sishu/home school, graduate from elementary school. High level of education were graduate from middle school or above. Biomarker included systolic blood pressure (SBP) and diastolic blood pressure (SBP), height and weight, body mass index was calculated as weight in kilograms by the square of height in meters. Health status and functioning included smoke (Yes/No), drink (Yes/No), physical activity frequently (regular exercise 3 times a week or above), respondents were asked to answer whether they had been diagnosed with hypertension, diabetes or high blood sugar, stroke, memory-related disease by a doctor. If respondents’ SBP was higher than 140 mmHg or DBP was higher than 90 mmHg, we classified them as hypertension. If respondents’ fasting plasma glucose was higher than 126 mg/dL or HbA1c was higher than 6.5%, we classified them as diabetes. We estimated the glomerular filtration rate using the CKD-EPI (Chronic Kidney Disease Epidemiology Collaboration) creatinine equation.
Statistical Analyses
Characteristics of the overall sample were described using means and standard deviations for continuous data and percentages and 95% confidence intervals (95% CIs) for categorical data. In order to find a reasonable dividing values for cystatin C, we used a decision tree model. We split the original data set into training data set and validation data set in accordance with 70% to 30%. A Chi-squared automatic interaction detection was used to develop the decision tree models. It took Chi-square and F test as the attribute segmentation criteria. As a result, so the respondents were divided into 2 groups based on 2011 levels of cystatin C. The association of the odds of incident cognitive impairment with levels of cystatin C and cystatin C were analyzed using logistic regression models. Covariates in adjusted models included Total Cholesterol, eGFR, BMI, smoke, drink, education, physical activity, hypertension, diabetes or high blood sugar, stroke. Results of logistic regression models were presented using odds ratios (ORs) and 95% CIs. We conducted subgroup analyses to analyze the association between levels of cystatin C and cognitive impairment in different genders and ages (younger and older than 60 years). Finally, Wilcoxon rank sum test and Chi-square test was used to examine the association of levels of cystatin C with cognitive abilities. The statistical tests were 2-sided, and a significance level of 0.05 was used. Analyses were performed using SAS (version 9.4).
Results
Altogether 6869 respondents were included in the analytical sample. The mean age of the sample was 60.46 ± 9.78, and 53.37% were female. Detailed characteristics of overall sample were presented in Table 1.
Baseline (2011) Characteristics of 6898 Participants.

Data are presented as percentage (95% confidence interval) or mean ± standard deviation.
BMI indicates body mass index; SBP, systolic blood pressure; TC, total cholesterol; TG, triglycerides; HDL-C, high-density lipoprotein cholesterol; LDL-C, low-density lipoprotein cholesterol; and eGFR, estimated glomerular filtration rate.
A total of 190 respondents developed cognitive impairment between 2011 and 2015. In accordance with 70% to 30%, all the participants were set into training data set (n = 4808) and validation data set (n = 2061). According to the decision tree model, the optimal grouping boundary value of cystatin C is 1.11 mg/L. The incidence of cognitive impairment in group with lower levels of cystatin C for training data set is 2.02% and for validation is 2.21% (Figure 2). The incidence of cognitive impairment in group with higher levels of cystatin C for training data set is 4.38% and for validation data set is 4.93%. A total of 4725 (68.79%) respondents were assigned to group with lower levels of cystatin C, average value was 0.89 ± 0.13 mg/L. And 2144 (31.21%) respondents were assigned to higher levels of cystatin C, average value was 1.30 ± 0.31 mg/L.

Incidence of cognitive impairment in different cystatin C groups from 2011 to 2015.
We observed that respondents with higher levels of cystatin C had worse TICS score and words recall score the median and interquartile range were 5 (2, 8) and 2 (0, 3.5), than lower cystatin C levels the median and interquartile range were 6 (4, 9) and 3 (1.5, 4.5). All the differences were statistically significant (Table 2, all P < 0.01).
Comparison of Cognitive Abilities in Different Cystatin C Groups.

As shown in Table 3, higher levels of cystatin C was associated with the odds of cognitive impairment in model 1, the ORs (95% CIs) were 2.24 (1.68-3.00). After multivariable adjustment, the strength of the relationships was attenuated, but higher levels of cystatin C remained significantly associated with cognitive impairment in model 3, the ORs (95% CIs) were 1.56 (1.10-2.22). Similar results were also observed in the sensitivity analysis by excluding those who had stroke (OR, 1.52; 95% CI, 1.09-2.12), excluding respondents older than 90 (OR, 1.44; 95% CI, 1.04-2.00) in Table 4. The association between higher levels of cystatin C and odds of cognitive impairment was more pronounced among women (OR, 1.65; 95% CI, 1.00-2.75) and adults over 60 (OR, 1.71; 95% CI, 1.15-2.54) in Table 4.
Odds Ratio and 95% Confidence Intervals of Cognitive Impairment Based on Levels of Cystatin C.

Odds Ratio and 95% Confidence Intervals of Cognitive Impairment Based on Levels of Cystatin C (Sensitivity Analyses).

Discussion
Through analysis, we found the best statistical results were obtained when the cut-off value of cystatin C was set at 1.11mg/L. This study also demonstrated that higher levels of cystatin C were positively associated with the cognitive impairment in middle-aged and older Chinese after multivariable adjustment. In addition, respondents with higher levels of cystatin C had lower scores on cognitive tests.
Our finding of an association between cystatin C and cognitive function are consistent with these previous studies. 23,24 In a cross-sectional survey of National Health and Nutrition Examination Survey, it was reported that serum cystatin C is early markers of chronic kidney disease might serve as early and effective markers for cognitive decline in older adults. 25 The same results were found cognitive dysfunction was significantly associated with elevated levels of both serum cystatin C and microalbuminuria in another Tanushimaru study, which is a cohort of the Seven Countries Study. 26 However some reviews had shown the different results, that cystatin C is a therapeutic candidate that can potentially prevent brain damage and neurodegeneration. 27 Lower levels of cystatin C represent an important predictor of the conversion of MCI to AD. 28 The reason for the inconsistent results may be the diverse cohorts. But our prospective study provides new evidence for the cystatin C as a risk factor of cognitive impairment.
The best pointcut of cystatin C was found in this study, analyzed by method of decision tree, which is different from tertile or quartile division. For example, Kristine Yaffe 14 categorized cystatin C into 3 groups (≤1.0, 1.0-1.25, ≥1.25 mg/L), found the incidence of cognitive impairment on the Modified Mini-Mental State Examination was greatest among those with high cystatin C compared to low level. The classification of cystatin C in Sarnak et al 13 research were ≤0.9, 0.91-1.01, 1.02-1.15, ≥1.16 mg/L, the highest vs lowest quartile of cystatin C was independently associated with incident cognitive. It is observed that the tertile or quartile division was unstable and variable in different studies, and it was not conducive to clinical use. Our dividing value was close to their highest dividing value in these studies, and in which there were no statistical significance between the first 2 or 3 groups.
We analyzed the relationship between cystatin C and cognitive impairment included not only memory-related diseases diagnosed by a doctor but also cognitive scores. Cognitive scores assessed the cognitive dimensions of orientation, attention, episodic memory, and visuospatial abilities. 18 In this study, lower cognitive scores and higher incidence of cognitive impairment were found in higher levels of cystatin C group. That is to say, the levels of cystatin C can be used to improve the accuracy of predicting whether cognitive impairment will occur in the elderly.
There are several important limitations to this study. First, the follow-up time was short and some respondents had not developed the memory-related disease, but we have found the significant differences between groups. Second, some respondents did not have follow-up cognitive testing among those with high cystatin C may have led to an underestimation of the association between cystatin C and cognitive decline. Third, some of the elderly died within 4 years, our results might represent survivor bias. But we found out 2 deceased because of memory-related disease, then we added them to the number of cases to reduce bias.
In conclusion, our study revealed that higher levels of cystatin C increase the risk of cognitive impairment, cut-point was 1.11 mg/L. The finding suggest that cystatin C might be useful for identifying individuals at high risk for cognitive impairment among the elderly. Further studies should determine a suitable cut-point of cystatin C.
Footnotes
Acknowledgments
We would like to acknowledge the CHARLS team for the publicly available data.
Abbreviations
Authors’ Note
Zhizhen Cui and Guizhen Cao contributed equally to writing this article and are joint first authors. Hongpeng Sun initiated and designed the study, assisted in interpreting the results, revised the paper and finally approved the version to be published. Zhizhen Cui contributed to conception and design, acquisition of data, performed statistical analysis, prepared all tables, drafted the initial manuscript and finally completed the version to be published. All authors read and approved the final manuscript. The CHARLS project was approved by the Biomedical Ethics Committee of Peking University. During the field, each of the respondents who agreed to participate in the survey signed 2 informed consent forms.
Declaration of Conflicting Interests
The author(s) declared no potential conflicts of interest with respect to the research, authorship, and/or publication of this article.
Funding
The author(s) disclosed receipt of the following financial support for the research, authorship, and/or publication of this article: This study was funded by National Natural Science Foundation of China (81402761), the Foundation Research Project of Jiangsu Province (BK20140361), Suzhou science and technology development project (SS201811), Suzhou Xiangcheng district people’s livelihood science and technology project (XJ201655, XJ201706), Jiangsu Key Laboratory of Preventive and Translational Medicine for Geriatric Diseases (KJS1513).