
Abstract
This study investigated how different nutritional and functional status indicators are associated with mortality in patients with Alzheimer’s disease (AD). A prospective cohort study was conducted among 79 community-dwelling older adults with AD. Follow-up was 60 months. Undernutrition status was evaluated by Mini Nutritional Assessment (MNA), body mass index, mid-arm muscle circumference (MAMC), calf circumference, and phase angle. Functional status was assessed by handgrip strength, and usual gait speed. Twenty-two participants died (27.8%). Results show that undernutrition (hazard ratio [HR] 5.69, 95% confidence interval [CI] 2.21-14.61), weight loss (HR 3.82, 95% CI 1.37-10.63), underweight (HR 3.24, 95% CI 1.18-8.82), low MAMC (HR 4.54, 95% CI 1.65-12.48), calf circumference ≤ 31 (HR 4.27, 95% CI 1.63-11.16), low HGS (HR 3.11, 95% CI 1.18-8.17), and low gait speed (HR 4.73, 95% CI 1.68-13.27) were all associated with mortality. In conclusion, a poor nutritional and functional status was associated with a higher risk of mortality, regardless of sex, age, marital status, education, and cognitive function.
Introduction
Dementia is one of the leading causes of disability and morbidity in older adults and strongly impacts patients and their families, financial health-care costs, and social systems. 1,2 It has been reported that several factors are linked to dementia mortality, such as age, gender, education, marital status, sociodemographics, severity of the disease, and functional performance. 3,4 In contrast to non-modifiable factors, nutritional status can be modified to preserve functional capacity and to improve life expectancy. 5 Indeed, recent guidelines on nutrition in dementia by the European Society for Clinical Nutrition and Metabolism (ESPEN) recommended nutritional care and support as an integral part of dementia management. 6
Alzheimer’s disease (AD) is the most frequent cause of dementia. 3,7 Unintended weight loss 8 and undernutrition 9 -11 are prevalent in patients with AD, even in its early stages, being associated with the loss of muscle mass, 12 strength, 13 and walking ability. 14
A prospective study carried out among very old adults with dementia and residing in care homes showed that, when compared to normal-weight participants, mortality was reduced by almost half in the overweight and obese and increased in those who were underweight. 15 Also, undernutrition evaluated by Mini Nutritional Assessment (MNA) has also been linked to higher cognitive decline, 5,16 dependency, 17 poor quality of life, morbidity, and mortality in patients with AD. 3,7 Otherwise, there is a growing body of evidence showing that nutritional interventions in undernourished patients are related to improvements in nutritional status 18 -20 and quality of life. 21 There are other indicators of undernutrition status such as circumferences and phase angle (PA) and also of functional status, such as handgrip strength (HGS) and usual gait speed that can be used in clinical practice to identify nutritional and functional status dysfunctions. However, their ability to predict adverse outcomes, such as mortality in community-dwelling older adults with AD, remains to be explored.
Considering that an increased risk for the progressive decline of nutritional and functional status is common among community-dwelling older adults with dementia, 5 although the potential for prevention exists, it is important to investigate how the different nutritional and functional status indicators are associated with mortality in community-dwelling older adults with mild-to-moderate AD.
Method
Study Design and Sample
This prospective cohort study was conducted at the outpatient psychogeriatric clinic and in AD day care center of a psychiatric hospital, between April 2012 and September 2017 (censoring date). A systematic sampling approach was used, selecting all patients who were older than 65 years and living in the community. Patients were excluded from the study if the Mini-Mental State Examination (MMSE) score was under 10 points, and if they had severe acute illness or a known terminal illness in the last 5 years. The MMSE is a widely used method for assessing cognitive mental status 22 and is still being used as an almost universal severity or staging criteria for patient inclusion in clinical trials. 23
All patients met the criteria of the Diagnostic and Statistical Manual of Mental Disorders, Fifth Edition (DSM-5) 24 for dementia, and the criteria of the National Institute of Neurological and Communicative Diseases and Stroke/Alzheimer’s Disease and Related Disorders Association, 25 and of the National Institute on Aging Alzheimer’s Association workgroups on diagnostic guidelines for “probable” or “possible” AD. 26 Participants presenting a score on the MMSE ≥10 points and ≤ to 26 points were identified as having mild-to-moderate dementia, 23 and dementia was defined according to the DSM-5. Moreover, the diagnosis was always made in the context of a thorough clinical assessment, including performance on several tasks together. 27 Consensus diagnosis of dementia/no dementia was made at diagnostic meetings, including neurological, psychiatric, and neuropsychological examinations, standard laboratory tests, and magnetic resonance tomography or computed tomography as well as evidence of social or occupational functional deficits. A detailed history and examination by their primary care physicians were requested, including a comprehensive assessment of the patient symptoms and concerns, and their social functioning. A trained psychiatrist then confirmed the diagnosis of AD for all patients based on the history, clinical presentation, evidence of progressive intellectual deterioration, and exclusion of other causes of dementia. The study sample was composed of 79 participants. The maximum follow-up period was 60 months.
Ethics
This research was carried out in full compliance with the Declaration of Helsinki 28 and approved by the institutional ethics and review board (number 9/2011). All study participants and their legal guardians gave written informed consent.
Data Collection
Demographic data included information on sex, date of birth, marital status, and education. The following age categories were considered: [65–74] and >74 years old. Marital status was categorized as single and other. Educational level was ascertained by the years of completed schooling. Two education categories were created: 0 to 4 years and >4 years of completed schooling. Medical records were collected from patients’ clinical files at the time of evaluation. A trained registered nutritionist obtained the remaining data.
Cognitive impairment was evaluated by the clock drawing test (CDT), 29 and the version of the MMSE tool validated for the Portuguese population. 30 For the CDT, each patient was given a blank sheet and instructed to draw a clock face and write all the numbers on it to make it look like a clock and thereafter to indicate the time 10 minutes past 11 o′clock. The clock face was scored by dividing it into 8 seconds, beginning with a line through the number 12 and the center of the circle. One point was given for placing each of the numbers 1, 2, 4, 5, 7, 8, 10, and 11 in the proper octant of the circle, and 1 point each was given for drawing a shorthand pointing to the 11 and a long hand pointing to the 2. The Shulman method was used to analyze the CDT performance, 31 and the cutoff points were CDT = 7 to 9 (normal) and CDT = 0 to 3 (cognitive impairment). The MMSE screening tool is a brief 30-item questionnaire test widely used to assess orientation, memory, and other cognitive skills, providing a total score ranging from 0 to 30, with higher scores indicating better cognitive status. A score of <20 points is usually considered to be indicative of clinically significant cognitive impairment. The previously validated MMSE normative cutoff values for the Portuguese population adjusted to education level were used to classify participants with more pronounced cognitive decline. According to this version of the MMSE, the cutoff scores for “cognitive impairment” are individuals without education, < 15 points; 1 to 11 years of schooling, < 22 points; and > 11 years of schooling, < 27 points. 30
Participant’s undernutrition status was evaluated using the Portuguese version of the MNA full form. 32 The MNA consists of 18 items including anthropometric, global, dietetic, and subjective assessment dimensions. 33 The score ranges from 0 to 30, and it was calculated as the sum of the values from all 18 items. Participants were considered undernourished if the final score was less than 17 points and they were considered at risk of undernutrition if the final MNA score was between 17 and 23.5 points. Participants with a score equal or higher than 23.5 points were classified without undernutrition risk/undernutrition. 33 Self-reported weight loss was measured using 1 item from the Portuguese version of the MNA full form. 32 The following statement was read: “weight loss during the last 3 months was greater than 3kg” or “does not know or between 1 and 3kg” or “no weight loss.” If a participant answered yes to the first question, it was considered that he self-reported weight loss.
The anthropometric assessment included body weight and height, mid-arm muscle circumference (MAMC), and the calf circumference. All anthropometric measurements were carried out following standard procedures. 34 Participants were weighed (in kilograms) wearing light clothes and barefoot, using a portable calibrated digital scale placed on a firm surface, with a resolution of 0.1 kg (Seca®, Model 770 1321004; Vogel & Hamburg, Hamburg, Germany). Due to the difficulty in obtaining reliable height measurements, body height was gathered from the value recorded in their national identity card. Body mass index (BMI) was determined from standard formula (weight [in kilograms]/[in meters2]), and BMI categories were created according to the World Health Organization cutoffs. 35
The MAMC (centimeters) was calculated from mid-upper arm circumference (MUAC) (centimeters), and triceps skinfold thickness (TSF) (millimeters) using a standard formula. 36 To measure the MUAC (centimeters), a non-elastic but flexible plastic tape (Seca®, Model 201; Vogel & Hamburg) with a 0.1-cm resolution was wrapped around the mid-upper arm (between the shoulder and elbow). The arm circumference was measured on the nondominant upper arm, while the arm was in a relaxed position, hanging down beside body. Triceps skinfold thickness (millimeters) was measured 3 times in the nondominant arm with a Lange® skinfold caliper (Beta Technology Incorporated, Cambridge, Maryland), to the nearest 1 mm, and the mean was used. 36 When it was impossible to perform the measurement with the nondominant hand, the dominant hand was used. The 50th percentile of MAMC of sample distribution, stratified by sex, was calculated. Cutoffs were <19.7 cm for women, and <23.0 cm for men. According to MNA, 37 calf circumference (centimeters) was obtained at the maximum girth of the left calf in a sitting position with the knee and ankle at a right angle and feet resting on the floor using a nonelastic but flexible tape (Seca®, Model 201; Vogel & Hamburg) with 0.1 cm resolution. A cut point of less than 31 cm was considered as “low muscle mass.” 38
Bioelectrical impedance analysis was carried out with participants in a supine position, with upper and lower limbs apart from the trunk. Whole-body resistance and reactance were measured by tetrapolar bioelectrical impedance analyzer BIA 101® (Physiologic Data Analyser System, Akern, Florence, Italy)). 39 The PA (degrees) was calculated. 40 Participants were grouped into 2 PA categories according to the 50th percentile of sample distribution, stratified by sex: <3.2 (degrees) for women and <3.6 (degrees) for men.
Muscle strength was assessed by HGS, using a mechanical calibrated dynamometer (Smedley®; S Dynamometer, TTM, Tokyo, Japan, 100 kg, resolution of 0.5 kgf), according to the American Society of Hand Therapists protocol. 41 Participants were asked to sit in a chair, with the arm by the side of the body and their shoulders adducted, and with their elbows flexed 90° and their forearms in the neutral position. Each participant performed 1 test trial, and the mean value was recorded in kilogram-force (kgf) for a set of 3 contractions of the right hand. Participants were also grouped into 2 HGS categories according to the 50th percentile of sample distribution stratified for gender. Handgrip strength cutoffs were ≤10.2 kgf for women and ≤22.4 kgf for men.
Physical performance (muscle function) was assessed using the 4-m walking speed, measuring participants’ usual gait speed (in m/s) over a 4-m unobstructed course. The gait speed was calculated for each participant by dividing the distance traveled for 4 m at usual pace, by the time to cover that distance in seconds. In the present study, a cutoff of 0.4 m/s was considered as “low physical performance.” 42
Assessment of Mortality Status
The date of death was obtained through patient’s clinical files, and if necessary, was ascertained by a telephone call to caregivers and family members. The date of death was recorded as the date of the event. The time of death was measured and survival was assessed annually.
Statistical Analysis
Baseline characteristics variables by survival status were presented as counts and proportions and were compared using Pearson χ2 or Fisher Exact test. The time to death was measured as the time elapsed from the initial date of study to date of death. The associations of MNA, weight loss during the previous 3 months, BMI, mid-arm muscle and calf circumferences, PA, HGS, and gait speed with mortality were investigated. The MAMC, PA, and HGS of the sample were presented stratified by sex, and using cutoffs of the median sample distribution.
To describe associations of baseline variables with mortality, proportions of participants who died and the time until death were calculated, according to baseline variables. Median and interquartile range (IQR) survival time were used. The Kaplan–Meier test was applied in order to compare cumulative survival between groups. Log-rank test was used for testing the equality of survival among groups.
Multivariable Cox proportional hazards regression models were carried out to estimate adjusted hazard ratios (HRs) and corresponding 95% confidence intervals (CIs). Multivariable procedure adjusting for the potentially confounding effects of covariables, sex (categorical), age (categorical), marital status (categorical), education categories (categorical), and cognitive impairment (categorical) were used to evaluate the simultaneous effects of the above-mentioned baseline characteristics, as well as study follow-up time, on survival. The Akaike Information Criterion (AIC) values were determined for comparing the different Cox proportional hazards regression models. 43 Statistical significance was set at a P value <.05. All statistical analyses were conducted with IBM SPSS Statistics 24 (SPSS, Inc., an IBM Company, Chicago, Illinois).
Results
Nutritional and functional status characteristics of the study sample at baseline and survival time according to the mortality status for the 79 community-dwelling older adults with mild-to-moderate AD are presented in Table 1. Information on prescribed drugs and also concerning comorbidities baseline, according to the mortality status are presented in Table 2. The majority of the participants were women (60%). Age of participants at baseline ranged between 65 and 93 years (median [IQR] = 79 [28] years). A high proportion of participants (87%) were at nutritional risk (MNA < 17), while the remaining sample was undernourished. However, according to the BMI classification, 35 (44%) participants were normal weight (≥18.5 BMI ≤24.9 kg/m2), and 31 (39%) participants were overweight/obese (BMI ≥ 25.0 kg/m2). There were no differences between deceased and surviving patients concerning prescribed drugs and comorbidities. The median survival time was longer for men, for single participants, and for those with more than 4 years of schooling. The maximum follow-up period study was 60 months, and 22 participants died (27.8%) within the study period. Undernourished participants, those who presented weight of more than 3 kg loss during the previous 3 months, and those with low MAMC showed the lowest survival times. Furthermore, more than half of deceased participants presented low PA (64%), low HGS (73%), and low gait speed (73%).
Nutritional and Functional Status Characteristics of the Study Sample at Baseline and Survival time According to the Mortality Status in Community-Dwelling Older Adults With Mild-to-Moderate AD.

Abbreviations: AD, Alzheimer’s disease; BMI, body mass index; IQR, interquartile range; kgf, kilogram-force; MAMC, mid-arm muscle circumference; MMSE, Mini Mental State Examination; MNA, Mini Nutritional Assessment. n, number; %, percent.
a Pearson χ2 or Fisher Exact test.
b Median survival time describe the time until death when 50% of patients died.
c Log-rank test.
Drugs and Comorbidities of the Study Sample at Baseline, According to the Mortality Status in Community-Dwelling Older Adults With Mild-to-Moderate AD.
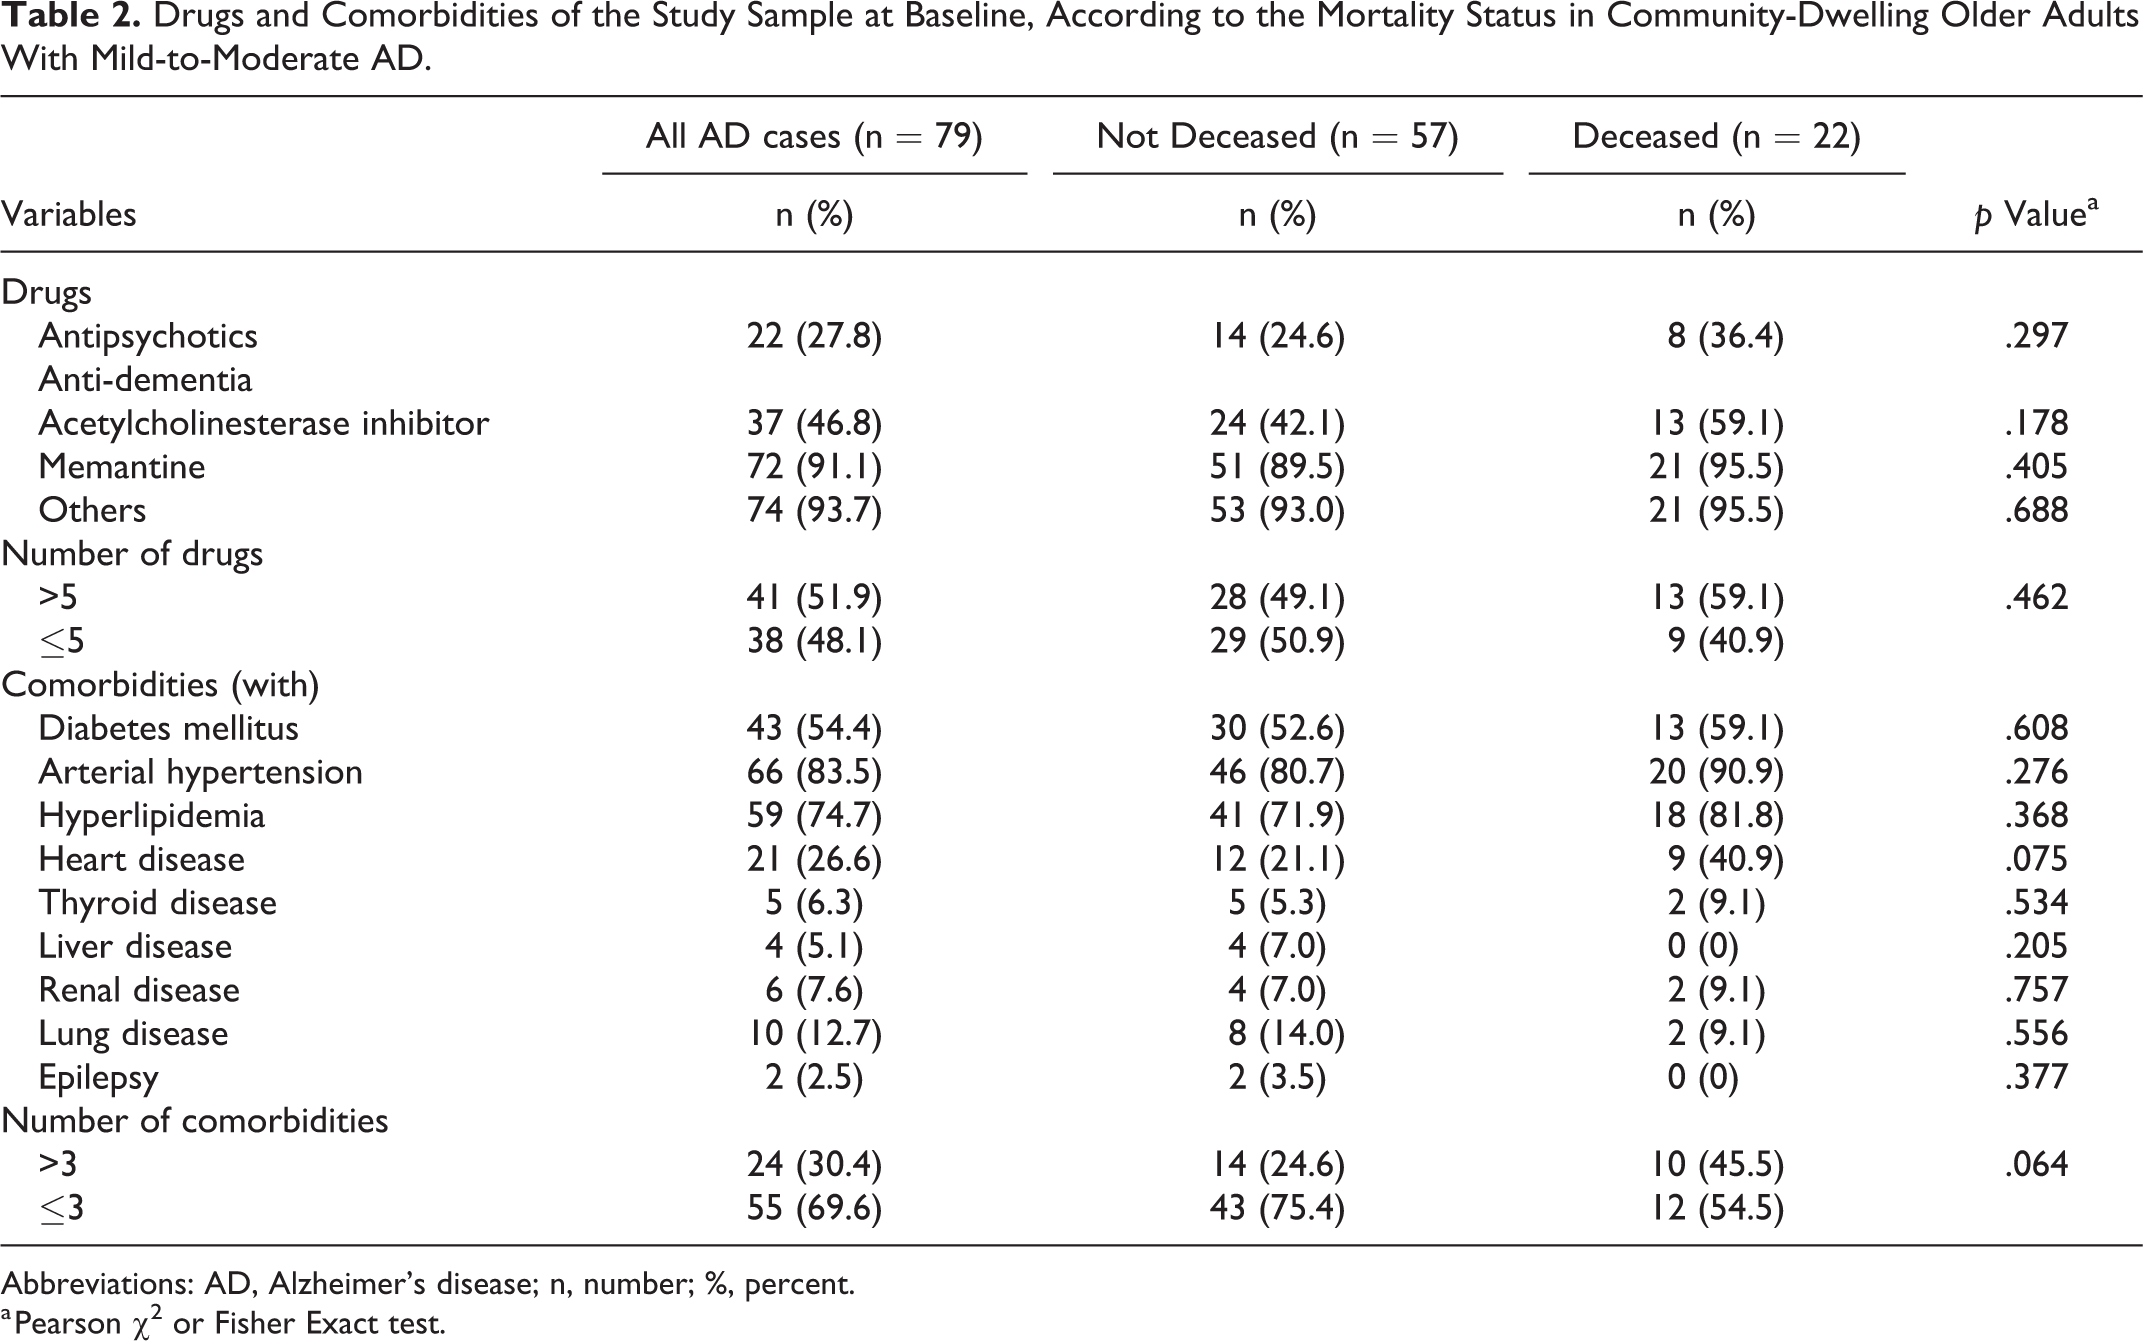
Abbreviations: AD, Alzheimer’s disease; n, number; %, percent.
a Pearson χ2 or Fisher Exact test.
Figures 1 and 2 show the Kaplan–Meier survival curves according to baseline nutritional and functional status characteristics, respectively. As expected, the survival time was inversely related to nutritional and functional status characteristics. It is worth noting that overweight and obese participants presented the highest survival, compared to normal weight or underweight participants, as displayed in Figure 1. Moreover, participants who were above the cutoffs for the calf circumference and above the 50th percentile for the PA showed a higher probability of survival over time (Figure 1). Lower baseline HGS and gait speed were associated with an increased mortality over time (Figure 2).

Kaplan–Meier estimates of cumulative survival of patients according to (A) calf circumference cutoffs (P = .001), (B) weight loss during the previous 3 months categories (P = .011), (C) body mass index cutoffs (P < .001), (D) Mini Nutritional Assessment categories (P < .001), and (E) phase angle categories (P = .032). Higher values of cumulative survival represent a lower probability of death at a certain time point.
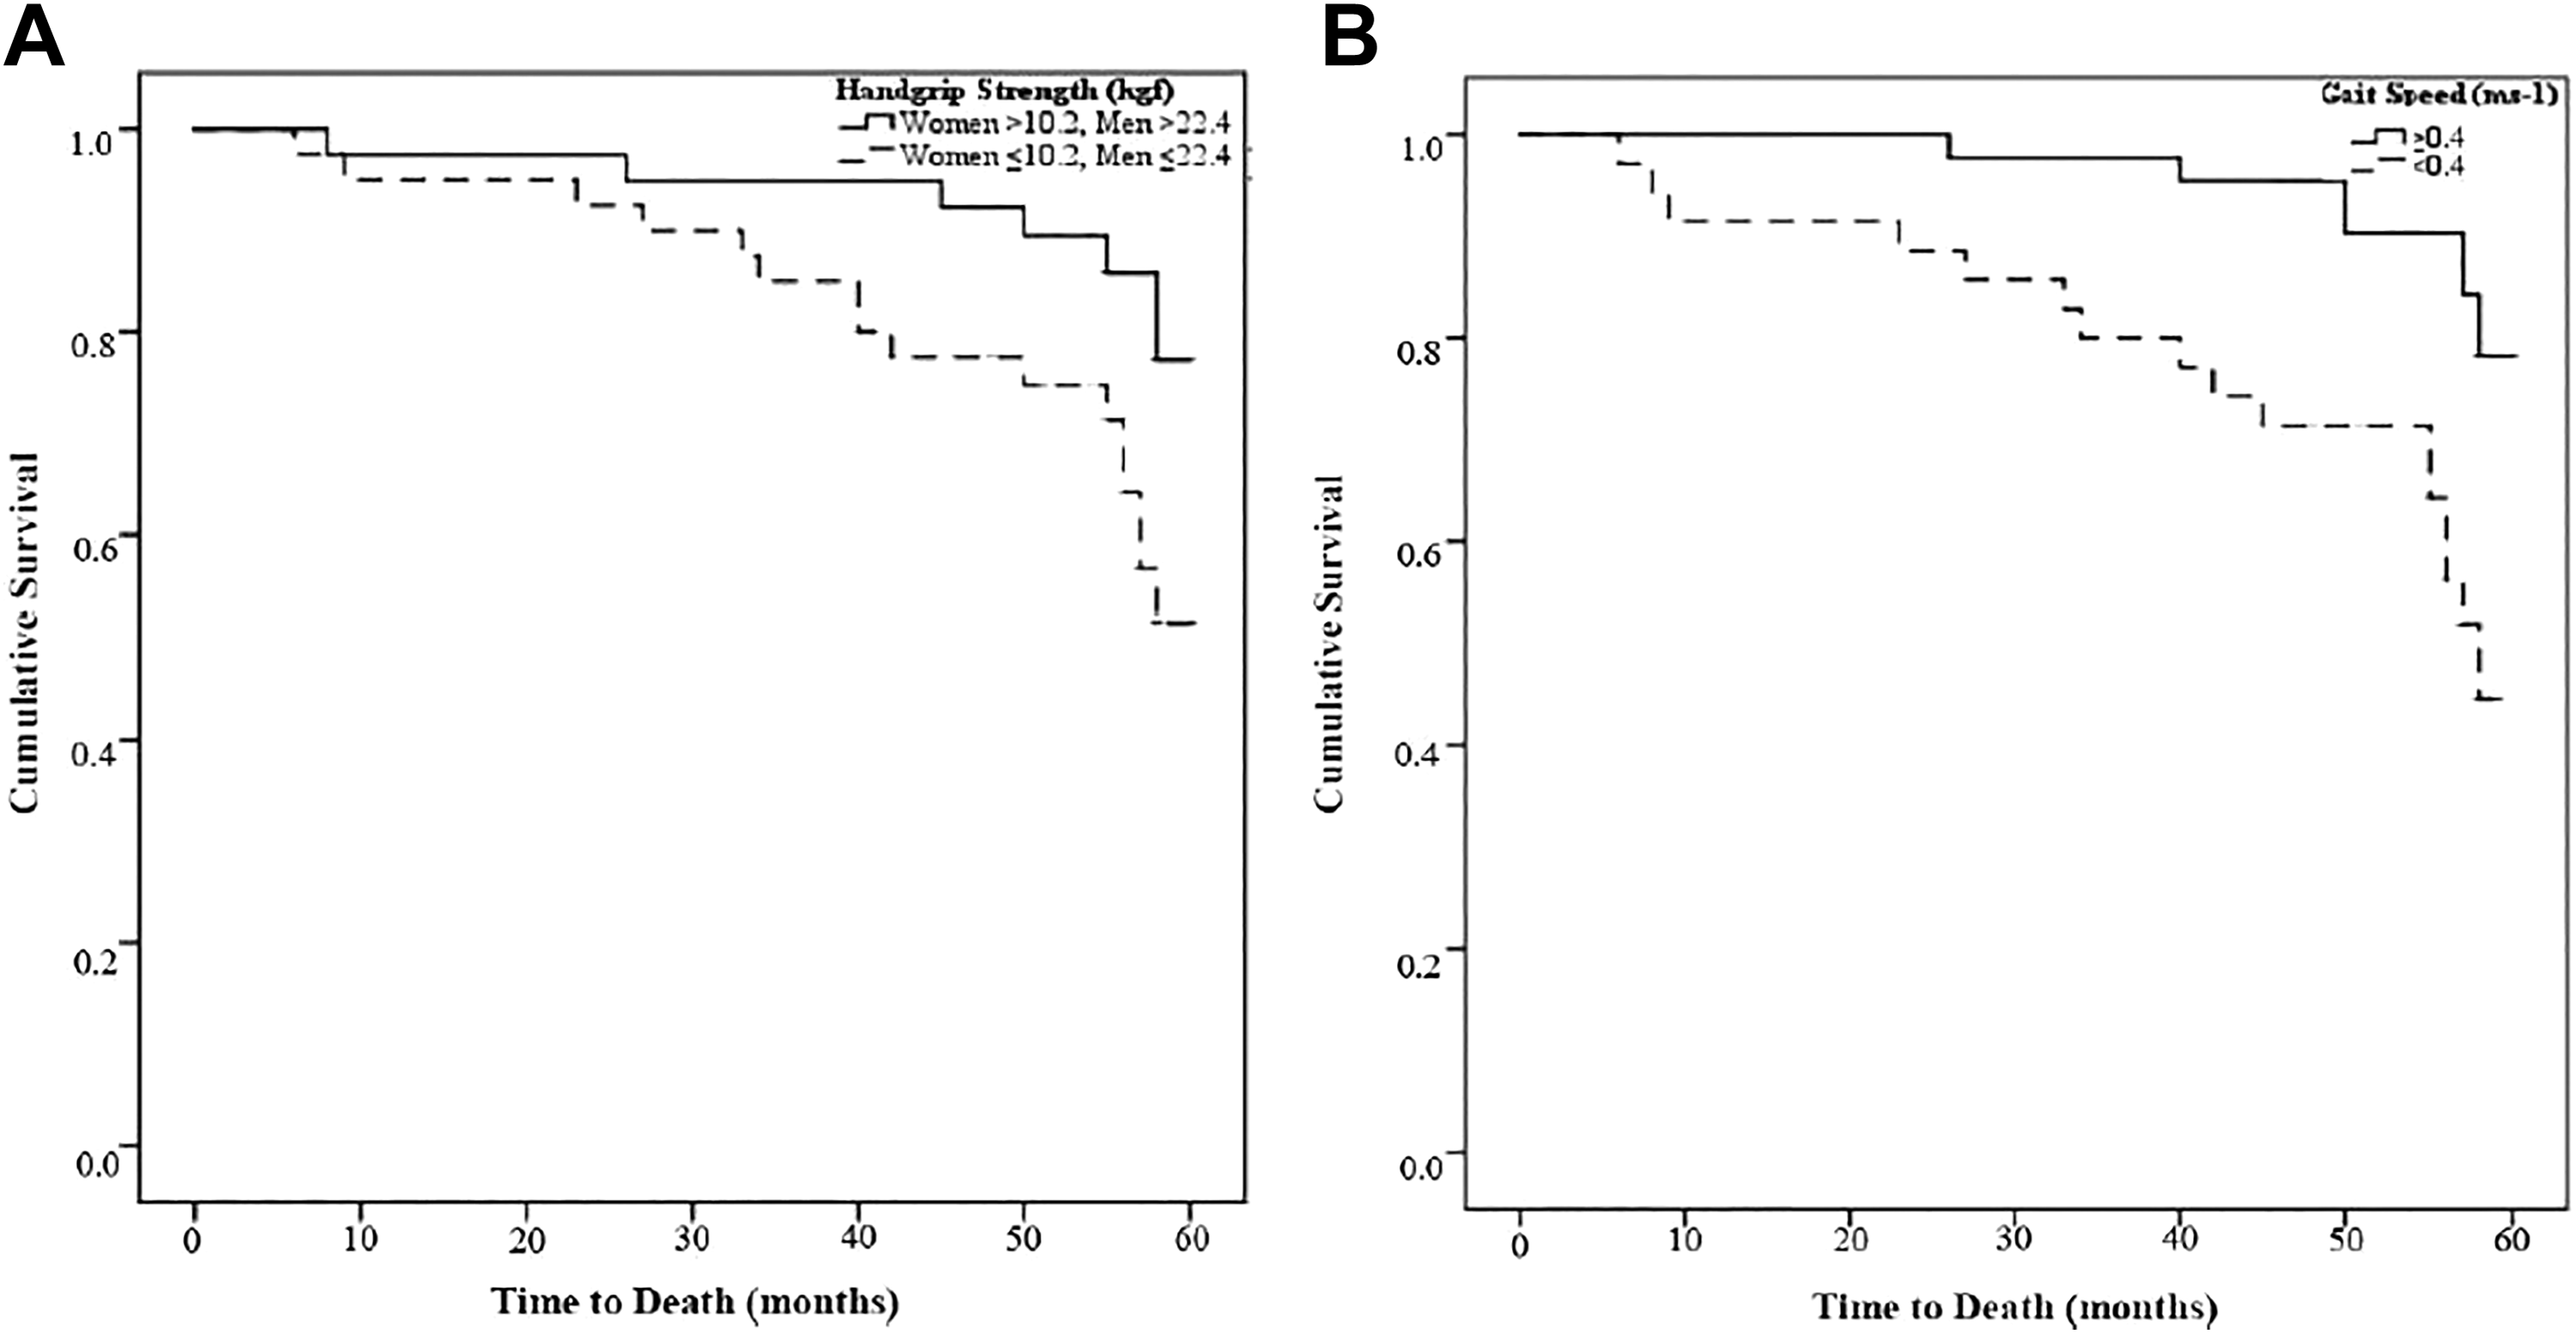
Kaplan–Meier estimates of cumulative survival of patients according to (A) handgrip strength categories (P = .034) and (B) gait speed cutoffs (P = .002). Higher values of cumulative survival represent a lower probability of death at a certain time point.
Bivariable and multivariable Cox proportional hazards regression models were carried out to assess how nutritional and functional status predicts survival time. Using crude (unadjusted) Cox proportional hazards model, those older adults who were undernourished (by MNA), underweight (by BMI), who presented weight loss above 3 kg during the last 3 months, those who had low values of mid-arm muscle and calf circumferences, and lower HGS and gait speed showed higher HR for mortality. Therefore, these parameters were used in the multivariable Cox analysis.
The results of multivariable Cox analysis confirmed bivariable analysis showing that participants presenting the worst nutritional and functional status indicators had a higher risk for mortality. Consequently, undernutrition identified through MNA, underweight by BMI, weight loss above 3 kg during the last 3 months, low values of mid-arm muscle and calf circumferences, HGS, and gait speed were consistently associated with higher HR for mortality, after adjusting for sex, age, marital status, education, and cognitive function (Table 3). The AIC values for Cox proportional hazards (Table 3) were close varying between 7.555 and 7.603.
Hazard Ratios for the Association of Nutritional and Functional Status Indicators and Mortality in 79 Community-Dwelling Older Adults With Mild-to-Moderate Alzheimer’s Disease Participating in a Prospective Cohort Study.a

Abbreviations: AIC, Akaike Information Criterion; CI, confidence interval; HR, hazard ratio.
aEach variable was adjusted for sex (categorical), age (categorical: 65-74; ≥75), marital status (categorical: single; nonsingle), education (categorical: >4; 0-4), and Mini Mental State Examination (categorical: >19; 10-19).
Discussion
Indicators of nutritional and functional status were associated with a higher risk of mortality among community-dwelling older adults with AD, according to this prospective study. The present results were independent of sex, age, marital status, education, and cognitive function.
The World Health Organization estimates that 50 million people worldwide are living with dementia, and there are nearly 10 million new cases every year. 44 In Europe, around 8.7 million people lived with dementia in 2012, including 182 526 Portuguese citizens. 45 Alzheimer’s disease is the most common form of dementia and may contribute to 60% to 70% of cases. 44 However, the main cause of death registered in patients with AD is often not related to the disease, but as an underlying or contributing cause. 46 The impact of nutritional and functional status on health and quality of life of older adults is well known, 47,48 and the present study reinforces this evidence showing nutritional and functional parameters as potential indicators of higher risk of mortality, with clinical relevance in older AD patients.
Although undernutrition may not be frequent in AD elderly living in the community, 8 several cases of risk of undernutrition evaluated by MNA were identified in community-dwelling patients with AD, ranging from 14% to 80% according to the literature study. 8 Primary factors that may contribute to undernutrition in patients with AD are disease-related factors, such as cognitive and behavioral disturbances, and taste and olfaction disorders. 49 Secondary factors may be the effects of medication and comorbidities. 49 Between 30% and 40% of older adults with mild-to-moderate AD experience a weight loss of 4% or more in a year. 50 In the present study, cases of undernutrition were associated with a higher risk of mortality, in comparison with cases of risk of undernutrition, according to the MNA.
The present study also demonstrated that weight loss was directly associated with mortality, while BMI was inversely associated with it, confirming previous evidence. 15 According to Luchsinger et al, 51 weight loss was associated with a higher risk of mortality among more than 1000 older adults with dementia from a cohort study. However, the presence of dementia does not seem to explain the association between low BMI and higher mortality in the elderly. 51 In non-dementia cases, underweight individuals (BMI < 18.5 kg/m2) also presented a significantly higher adjusted risk of all-cause mortality. On the other hand, overweight and obesity were associated with a lower risk of mortality in very old adults, revealing an obesity paradox. 52 In fact, Burman et al, 53 in a 5-year mortality study conducted in very old adults, demonstrated that association with mortality was linear for MNA, but not for BMI. Older adults with overweight (BMI 25.0-29.9 kg/m2) and class I obesity (BMI 30.0-34.9 kg/m2) also presented a lower risk of mortality in comparison to those classified in the reference range (BMI 18.5-24.9 kg/m2). 54 Regarding cases of dementia, Barreto et al 15 reported that the presence of dementia amplified the obesity paradox in a prospective study conducted in very older adults with dementia who were functionally limited and resided in care homes.
In relation to mid-arm muscle as well as calf circumferences, lower values were directly associated with mortality in the present study, which was in line with previous research. 55 This fact is possibly due to skeletal muscle mass being used as a nutritional reserve in response to negative energy balance during prolonged periods of disease; therefore, older adults with higher muscle mass tend to live longer. 56 Another finding observed in the present sample was that approximately one-half of participants (46%) had low PA and those with values below the 50th percentile presented an increased risk of mortality. Accordingly, a recent systematic review concluded that PA seems to be a good indicator of mortality in several clinical situations. 57
Regarding functional status, present results showed that lower baseline HGS and gait speed were both associated with an increased mortality over time. These results are in line with previous research that HGS and gait speed were reported as good predictors of functional disability, morbidity, and mortality in older adults. 58 According to the literature, a gait speed ≤0.8 m/s might be used to identify older adults with mobility impairment because this cutoff predicts disability and reduced overall survival. 59
The present study results revealed that worse nutritional and functional statuses were directly associated with a higher risk of mortality in community-dwelling older adults with mild-to-moderate AD. As nutritional and functional statuses are modifiable factors, the preservation of these conditions may contribute to prevent adverse outcomes related to the progression of dementia, improving life expectancy. Identifying the predictors of clinical outcomes in dementia may provide an avenue for intervention. As far as we are aware, this is the first prospective cohort study to quantify the association between a set of different parameters related to nutritional and functional performance and mortality over time, in community-dwelling older adults with mild-to-moderate AD. The present sample comprised patients undernourished or at nutritional risk. The identified associations would be stronger if the sample were to include nonundernourished patients. The Cox regression analysis of a multivariable model allowed to estimate this association independently of sex, age, marital status, education, and status of cognitive function.
Some limitations should be pointed out. First, the nutritional and functional measurements were collected in a specific time point of the disease, which may not have been the same for all participants. Second, the present sample was composed of a high proportion of participants at risk of undernutrition and undernourished, presenting extremely low values of PA and HGS, making difficult to compare the present results with those of patients in better nutritional and functional conditions. In future studies, an increase in sample size, factors such as socioeconomic status, and the cause of death should be considered to clarify these findings.
In conclusion, undernutrition, unintended weight loss and underweight, low values of mid-arm muscle and calf circumferences, as well low values of HGS and gait speed were directly associated with higher risk of death in community-dwelling older adults with mild-to-moderate AD, independently of sex, age, marital status, education, and status of cognitive function.
Footnotes
Acknowledgments
The authors are grateful to Dr António Leuschner, MD PhD, Director in Hospital of Magalhães Lemos E.P.E., in Porto, Portugal; Dra. Rosa Encarnação, BSc, Psychiatrics Geriatric Director, Psychogeriatric Unit in Hospital of Magalhães Lemos E.P.E., in Porto, Portugal, Dr João Freitas, MSc, Psychiatrics Geriatric, Psychogeriatric Unit in Hospital of Magalhães Lemos E.P.E., in Porto, Portugal; Dr Adriano Grammary, BSc, Psychiatrics Geriatric in Centro Hospitalar Conde de Ferreira, in Porto, Portugal; Margarida Sotto Mayor, PhD, Nurse Geriatric, Psychogeriatric Unit in Hospital of Magalhães Lemos E.P.E., in Porto, Portugal, and all collaborators for their contribution to the realization of this work.
Declaration of Conflicting Interests
The authors declared no potential conflicts of interest with respect to the research, authorship, and/or publication of this article.
Funding
The authors received no financial support for the research, authorship, and/or publication of this article.