
Abstract
Purpose:
Mild cognitive impairment (MCI) is considered to be the clinical transition stage between patients with cognitively intact geriatrics and Alzheimer’s disease (AD). When observed longitudinally, however, a certain proportion of patients with MCI are expected to revert to a cognitively intact state (MCI_R) while others either remain in the MCI state (MCI_S) or deteriorate into AD (MCI_P). It is worthwhile to investigate the divergence in the brain activities of these MCI groups with different post hoc labels.
Methods:
In this study, we employed the regional homogeneity (ReHo) measure to explore the characteristics of local brain activity in these MCI groups.
Results:
Compared to age-matched normal controls, our results exhibited that (1) in MCI_R group, ReHo index showed an increase in the left insula and a decrease in the left superior temporal gyrus; (2) in MCI_S group, ReHo index increased in the left orbital part of the inferior frontal gyrus (IFG_orb) and decreased in the left inferior parietal lobe; and (3) in MCI_P group, ReHo index elevated in the left IFG_orb and decreased in the left putamen.
Conclusions:
The distinct ReHo changes in the individual MCI groups indicated a potential evidence for differentially active interventions for a specific patient with MCI.
Keywords
Introduction
Alzheimer’s disease (AD) is the most common form of dementia in elderly people. It is a major neurodegenerative dysfunction characterized by cognitive and intellectual deficits and behavioral impairments, which gradually destroys a patient’s memory, communication skills, and the ability to carry out daily activities. 1,2 Mild cognitive impairment (MCI) is considered to be the clinical transition stage between cognitively intact elderly individuals and individuals with dementia, and it is also thought to present a higher risk of deterioration to AD. 3 -5 When observed longitudinally, however, a certain proportion of patients with MCI are expected to revert to a cognitively intact state while others remain in the MCI state or deteriorate into AD. These deviations in patients with MCI, such as the divergence in brain activities, may provide potentially useful information for predicting the prognosis of a certain patient and may also benefit the early detection of AD.
Fox and Raichle 6 reviewed that spontaneous neural activity reflects brain function at the macroscale during resting state. Owing to the development of medical radiographic tools, it has been proved effective to investigate brain function through various imaging techniques. Coherent spontaneous low-frequency fluctuations in 0.01 to 0.08 Hz in the blood oxygen level-dependent (BOLD) signal are thought to reflect gross cortical excitability and neuronal synchronization 7,8 and, more importantly, play a key role in maintaining unremitting, internal representations in the coding of cognition during resting state. 9 Regional homogeneity (ReHo) in BOLD signals, quantified by intracluster information similarity, has been proved highly reliable (test–retest) in measuring brain activity, thus serving as a valuable imaging feature for exploring related pathological changes. 10,11 Moreover, the existing researches indicated that ReHo indices are significantly altered between patients with AD/MCI and normal controls (NCs). 12 -15 For example, He et al 13 reported that patients with AD showed significant decreases and increases in ReHo values in several temporal and parietal regions in contrast with NC. Recently, Zhang et al 14 discovered altered brain spontaneous activations in the prefrontal cortex and left inferior parietal lobe in both MCI and AD. Later, Liu et al 15 found that there was a reduction of ReHo indices in several regions of the default mode network (DMN) in patients with AD/MCI.
The MCI is a progressive and unstable state. Differences in ReHo characteristics have been less studied in this population but may act as potential biomarkers of prognosis. In this study, we hypothesized that ReHo characteristics would show difference in various groups of progressive patients with MCI.
Materials and Methods
Overview of AD Neuroimaging Initiative
Data used in the preparation of this article were obtained from the Alzheimer’s Disease Neuroimaging Initiative (ADNI) database (http://adni.loni.usc.edu). The ADNI was launched in 2003 by the National Institute on Aging, the National Institute of Biomedical Imaging and Bioengineering, the Food and Drug Administration, and private pharmaceutical companies and nonprofit organizations, as a 60 million USD, 5-year public–private partnership. The primary goal of ADNI has been to test whether serial magnetic resonance imaging (MRI), positron emission tomography, other biological markers, and clinical and neuropsychological assessment can be combined to measure the progression of MCI and early AD. For more information, visit http://www.adni-info.org.
Ethical Approval
We confirmed that all methods were carried out in accordance with ADNI’s guidelines and regulations, and we also confirmed that all experimental protocols were approved by the ADNI institutional committee in which the ethical standards of the institutional and national research committee are according to the 1964 Helsinki Declaration and its later amendments. Informed consent was obtained from all participants (http://www.adni-info.org). We also complied with ADNI’s requirement to “submit all manuscripts to the ADNI Database and Publications Committee prior to submitting to a journal.”
Participants
In this study, we selected 3 kinds of participants with MCI from the whole ADNI database, that is, (1) patients with MCI who reverted to a cognitively intact state and maintained the cognitively intact condition over the following 2 years (MCI_R); (2) patients with MCI who maintained a stable MCI state over the following 2 years (MCI_S); and (3) patients with MCI who deteriorated into AD and maintained in the AD state over the following 2 years (MCI_P). After filtering, there are 36 MCI who progressed to AD and 21 MCI who reversed to normal state when we sought the whole ADNI database. Figure 1 is a flowchart depicting the selection process of participants with MCI, and Table 1 is an example of how to select images of participants with MCI. In addition, we selected 56 age-matched participants as the NC group. All participants are right handedness. As a result, there were 166 participants (53 MCI_S, 36 MCI_P, 21 MCI_R, and 56 NC) who met these selection criteria. Also, all participants completed a neuropsychological test battery that included the Mini-Mental State Examination (MMSE) and clinical dementia rate (CDR). 16 General participant inclusion criteria for our experiment from the ADNI database were as follows: (1) NCs: individuals who were cognitively normal and had no neurological disorders (a CDR of 0; MMSE scores between 27 and 30); (2) participants with MCI: people with MCI who were identical to the criteria used by Petersen et al 17 and showed memory difficulties and had a slight cognitive function deficit (a CDR of 0.5, MMSE scores between 22 and 30).
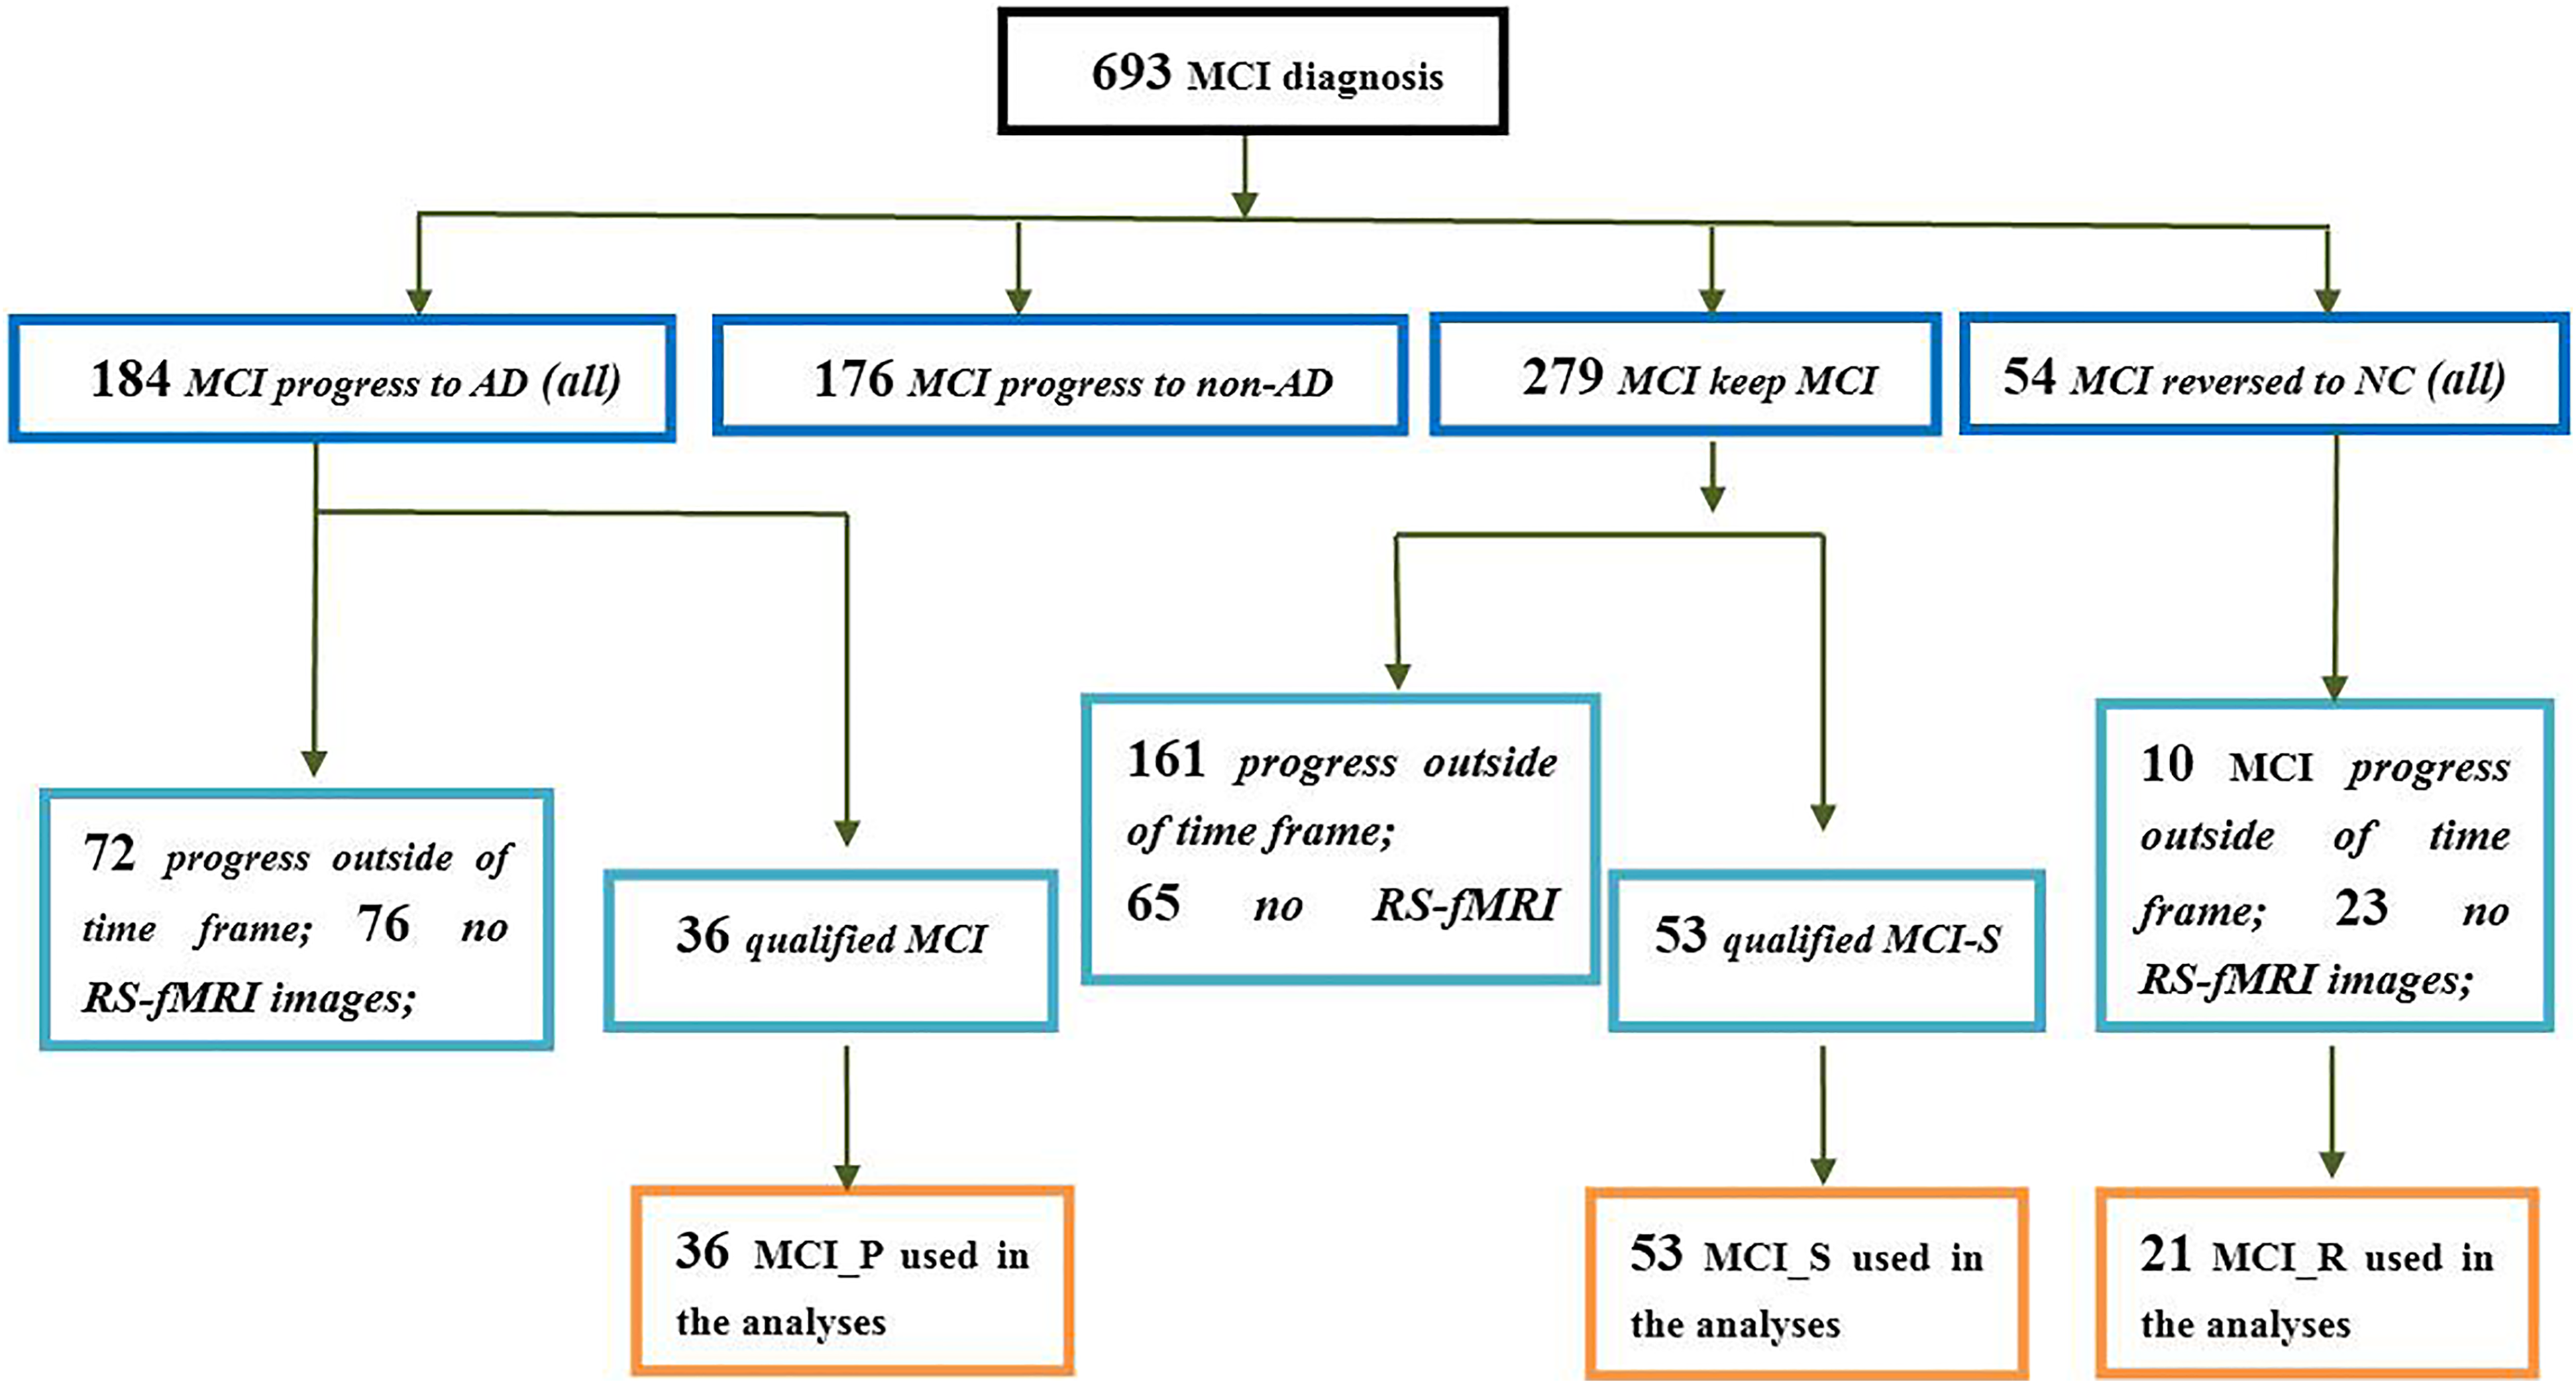
A flowchart depicting the MCI data selection process. AD indicates Alzheimer’s disease; MCI, mild cognitive impairment; MCI_P, patients with MCI progressed to AD and stabilized in the AD state in 24 months; MCI_R, patients with MCI reversed to NC state and stabilized in the NC state in 24 months; MCI_S, patients with MCI stabilized in the MCI state in 24 months; NC, normal control.
Example of How to Select the Images of Participants With MCI.a
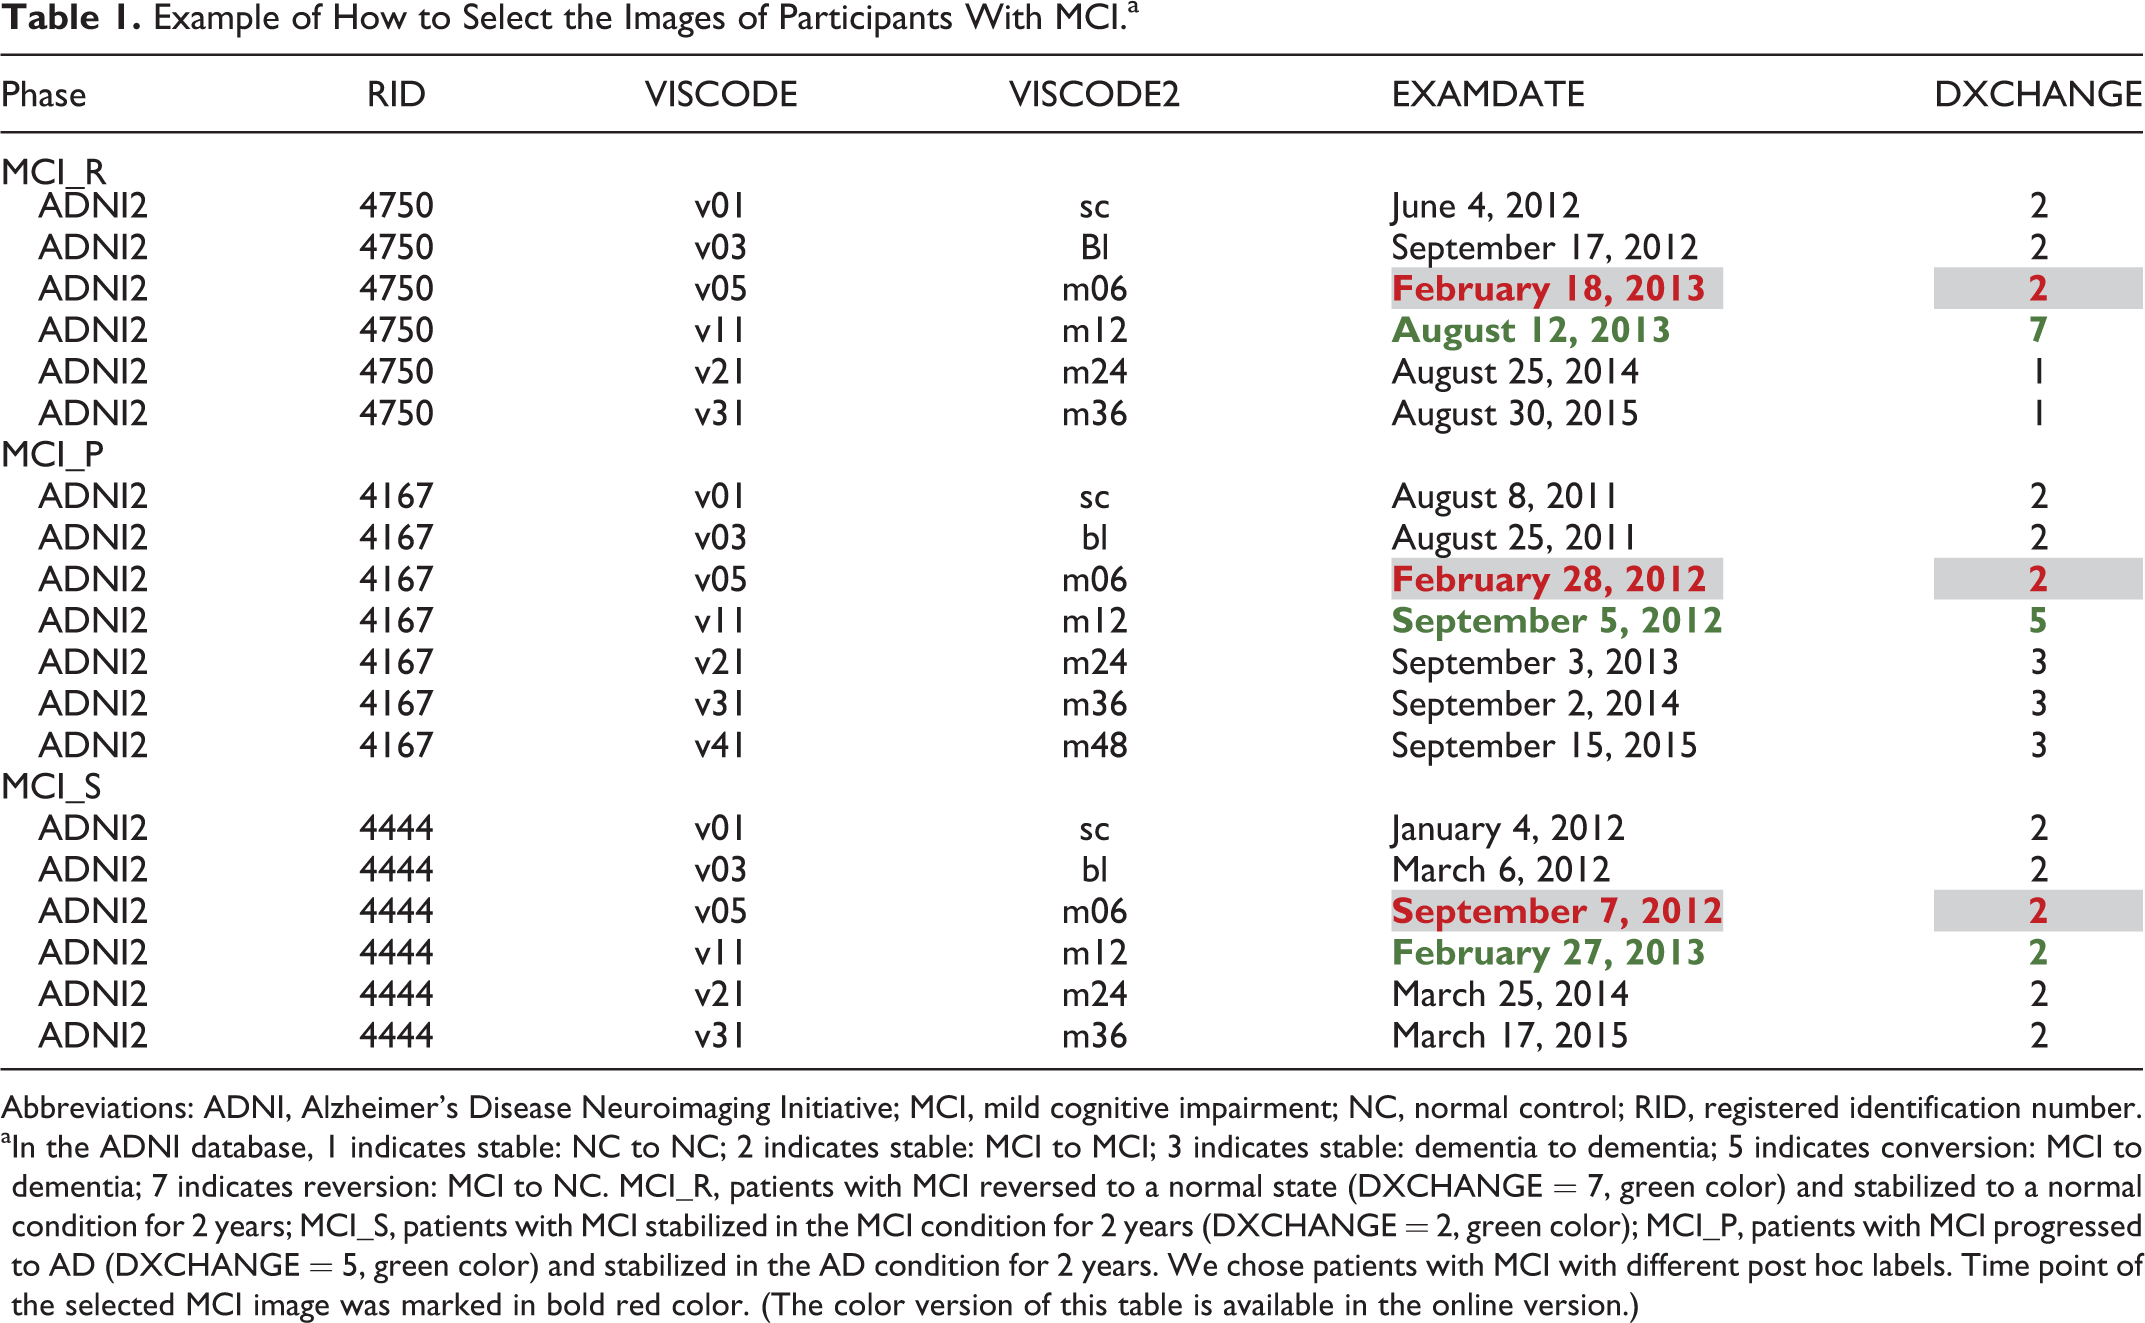
Abbreviations: ADNI, Alzheimer’s Disease Neuroimaging Initiative; MCI, mild cognitive impairment; NC, normal control; RID, registered identification number.
aIn the ADNI database, 1 indicates stable: NC to NC; 2 indicates stable: MCI to MCI; 3 indicates stable: dementia to dementia; 5 indicates conversion: MCI to dementia; 7 indicates reversion: MCI to NC. MCI_R, patients with MCI reversed to a normal state (DXCHANGE = 7, green color) and stabilized to a normal condition for 2 years; MCI_S, patients with MCI stabilized in the MCI condition for 2 years (DXCHANGE = 2, green color); MCI_P, patients with MCI progressed to AD (DXCHANGE = 5, green color) and stabilized in the AD condition for 2 years. We chose patients with MCI with different post hoc labels. Time point of the selected MCI image was marked in bold red color. (The color version of this table is available in the online version.)
Among them, 11 participants were excluded (1 MCI_R, 3 MCI_S, 4 MCI_P, and 3 NC) due to a significant head motion problem (see “Data Preprocessing” section). Finally, there were 20 MCI_R, 50 MCI_S, 32 MCI_P, and 53 NCs used in this study. Detailed information for the remaining participants is shown in Table 2.
Demographic and Clinical Data in 3 MCI Groups and Normal Controls.a
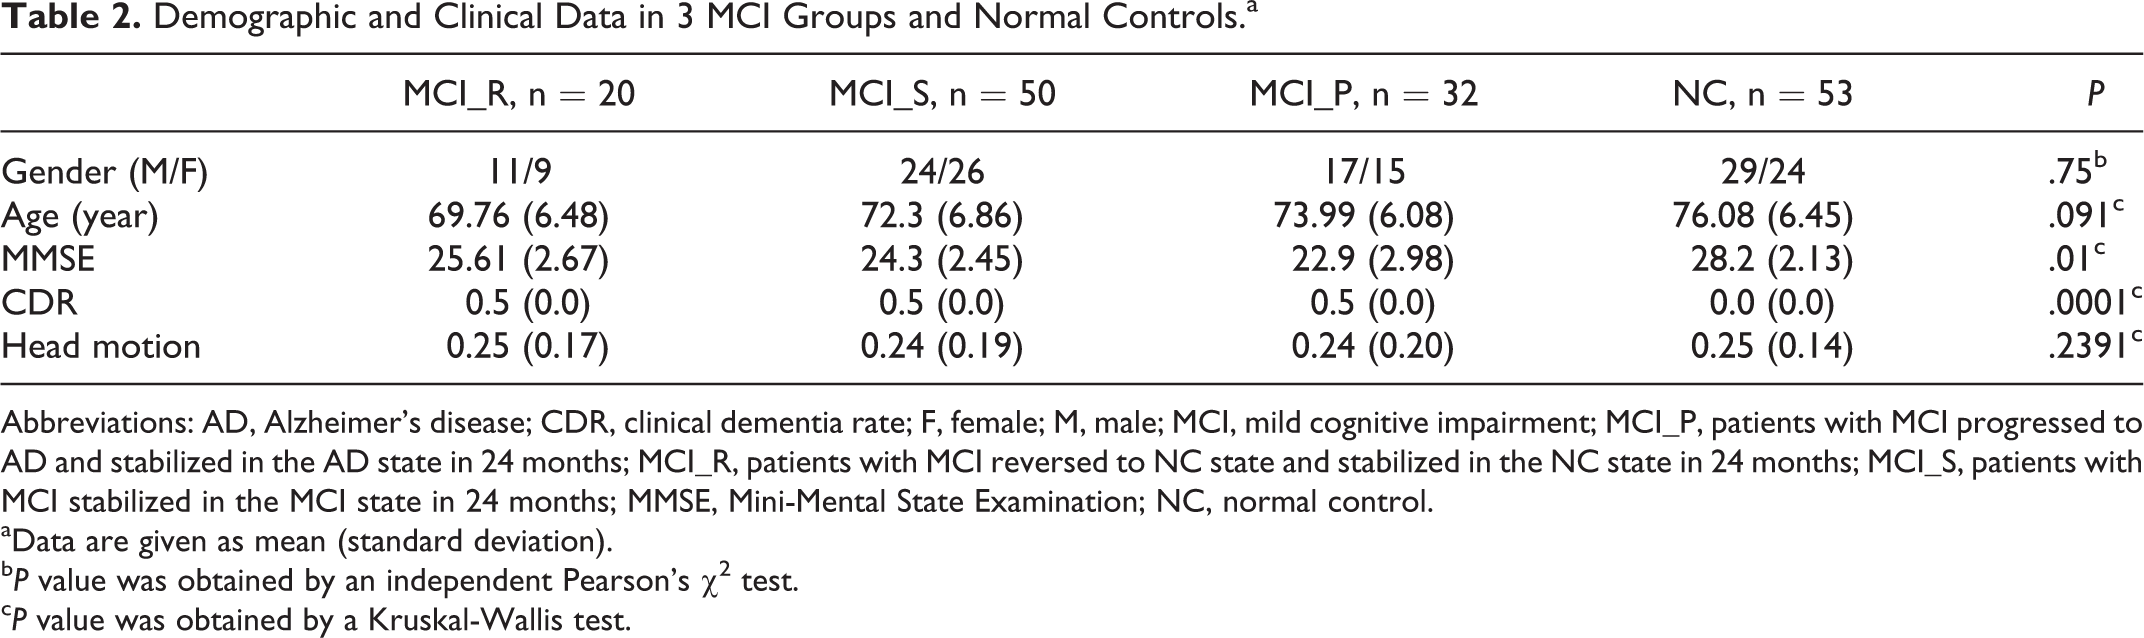
Abbreviations: AD, Alzheimer’s disease; CDR, clinical dementia rate; F, female; M, male; MCI, mild cognitive impairment; MCI_P, patients with MCI progressed to AD and stabilized in the AD state in 24 months; MCI_R, patients with MCI reversed to NC state and stabilized in the NC state in 24 months; MCI_S, patients with MCI stabilized in the MCI state in 24 months; MMSE, Mini-Mental State Examination; NC, normal control.
aData are given as mean (standard deviation).
bP value was obtained by an independent Pearson’s χ2 test.
cP value was obtained by a Kruskal-Wallis test.
Data Acquisition
The raw Digital Imaging and Communications in Medicine resting-state functional MRI (RS-fMRI) of patients with MCI who have not yet transformed to the other states (AD, NC, and stable MCI) were acquired with a 3.0-T MRI scanner. The resting-state functional MRI scans were carried out by an echo-planar imaging (EPI) sequence, 18 and data parameters were as follows: time points = 140, repetition time = 3 seconds, echo time = 30 milliseconds, flip angle = 80°, slices = 48, thickness = 3.3 mm, spatial resolution = 3 mm × 3 mm × 3 mm, and matrix = 64 × 64. The data information is similar to our previous studies. 19,20 None of the participants was taking any medications at the time of the experiment. During the fMRI scans, all participants were instructed to keep their eyes closed and relax.
Data Preprocessing
All functional data preprocessing was carried out using Data Processing Assistant for RS-fMRI, 21 which is based on Statistical Parametric Mapping-12 and RS-fMRI Data Analysis Toolkit 22 functions. In the beginning, the first 10 time series were discarded from the analysis to allow for equilibration of the magnetic field and for the adaptation of the participants to fMRI scanning noise. The remaining 130 volumes were corrected for the acquisition time delay between different images and were also corrected for displacements according to estimated head motion parameters and then were realigned to the first volume for each participant. Detailed head motion parameters were calculated by estimating any one of the dimensions and any one of the angular rotations. So when any participant had head motion exceeding 1.5 mm in any direction (x, y, z) or 1.5° in any angular motion, these were excluded from the next analysis. Then, all data were spatially normalized to the standard EPI template and resampled to a voxel size of 3 mm × 3 mm × 3 mm. After that, we removed the linear drift to wipe out any residual effects of motion. Finally, a Friston-24 parameter 23,24 and the average time series in the cerebrospinal fluid, white matter, and global signal were regressed as nuisance covariates for the subsequent analysis. Then, after computing ReHo values, we used a 6-mm full width at half maximum to smooth each volume to reduce the signal noise.
In addition, head motion (even if small) can bias derived results in groups where there are motion differences. 25 In order to examine whether there are any differences in head motion among the 4 groups and between each group pair, we extracted the head motion information of each participant in the 4 groups. Then, we tested the group differences in head motion following those in Power et al’s study and found that there were no significant differences in head motion between the 4 groups (Table 2).
Regional Homogeneity Measure and Statistical Analysis
The ReHo method offers a fast method to map the functional coherence of a given voxel with its nearest neighbors and can be used to assess RS brain activities. 10 It is based on the hypothesis that significant brain activities would likely occur in clusters instead of a single voxel. Briefly, the ReHo index is computed using Kendall’s coefficient of concordance, 26 and its values are between 0 and 1. Larger ReHo values indicated a larger degree of similarity of the given voxel with its nearest neighbors. Thus, every participant would obtain an ReHo map during rest. At last, we normalized each voxel’s ReHo value by dividing the whole brain’s mean ReHo 27,28 (ReHonormalized = ReHo (x, y, z)/mean (ReHo)) to reduce the influence of individual variability.
At the same time, we did a 1-sample t test in a voxel-wise mode. In those 3 MCI groups, a single voxel threshold value of P < .01 and a cluster size of at least 40 continuous voxels were used to correct for multiple comparisons. Then, we generated a corrected threshold of P < .01 in these groups, as determined by the Monte Carlo simulation (see program α-sim by D. Ward in the AFNI program. Parameters were individual voxel P value = .01, Full width at half maximum = 6 mm with gray matter mask).
A 1-way analysis of variance (ANOVA) with age and gender as covariates was performed at each voxel to determine the differences among the MCI_R, MCI_S, MCI_P, and control group. The statistical maps were then set using P < .05 for each voxel, and a cluster size of at least 40 voxels resulting in a corrected threshold of P < .01 was based on Monte Carlo simulations. Subsequently, all ReHo values were used for a post hoc analysis.
In the current study, we reformed our hypothesis as follows: ReHo is different between each of the 3 progressive MCI groups and the control group. In order to investigate the differentiated ReHo characteristics in progressive MCI, statistical comparisons of the mean-fitted ReHo values between each pair of groups were conducted using a random-effects 2-sample t test 29 with age and gender as covariates. We applied the false discovery rate (FDR) to correct the multiple comparisons (P < .01, FDR correction). This enabled the identification of significant changes in ReHo in the MCI groups.
Finally, we also compared the ReHo values within the 3 progressive MCI groups and expected to obtain some additional findings which might help to explain the regional changes better. Three MCI groups comparison were conducted using a random-effects 2-sample t test with age and gender as covariates. Similarly, we applied the FDR to correct the multiple comparisons (P < .01, FDR correction).
Correlations Between ReHo Values and Clinical Data in Progressive MCI Groups
In order to evaluate the relationship between differences in brain regional activity and clinical data in patients with MCI, we computed the correlations of the fitted ReHo index of the identified regions with the MMSE scores of each participant with MCI. Spearman rank-order correlation was introduced and the significance levels were set at P < .01 (2-tailed, FDR correction).
Results
The demographic characteristics of MCI_S, MCI_R, MCI_P, and NC groups are shown in Table 2. There were no significant differences in gender, age, and head motion; there were significant differences in MMSE scores and CDR between MCI groups and the control group.
Within-Group and Between-Group ReHo Analyses
Figure 2 shows the mean ReHo maps within each group and the 1-way ANOVA analysis among the 4 groups. Visual inspection indicated that mean ReHo maps of the 3 MCI groups were different from those of the control group. The different brain regions were mainly located in the superior temporal gyrus (STG), middle temporal gyrus, inferior frontal gyrus (IFG), hippocampus, inferior parietal lobule (IPL), putamen, and cingulate gyrus.
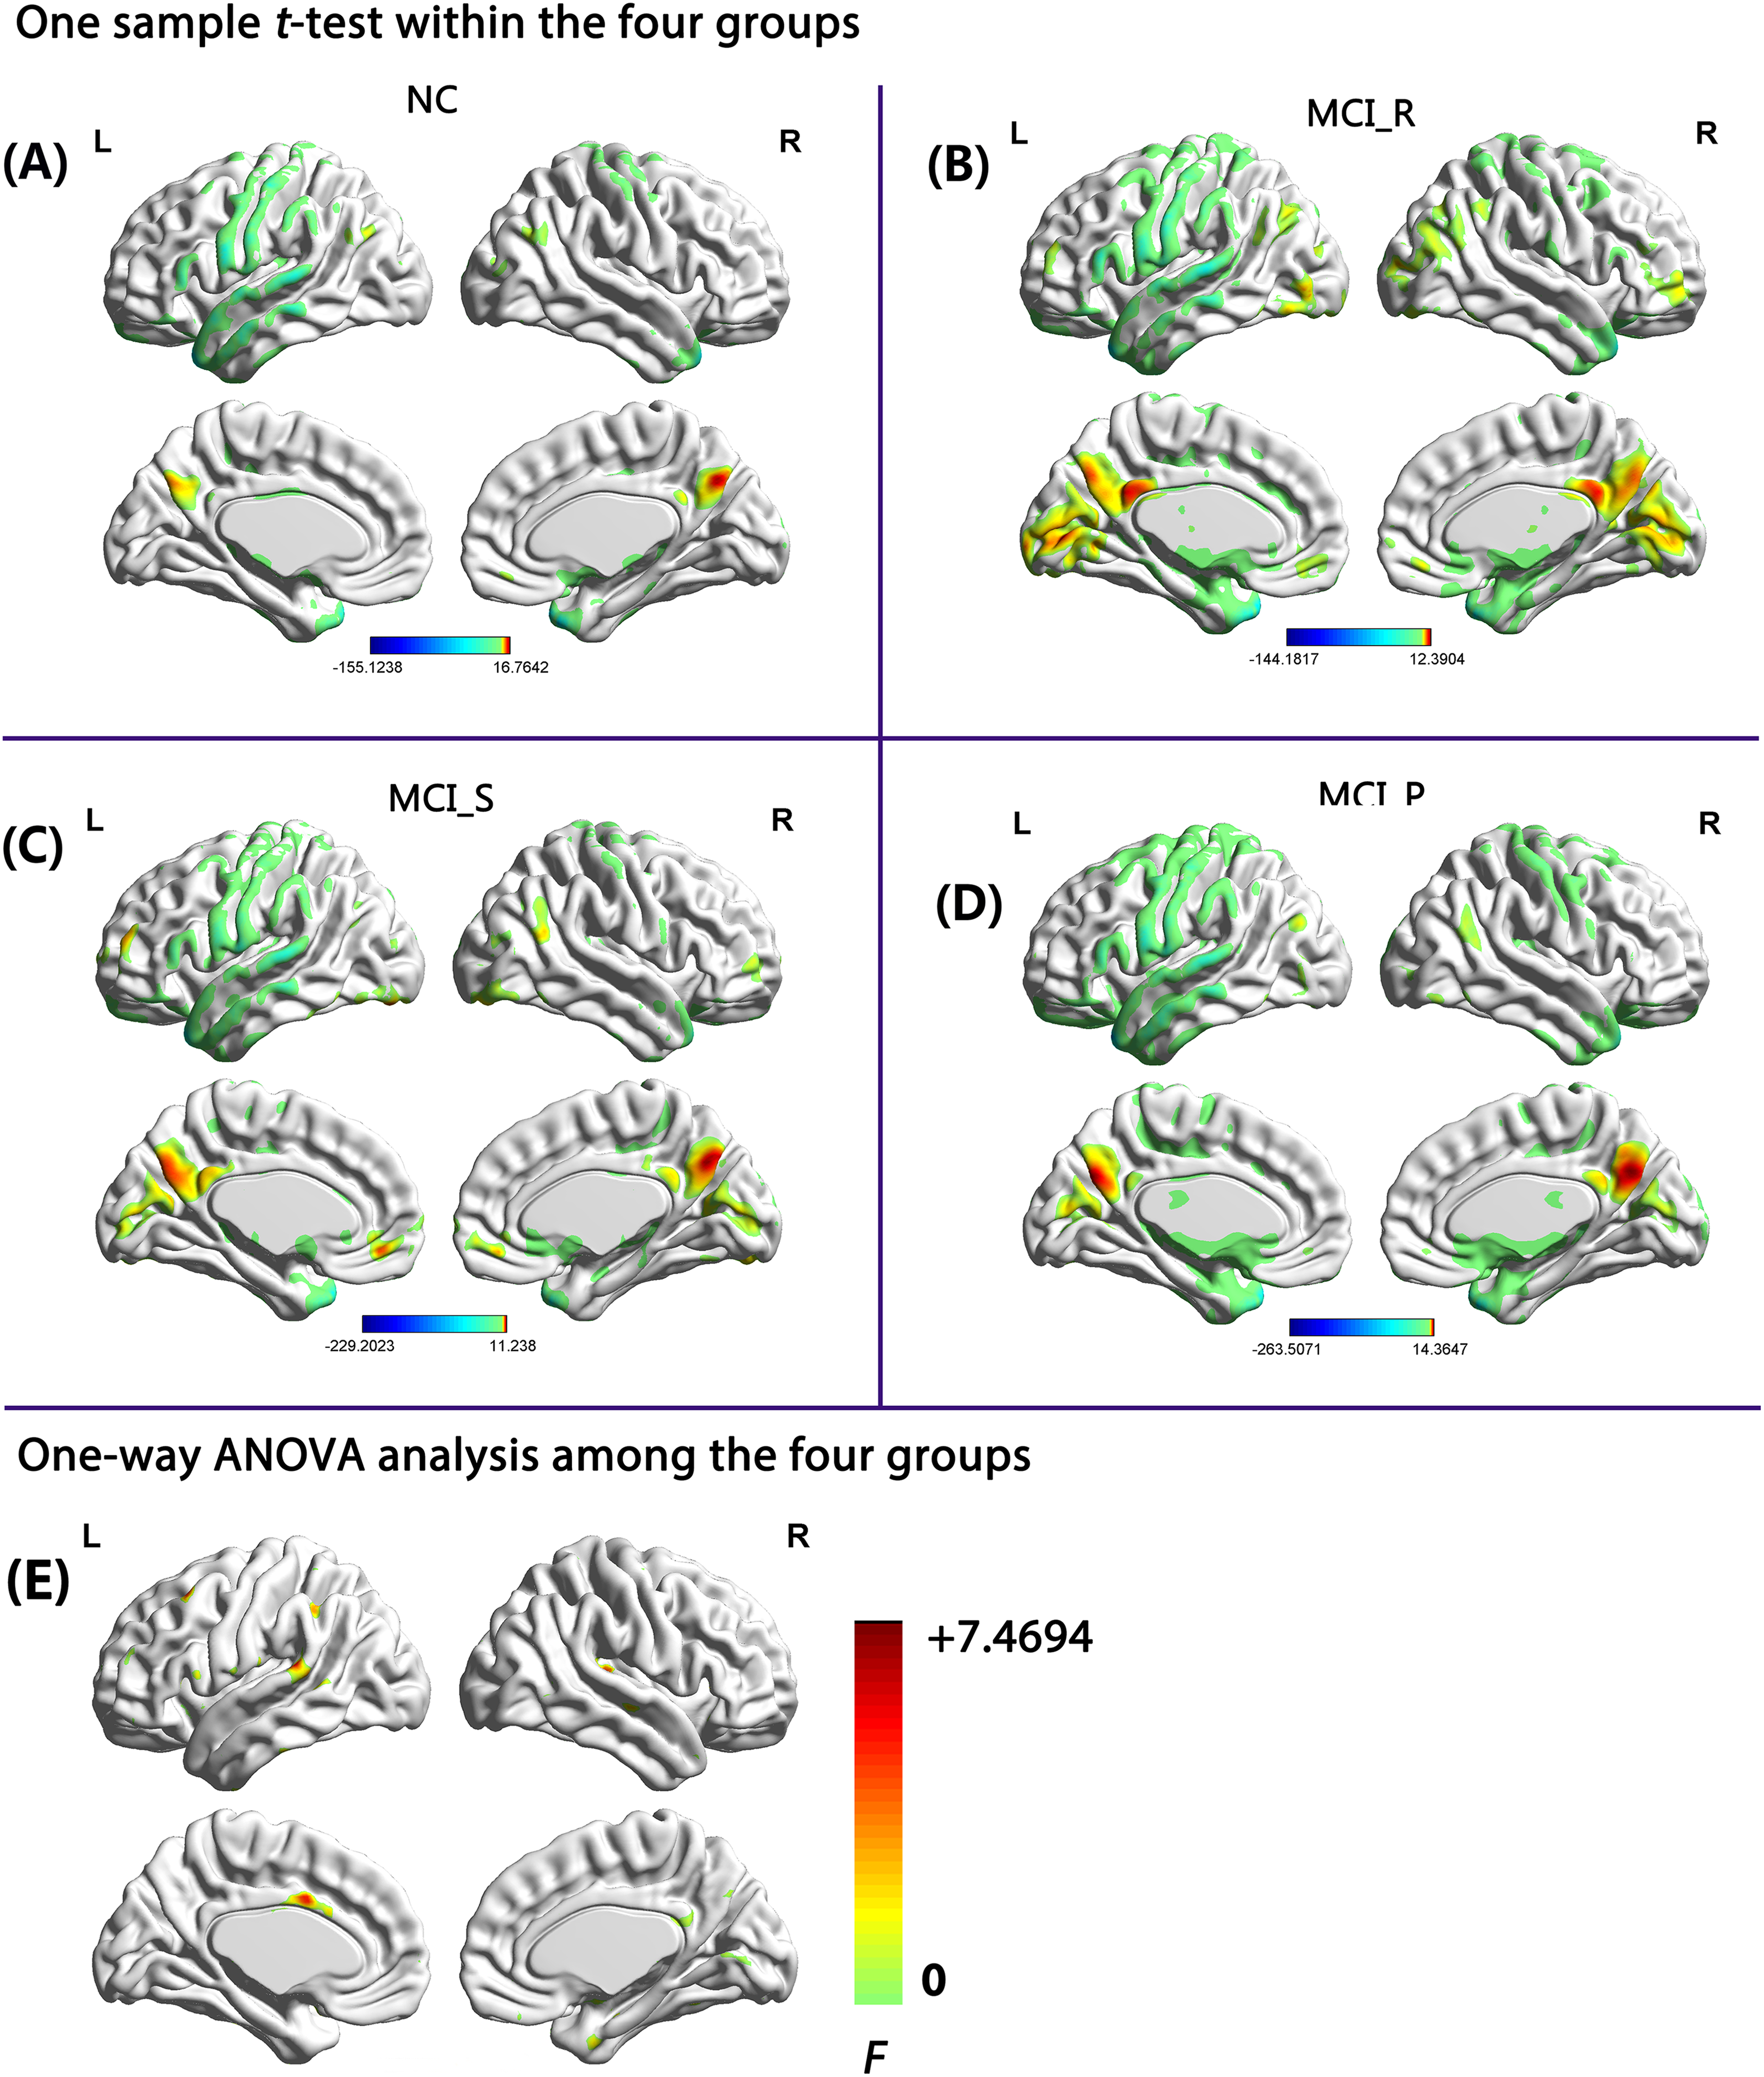
Mean ReHo maps within each group and the 1-way ANOVA analysis among the 4 groups (P < .01, 40 voxels, α-sim corrected), 1-sample t test in (A) NC group, (B) MCI_R group, (C) MCI_S group, and (D) MCI_P group; 1-way ANOVA analysis among the 4 groups (E). AD indicates Alzheimer’s disease; ANOVA, analysis of variance; L, left side; MCI, mild cognitive impairment; MCI_P, patients with MCI progressed to AD and stabilized in the AD state in 24 months; MCI_R, patients with MCI reversed to NC state and stabilized in the NC state in 24 months; MCI_S, patients with MCI stabilized in the MCI state in 24 months; NC, normal control; R, right side; ReHo, regional homogeneity.
The detailed differences were derived from a 2-sample t test (P < .01, FDR correction). Compared to the control group, we observed that (1) the MCI_R group showed significant increases of ReHo values in the left insula and decreased values in the left STG (Figure 3A, Table 3); (2) the MCI_S group showed significant increases of ReHo values in the orbital part of the IFG (IFG_orb) and decreased values in the left IPL (Figure 3B, Table 3); and (3) the MCI_P group showed significant increases of ReHo values in the left/right IFG_orb and decreases in the left middle cingulate cortex (MCC) and left putamen (Figure 3C, Table 3).
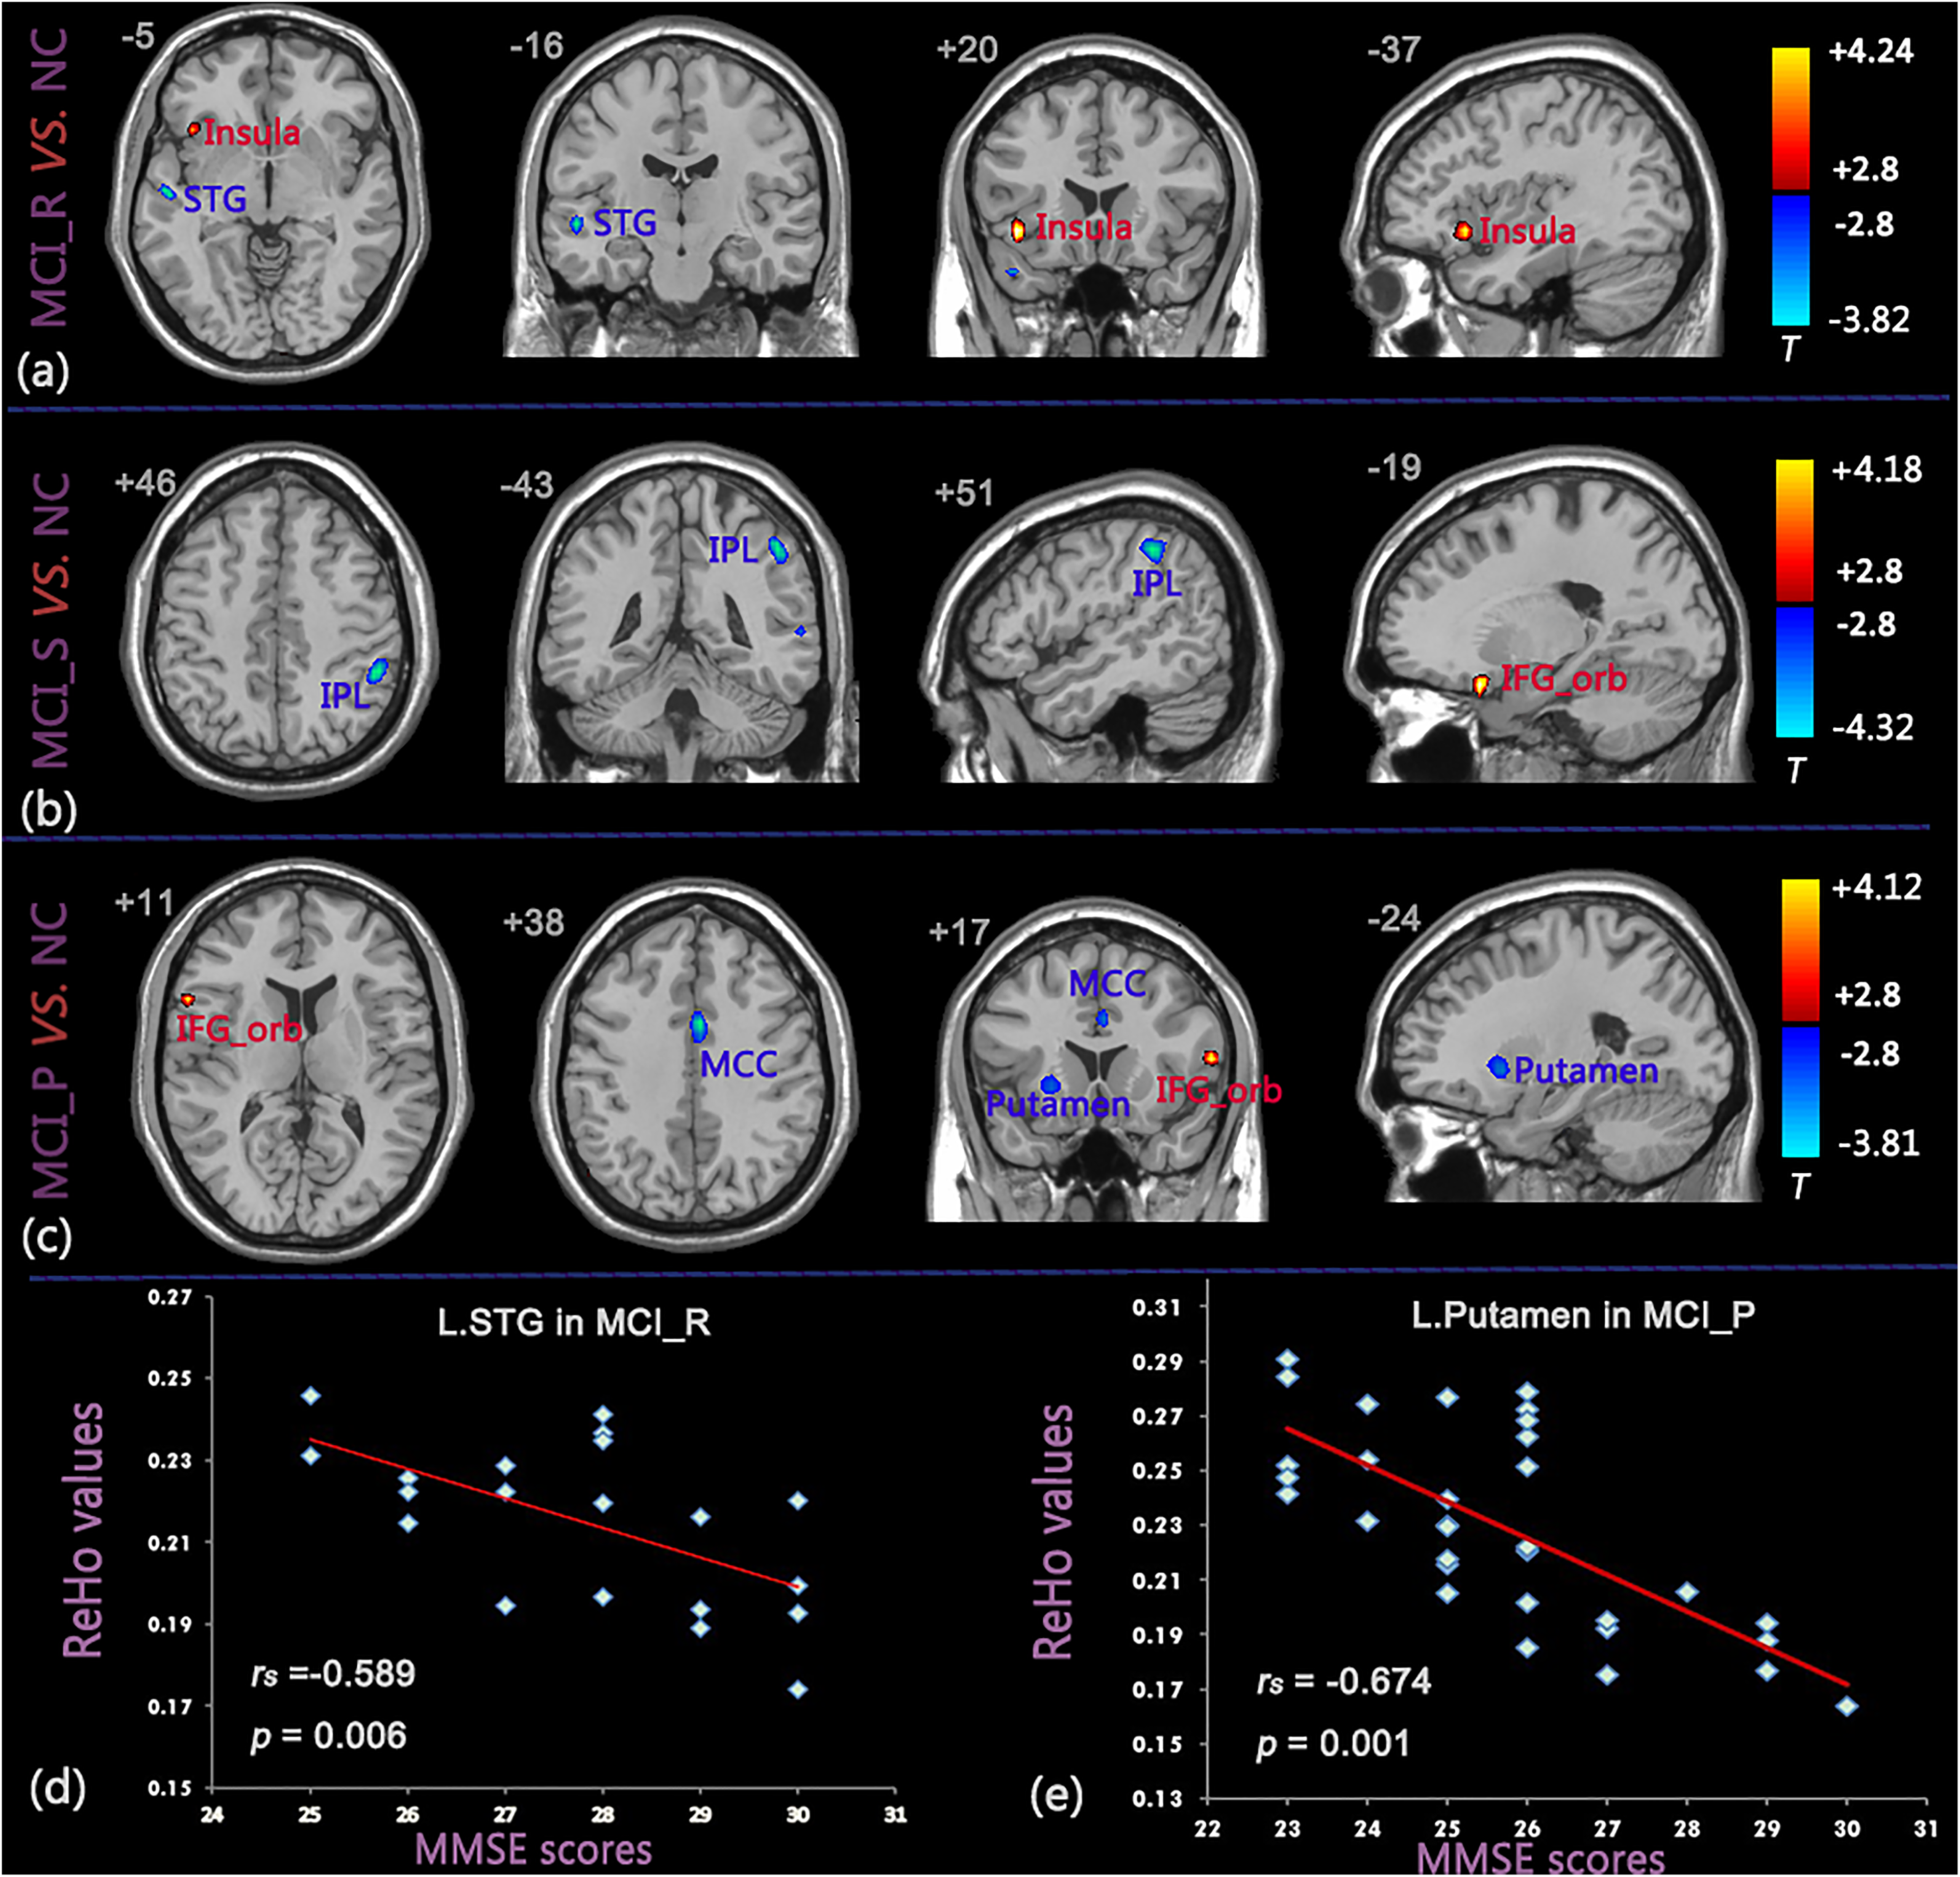
Brain areas showing significant differences in ReHo values between the 3 MCI groups and NC group and correlation diagram between ReHo values and MMSE scores (P < .01, FDR corrected). (A) MCI_R versus NC, (B) MCI_S versus NC, (C) MCI_P versus NC, (D) correlation between ReHo values of the left STG and MMSE scores in MCI_R group, (E) correlation between ReHo values of the left putamen and MMSE scores in MCI_P group. The red color represents increased ReHo values and blue color represents decreased ReHo values. AD indicates Alzheimer’s disease; FDR, false discovery rate; MCI, mild cognitive impairment; MCI_P, patients with MCI progressed to AD and stabilized in the AD state in 24 months; MCI_R, patients with MCI reversed to NC state and stabilized in the NC state in 24 months; MCI_S, patients with MCI stabilized in the MCI state in 24 months; MMSE, Mini-Mental State Examination; NC, normal control; ReHo, regional homogeneity; STG, superior temporal gyrus.
Significant Differences in ReHo Between Progressive MCI and NC Group (P < .01, FDR Corrected) of Brain Regions.a
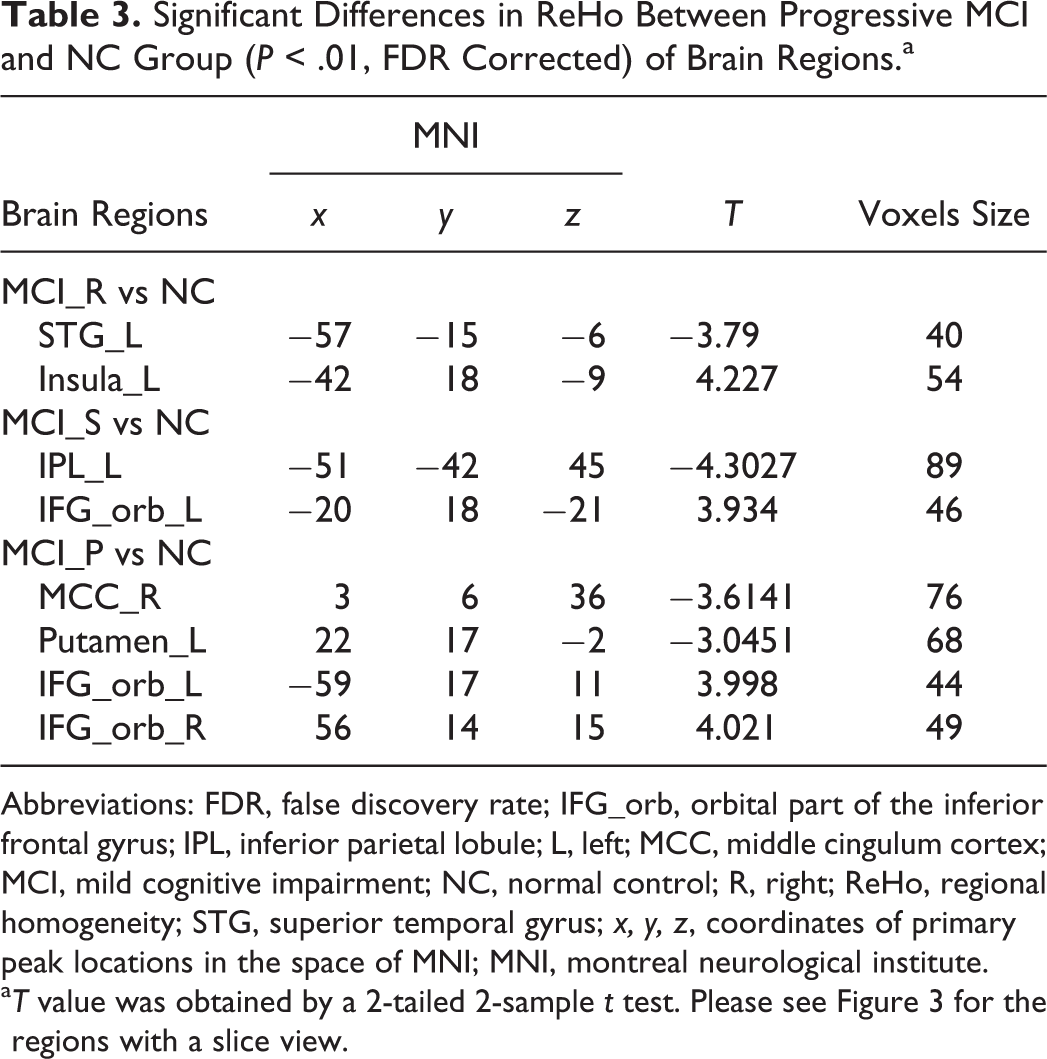
Abbreviations: FDR, false discovery rate; IFG_orb, orbital part of the inferior frontal gyrus; IPL, inferior parietal lobule; L, left; MCC, middle cingulum cortex; MCI, mild cognitive impairment; NC, normal control; R, right; ReHo, regional homogeneity; STG, superior temporal gyrus; x, y, z, coordinates of primary peak locations in the space of MNI; MNI, montreal neurological institute.
aT value was obtained by a 2-tailed 2-sample t test. Please see Figure 3 for the regions with a slice view.
Differences within 3 MCI groups were as follows: (1) compared to the MCI_R group, MCI_S group showed significant increased ReHo values in the left parahippocampal gyrus and decreased values in the left/right lingual gyrus (LING; Figure 4A, Table 4); (2) compared to the MCI_P group, MCI_S group exhibited significant increased ReHo values in the right MCC and decreased values in the right IPL (Figure 4B, Table 4); and (3) compared to the MCI_P group, MCI_R group had significant increased ReHo values in the left posterior cingulum cortex (PCC), postcentral gyrus, rolandic operculum (rolandic_oper), and IFG_orb (Figure 4C, Table 4).
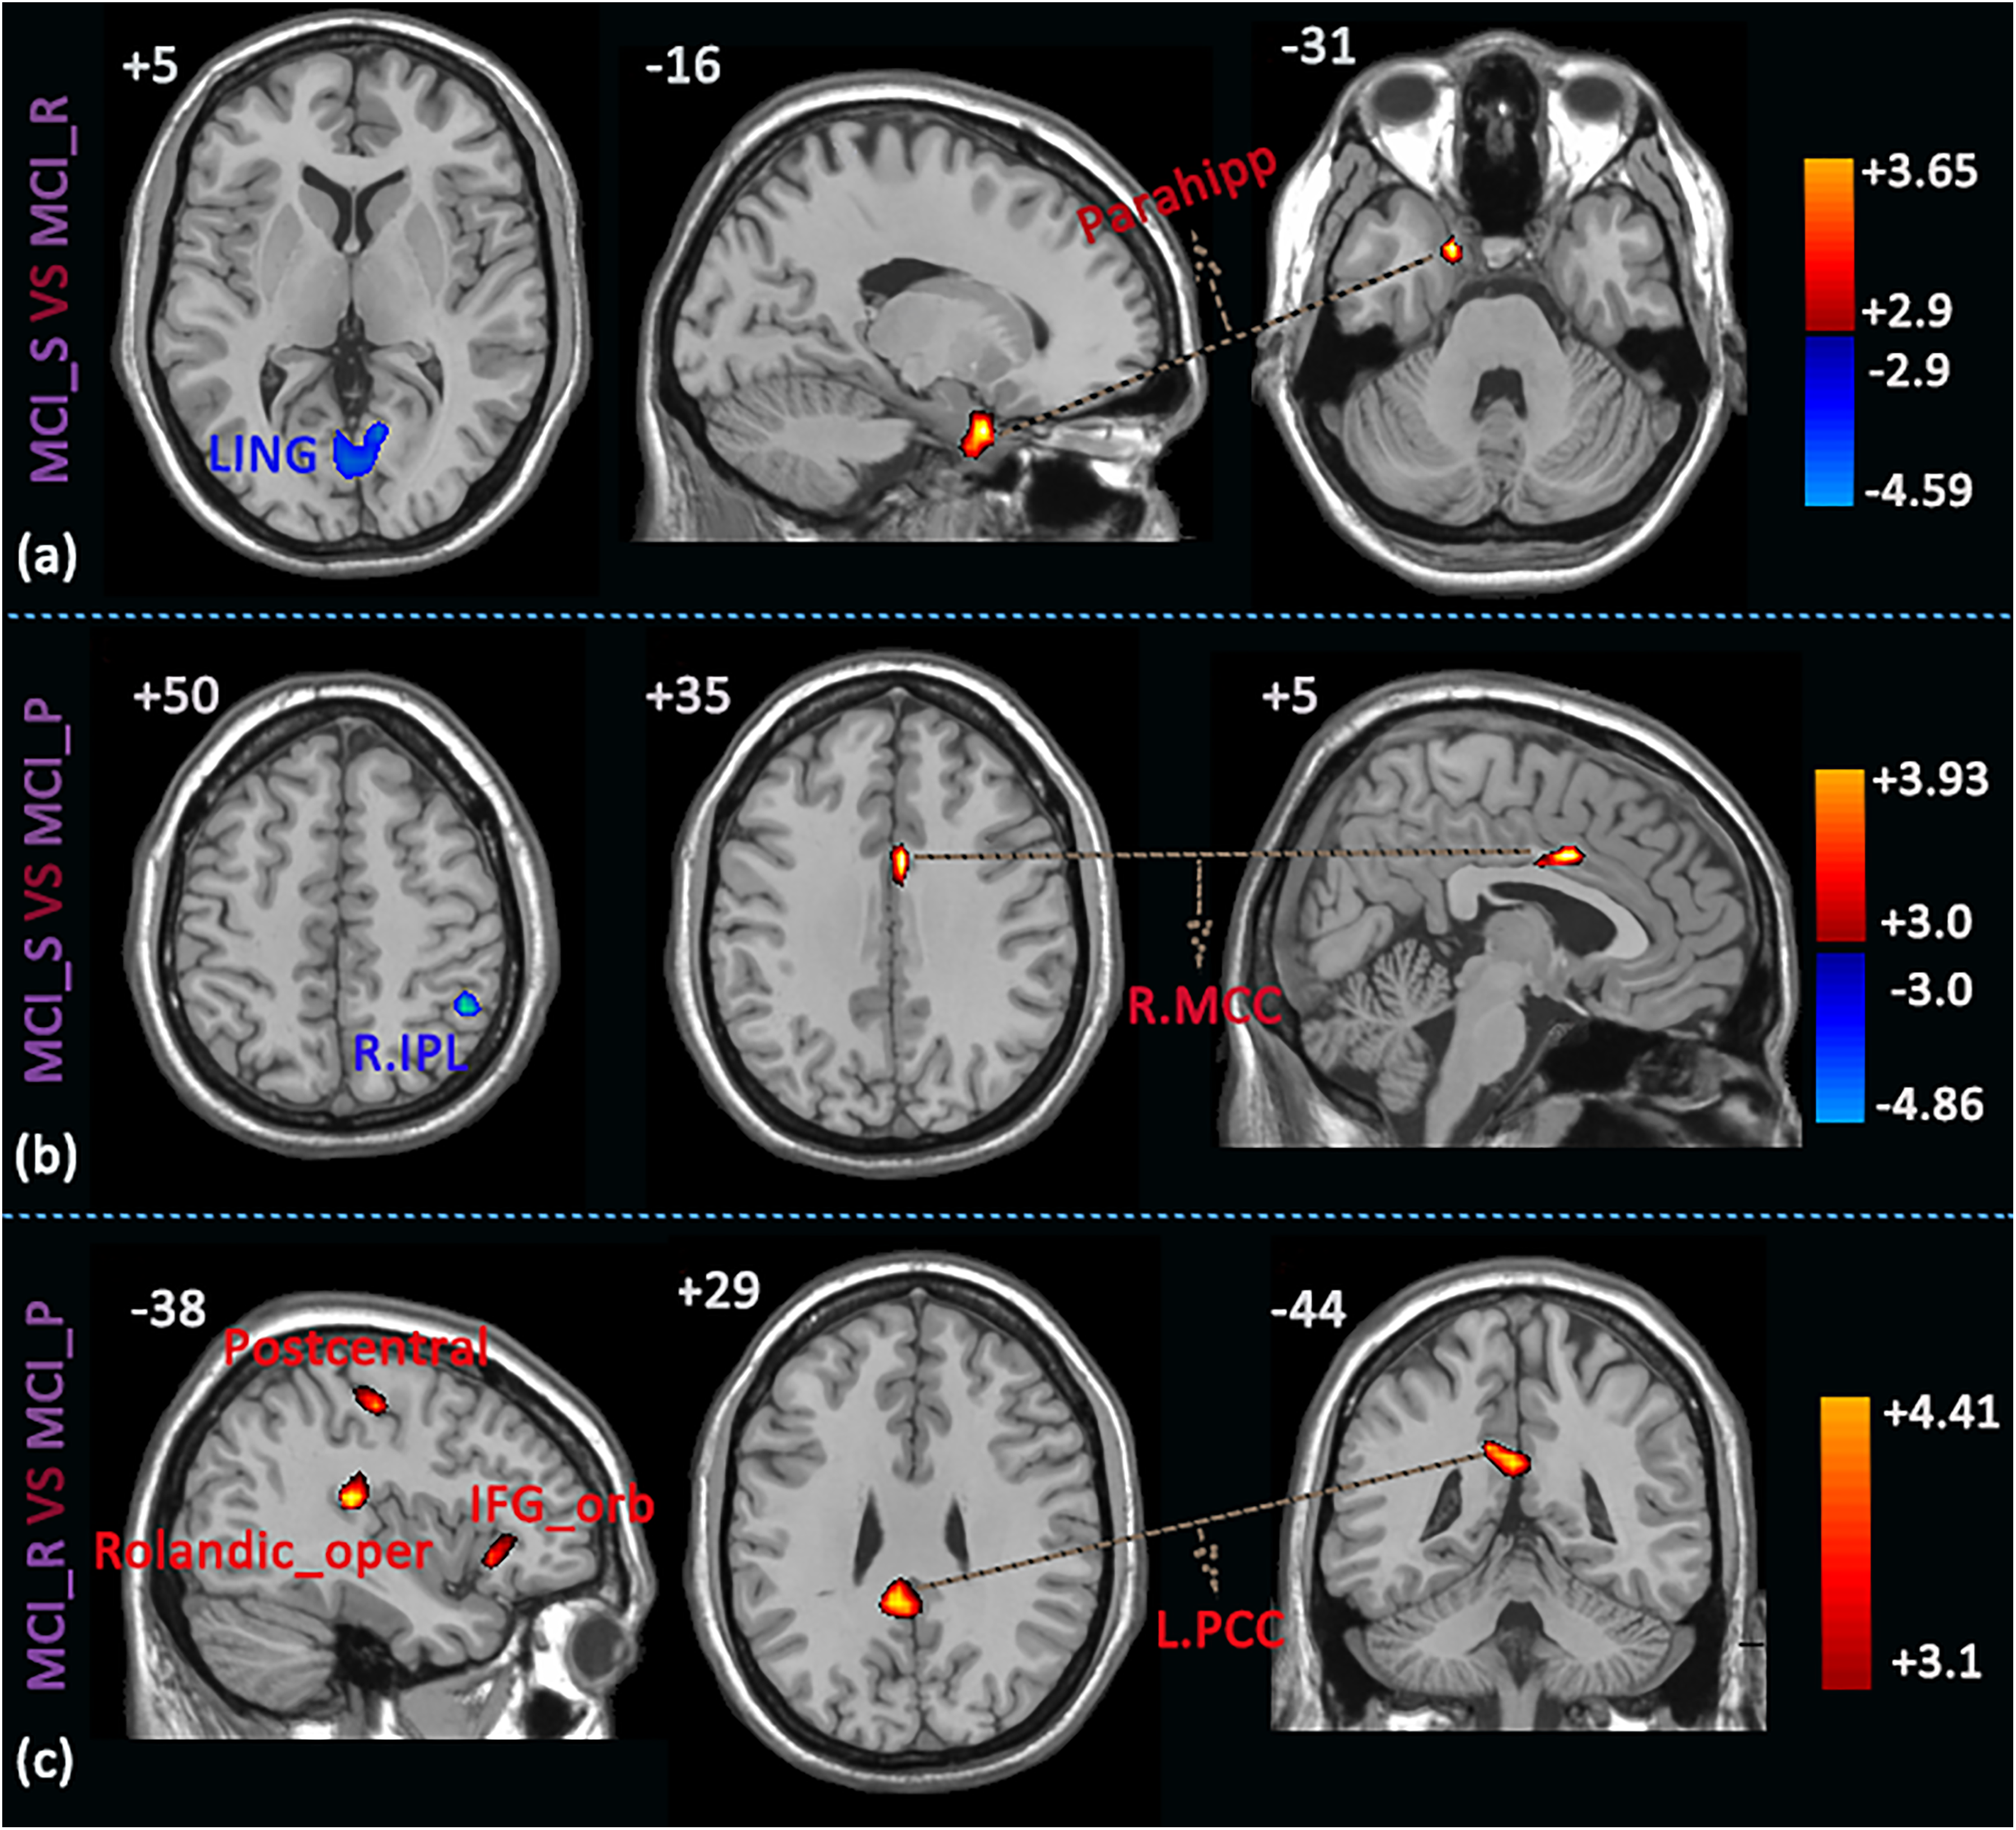
Brain areas showing significant differences in ReHo values within the 3 MCI groups (P < .01, FDR corrected). (A) MCI_S versus MCI_R, (B) MCI_S versus MCI_P, (C) MCI_R versus MCI_P. The red color represents increased ReHo values and blue color represents decreased ReHo values. AD indicates Alzheimer’s disease; FDR, false discovery rate; MCI, mild cognitive impairment; MCI_P, patients with MCI progressed to AD and stabilized in the AD state in 24 months; MCI_R, patients with MCI reversed to NC state and stabilized in the NC state in 24 months; MCI_S, patients with MCI stabilized in the MCI state in 24 months; NC, normal control; ReHo, regional homogeneity.
Significant Differences in ReHo Within Progressive MCI Groups (P < .01, FDR Corrected) of Brain Regions.a
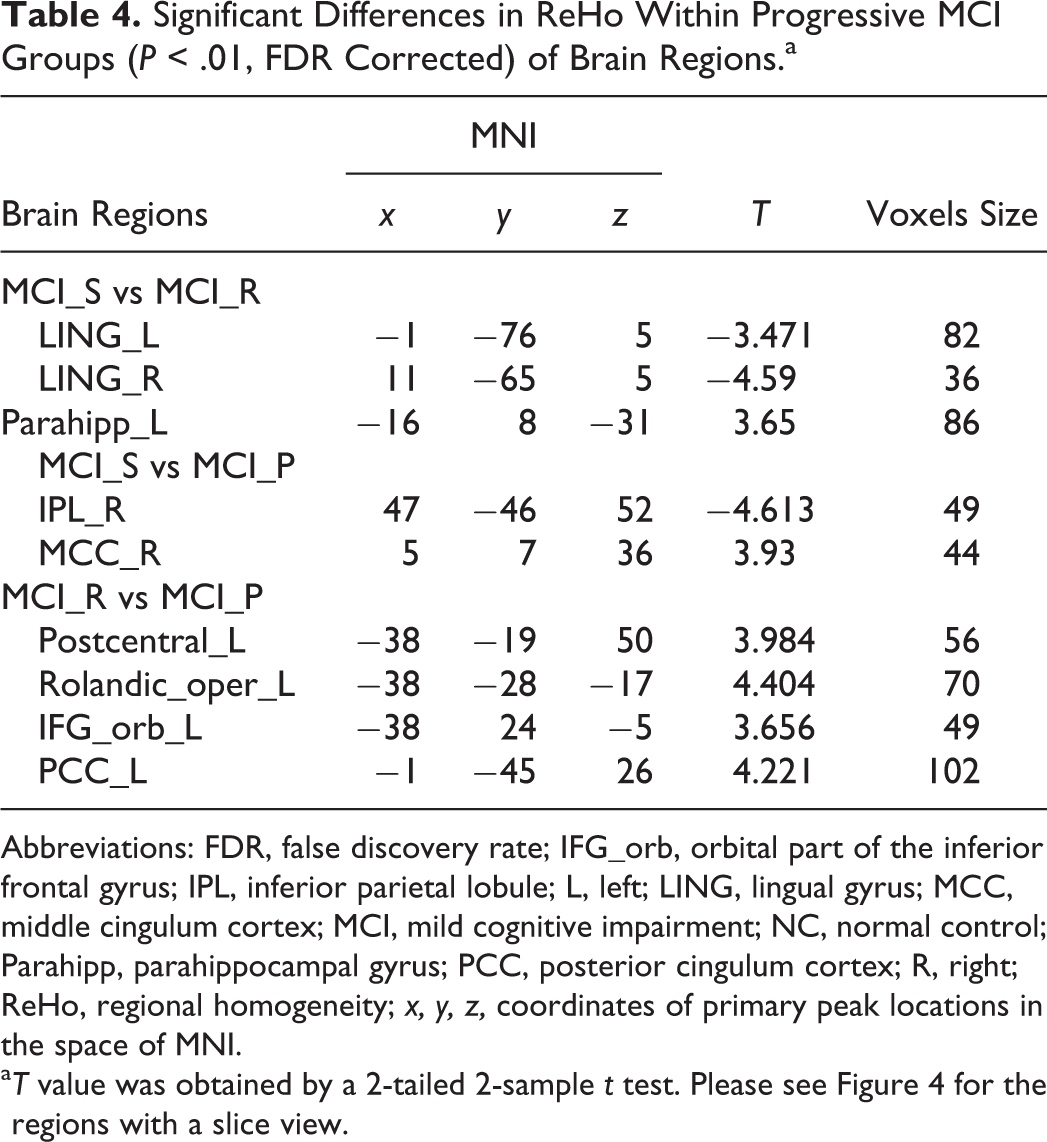
Abbreviations: FDR, false discovery rate; IFG_orb, orbital part of the inferior frontal gyrus; IPL, inferior parietal lobule; L, left; LING, lingual gyrus; MCC, middle cingulum cortex; MCI, mild cognitive impairment; NC, normal control; Parahipp, parahippocampal gyrus; PCC, posterior cingulum cortex; R, right; ReHo, regional homogeneity; x, y, z, coordinates of primary peak locations in the space of MNI.
aT value was obtained by a 2-tailed 2-sample t test. Please see Figure 4 for the regions with a slice view.
Correlations Between ReHo Values and MMSE Scores in the MCI Groups
In the Spearman rank-order correlation analysis, we found a significant negative correlation between the ReHo index of the left STG and the MMSE scores in the MCI_R group (rs = P < .01, FDR correction; Figure 3D, Table 4). Similarly, we also found a negative correlation between the ReHo index of the left putamen and the MMSE scores in the MCI_P group (rs = P < .01, FDR correction; Figure 3E, Table 4). There were no significant correlations in the rest of the identified brain regions (Table 5).
Correlation Coefficient and Corresponding P Value Between ReHo Values and MMSE Scores.
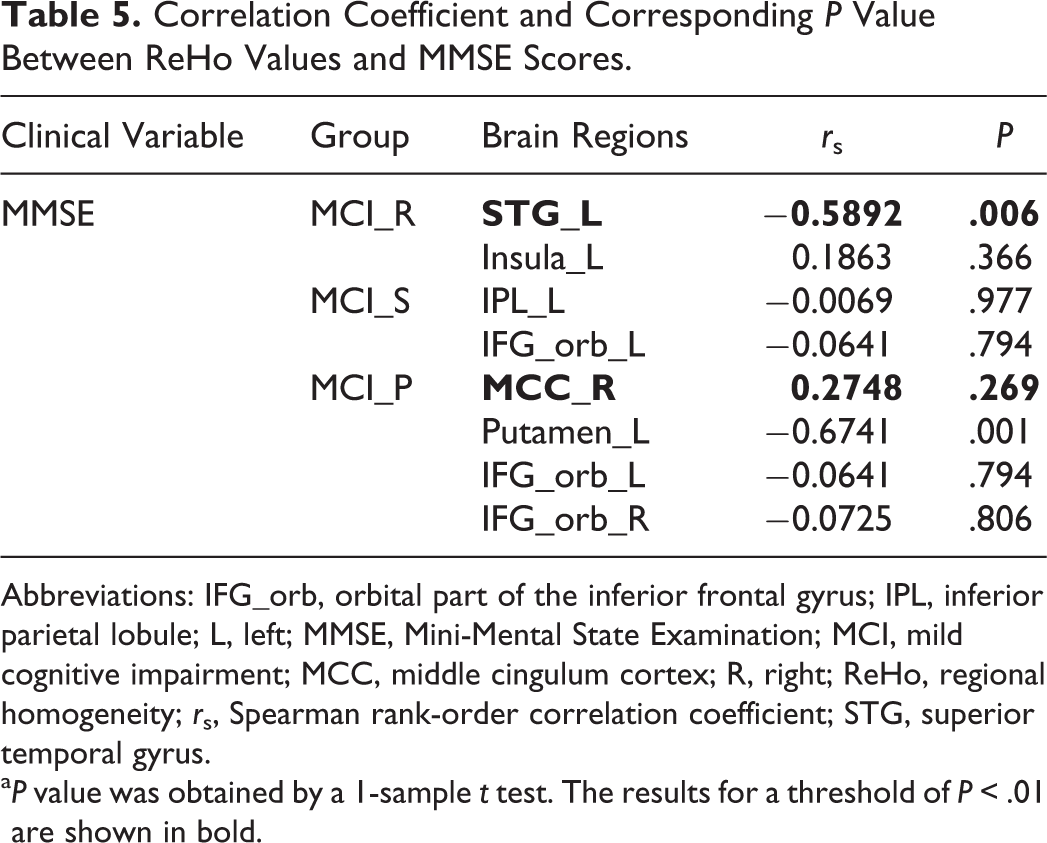
Abbreviations: IFG_orb, orbital part of the inferior frontal gyrus; IPL, inferior parietal lobule; L, left; MMSE, Mini-Mental State Examination; MCI, mild cognitive impairment; MCC, middle cingulum cortex; R, right; ReHo, regional homogeneity; rs, Spearman rank-order correlation coefficient; STG, superior temporal gyrus.
aP value was obtained by a 1-sample t test. The results for a threshold of P < .01 are shown in bold.
Discussion
In this study, we investigated the difference in ReHo characteristics in various progressive MCI groups compared to the control group. We suggest that the significant difference in ReHo characteristics found in the current study could serve as potential novel imaging biomarkers of the prognosis of patients with progressive MCI.
Overall, the ReHo values in 3 group presented as a mixed pattern of coexistence of decreased values in certain regions and increased values in some other regions, separately compared to the same control group. The location and range of these regions varied among the groups. Moreover, longitudinal changes across the 3 groups indicated a distinct pattern of brain activity at different stages of MCI. According to previous researches, mixed pattern of both elevated activity and decreased activity is one of the obvious imaging features with the presence of AD. In our study, such pattern was also seen in MCI across all 3 groups.
Distinct ReHo Between the MCI and Control Groups
The overall change involved only the left hemisphere in MCI_R and MCI_S, compared to both hemispheres in MCI_P group, indicating a deterioration in the MCI_P group. The exclusion of the right hemisphere in the 2 groups also indicated that the left side is the dominant hemisphere and is also better consistent with the selected patients in the groups who are dextromanual.
As described previously, 3 MCI groups exhibited a mixed pattern of coexistence of decreased and increased indexes in different regions when compared to the same control group, respectively. The ReHo index reflects the level of functional coherence of a given voxel with its nearest neighbors and could be used to evaluate brain activities in resting state and also be helpful for revealing the complexity of human brain function. Both decreased and increased values represented the abnormal changes of brain activities, but those involved different meanings. Decreased ReHo value means that cerebral blood flow in certain region is reduced along with regional metabolism rate changes into lower which could be demonstrated by several studies in patients with MCI. 14,30,31 Similar explanation applies to the increased ReHo value. The increased ReHo value implies compensatory effect which also consistent with the assumption from a previous study that AD patients could use additional neural resources to remedy losses of cognitive function in the early stage of the disease. 32
Except 2 brain regions MCC and putamen that belong to limbic system, decreased activity was found in the current study to be located in relatively posterior regions, especially in MCI_S and MCI_P. Meanwhile, generally, increased activity was found in regions relatively anterior, especially in MCI_S and MCI_P. This potential tendency, especially in MCI_S and MCI_P, is in accordance with the pattern of posterior-anterior shift in aging, 33 -35 which has been proved enhanced by the presence of AD. Moreover, the development of the cortices indicated their vulnerability to age-related atrophy—the later developed cortices are more vulnerable. Therefore, the regions easily affected by the progression of AD appeared to be relatively more typical in MCI_P and MCI_S, with decreased homogeneity, while other regions which are less easily affected and also have a significant influence in the process of language, memory, or cognition presented with increased homogeneity, probably as a compensation effect.
With partial consistence with a previous study, 36 we observed decreased ReHo values in the left STG in MCI_R. It is a key region responsible for both phonological processing for language perception and production and social cognition processes. 37 -39 Various forms of diseases have shown structural abnormalities in their STG regions. 19,20,36 The decreased ReHo value in this region may explain the obstacle in language perception and production in patients with MCI_R. At the same time, increased coherences were observed in the left insula, which is thought to be vital in cognition, 40 especially in semantic perception. Previous studies demonstrated that activation in the insular cortex was associated with complex verbal memory storage tasks 41 and memory encoding tasks 42 in healthy participants. Decreased ReHo values in the left STG and increased values in the left insula could act as mutual support.
In the MCI_S group, decreased value was found in the left IPL and increased value in the left IFG_orb. The IPL is one of the key regions of the DMN which could characterize RS brain activity 43,44 and plays a crucial role in establishing long-term declarative memory. 45 Our findings are in accordance with previous findings in that the decreased ReHo value in the left IPL is correlated with the development of the disease: Zhang and colleagues 14 found that spontaneous activations were altered in the left IPL and some other regions in patients with MCI; researches have shown that the atrophy of the IPL is associated with MCI/AD 46,47 and could predict the progress from MCI to AD. 48,49 Thus, the abnormal functional activity in the IPL in our study may also be due to structural changes.
In the MCI_P group, the right MCC and left putamen presented with decreased ReHo value. The cingulum gyrus, especially the middle segment, has been associated with various brain disorders and diseases. It takes memory information and integrates itself to other parts of the brain, such as the other subcortex and prefrontal areas. Therefore, damage to the cingulum gyrus also simultaneously occurs in the related regions. Researchers have associated MCI with damage to the cingulum gyrus. Thus, the MCC would be a unique biomarker to predict AD in the MCI_P group. Likewise, recent studies have shown that the putamen is not only restricted to the motor mechanism 50 but is also active in probabilistic learning tasks 51,52 and working memory tasks. 53 Most of the literature indicated that the putamen and basal ganglia are very important in AD and other diseases involved in the degeneration of neurons. 54 De Jong et al 55 reported that the decreased volumes of the putamen and thalamus were linearly correlated with impaired cognitive function in the elderly individuals. Our results revealed a potential putaminal volume reduction in AD, indicating that the putamen would be an important factor in the conversion of MCI to AD.
In this study, increased ReHo in IFG_orb was found in MCI_S and MCI_P. The IFG plays an important role in cognitive control and the IFG_orb uses low-frequency information of visual stimulation to estimate a possible stimulus to promote faster information processing in sensitive areas of the cerebral cortex. The current study suggested that patients with MCI could use additional neural resources in the pars orbitalis of the inferior prefrontal lobe, presumably those mediating executive functions, to compensate for losses due to the degenerative process of the disease. Grady et al 32 provided direct evidence to support the idea that activity in these frontal regions is compensatory. Moreover, the frontal regions are typically affected later in the course of the disease, and they mediate organizational and executive functions that might operate across multiple types of tasks.
Thus, it can be explained based on our findings that, in MCI (especially MCI_S and MCI_P), according to the disease development, regions responsible for the processing and storage of language, memory, and cognition are earlier involved. At the same time, relative compensations were found showing as elevations in other regions (typically in the more anterior areas) in the early stages of disease development, especially in the stage likely to return to normal.
Additionally, a novel finding in this study was the existence of a significantly negative correlation between ReHo values of the left STG and MMSE scores in both MCI_R and MCI_P. The negative correlation means that higher MMSE scores correspond to lower ReHo values. To explain this finding, we also made a correlation analysis between the 2 values in the control group and observed that there was no significant correlation. Hence, we speculated that the negative correlation was due to reduced ReHo values in the left STG when comparing MCI with the control group. From another perspective, the negative correlation between the 2 values also supported our finding with regard to decreased ReHo in the left STG.
Differences in ReHo Between the 3 MCI Groups
In order to obtain some additional findings which might help to explain the regional changes better, we also compared the ReHo indexes within the 3 progressive MCI groups. Significant differences were found in a set of brain areas, including the left parahippocampal, left postcentral, left rolandic_oper, left IFG_orb, left PCC, bilateral LING, right IPL, and MCC. Likewise, most of the alterant regions are located in left hemisphere, further proving that the left side is the dominant hemisphere, and were consistent with the selected patients who are dextromanual. Moreover, discrepant brain regions are different, comparing between the 3 MCI groups, portending patients with MCI have differentiated outcome types. Especially, between MCI_P and MCI_R groups are more than the other 2 between-group comparisons, implying the MCI_P group is tending toward deterioration in the following years to some extent.
The MCI_S group showed decreased ReHo values in bilateral LING and increased value in parahippocampal than those in MCI_R group and decreased value in IPL and increased value in MCC than those in MCI_P group. Mixed pattern of coexistence also occurs in the contrastive analysis among the MCI groups. The LING is an important brain region to process visual function, and bilateral destruction of the LING can affect complex visual processing. Explicit memory deficits in AD have been involved to pathological, structural, and functional abnormalities within the parahippocampal. 56 Functions of MCC and IPL have been introduced before. Together the alterant models of above brain activities and those functions, we could indirectly understand the underlying reason of the 3 MCI groups has different outcomes during 24 months observation period in the current study.
The ReHo values of IFG_orb, PCC, postcentral gyrus, and rolandic_oper are significant high when comparing MCI_R with MCI_P group. Local consistency activity of IFG_orb presented an interesting pattern: ReHoNC < ReHoMCI_P value < ReHoMCI_R, which is in accordance with Miller et al’s finding. That study suggested compensatory effect of brain function was obvious in patients with MCI, but with the development of the disease, it emerges an inverted U model. The current finding opportunely verified this model. The PCC was considered as a central node in DMN during rest. 57 Raichle et al 44 have detected that the PCC had the highest metabolic rates in healthy participants, and He et al found the ReHo values of PCC present significantly descending trend along with the progression of this disease. 13 Therefore, this result is consistent with previous studies. Postcentral gyrus is somatosensory center and rolandic_oper located in temporal region is involved in language function. 58 Relative to MCI_P, higher ReHo values of the 2 regions in MCI_R group may be interpreted as more obvious compensatory effect or less evident descending trend at the beginning of the disease.
This study has 2 limitations: (1) In the ADNI database, the number of participants with MCI who reversed to a normal state and stabilized to a normal condition for 2 years are relatively small. We almost traversed all database and selected eligible participants, only 20 participants is available for analysis in the end. We will keep track of database updates for meaningful discovery. (2) We did not find participants’ record of medication history which ought to be taken into account.
Conclusion
In summary, the purpose of the study was to investigate whether ReHo characteristics were different in these progressive MCI. We found that ReHo values in several regions were significantly different when compared within the 3 MCI group as well as relative to the same control group. Our results suggested that there was differentiation in these progressive MCI. Those different ReHo indices could serve as a potential biomarker for early detection of AD, which may also provide a reference for clinical researchers to manipulate active but distinctive interventions for patients with MCI who have different risks.
Footnotes
Authors’ Note
Suping Cai and Meiping Huang collected the data. Haidong Wang, Yafei Kang, Yubo Wang, and Hyejin Kim analyzed data and performed the measurements. Suping Cai and Liyu Huang had the major responsibility for preparing the article. Suping Cai wrote the paper. Yuan yuan Jiang and Karen M. von Deneen revised the article. Liyu Huang supervised this study. Suping Cai and Yubo Wang contributed equally to this study.
Acknowledgments
The authors also thanked the ADNI database. Data used in preparation of this article were obtained from the ADNI database (http://adni.loni.usc.edu). As such, the investigators within ADNI contributed to the design and implementation of ADNI and/or provided data but did not participate in the analysis or writing of this report. A complete listing of ADNI investigators can be found at ![]() .
.
Declaration of Conflicting Interests
The authors declared no potential conflicts of interest with respect to the research, authorship, and/or publication of this article.
Funding
The authors disclosed receipt of the following financial support for the research, authorship, and/or publication of this article: This study was supported by the National Natural Science Foundation of China (grant numbers 81671778, U1401255, and 81701787), China Postdoctoral Science Foundation (grant NO. 2017M623128), and the Fundamental Research Funds for the Central Universities (grant NO. JB181209).