
Abstract
Prototypical items within a semantic category are processed faster than atypical items within the same category. This typicality effect reflects normal representation and processing of semantic categories and when absent may be reflective of lexical–semantic deficits. We examined typicality effects in individuals with semantic and nonsemantic variants of primary progressive aphasia (PPA; semantic—PPA-S, agrammatic—PPA-G), a neurodegenerative disorder characterized by specific decline in language function, and age-matched controls. Using a semantic category verification task, where participants were asked to decide whether visual or auditory words (category typical, atypical, or nonmembers) belonged within a specified superordinate category, we found a typicality effect (ie, faster response times for typical vs atypical items) for all participant groups. However, participants with more severe PPA-S did not show a typicality effect in either modality. Findings may reflect increased intracategory semantic blurring as the disease progresses and semantic impairment becomes more severe.
Introduction
A number of lexical features impact organization of the mental lexicon. One of these features, semantic typicality, is thought to primarily affect within-category organization. The traditional view is that each semantic category has a set of defining features but that not all members of a category share all features. 1,2 Some members are considered typical exemplars with many of the defining categorical features (eg, “robin” is a typical member of the category “birds”), whereas others are considered atypical exemplars with fewer defining categorical features (eg, “ostrich” is an atypical member of the category “birds”). Although strongly correlated, typicality is a distinct lexical feature that is independent of word frequency and familiarity. For example, “chicken” is a word with high lexical frequency and familiarity yet is considered “atypical” given that it possesses relatively few of the defining features of the category “bird” (eg, it does not fly).
Typical members of a category are processed faster than atypical members. 1,3,4 This typicality effect has been demonstrated in healthy participants in many studies using several experimental paradigms, including item ranking, lexical decision, category verification, and category naming. 1,2,5,6 In neurologically impaired participants, this effect has been demonstrated in nonfluent Broca’s aphasia but not fluent Wernicke’s aphasia 4 and in acquired phonological dyslexia but not acquired deep dyslexia. 3 In both of these experiments with neurologically impaired participants, a category verification task was used, and patients with Broca’s aphasia and acquired phonological dyslexia demonstrated faster response times (RTs) for typical when compared to atypical exemplars of category items. However, for patients with fluent Wernicke’s aphasia and acquired deep dyslexia, no RT differences were found between the typical and atypical items. Notably, individuals with Wernicke’s aphasia and acquired deep dyslexia showed impairments on other semantic tasks as well, 7 -9 in line with their failure to show semantic typicality effects. Further, the patients with deep dyslexia 3 showed this pattern in both visual and auditory modalities.
Primary progressive aphasia (PPA) is a progressive neurodegenerative disorder that selectively impairs language function while leaving other cognitive functions relatively intact. 10 -12 PPA is diagnosed primarily based on 3 central criteria: (1) The disease process is neurodegenerative, (2) language dysfunction (ie, aphasia) is unrelated to motor and/or perceptual deficits, and (3) language dysfunction is the primary impairment in beginning stages of the disease. 10,11 Three major subtypes of PPA have been identified: agrammatic (PPA-G), logopenic (PPA-L), and semantic (PPA-S). 10,11,13 All 3 major subtypes of PPA demonstrate word-finding difficulties, although the underlying impairments differ across subtypes. PPA-S is commonly associated with impaired word comprehension, difficulty defining words, 14 and production of semantic paraphasias during connected speech. 10,15 -18 In contrast, PPA-G and PPA-L are typically associated with intact word comprehension, and they do not produce frequent semantic paraphasias nor show other patterns of semantic impairment on language testing. 10,15,18 Recent evidence from a study of semantic interference suggests PPA-G and PPA-L may demonstrate subtle online semantic processing impairments that may impact word-finding ability. 18,19 For this article, we use the term PPA-G to refer to individuals who demonstrate difficulty with grammatical comprehension and expression (with or without co-occurring motor speech impairment). We reserve the term PPA-S for those presenting with semantic impairments, without visual agnosia, distinguishing them from patients with semantic dementia who do have visual agnosia.
Lexical–semantic deficits in PPA-S have been described as a “blurring” of semantic feature boundaries, based on error patterns in naming and other tasks (ie, semantic paraphasias, semantic errors in picture/word matching, word definitions, and object description tasks). 18 However, the nature of this impairment is not clear, and questions remain as to which variables (eg, typicality, input modality) influence intracategory semantic processing in semantic and nonsemantic variants of PPA. In the present study, we manipulated semantic typicality to further elucidate the nature of semantic deficits in PPA, testing the typicality effect in individuals with PPA-S compared to those with PPA-G and age-matched controls. We also tested typicality across sensory modalities in visual (written) and auditory word experimental conditions. We predicted that the PPA-S (but not PPA-G or normal control) participants would show abnormal typicality patterns, independent of sensory input modality. The presence of a typicality effect (faster RTs to typical items) would be indicative of intact semantic intracategory distinctions, whereas lack of a typicality effect would be indicative of loss of intracategory distinctions (ie, semantic blurring).
Method
Participants
Thirty-six individuals with PPA participated in this study: 12 PPA-S (5 females; age 53-70, M = 60.42) and 24 PPA-G (11 females; age 48-80, M = 64.83). Four of the participants classified as PPA-G also had co-occurring motor speech impairment; we did not exclude these participants because the nature of the task did not require a verbal response. The PPA subtype was determined by assessing grammatical processing using the Northwestern Assessment of Verbs and Sentences (NAVS) 20 and the Northwestern Anagram Test (NAT); 21 semantic processing and word knowledge were assessed with the Pyramids and Palm Trees Test 22 and a subset of moderately difficult items (Form B, items 157-192) on the Peabody Picture Vocabulary Test (PPVT; see Table 1 for a summary of demographic information and cognitive–linguistic test scores). 23 All participants in the PPA group were enrolled in a large-scale longitudinal study of PPA conducted in the Cognitive Neurology and Alzheimer’s Disease Center and Aphasia & Neurolinguistics Research Laboratory at Northwestern University.
The PPA Participant Demographic Information and Cognitive Test Scores.
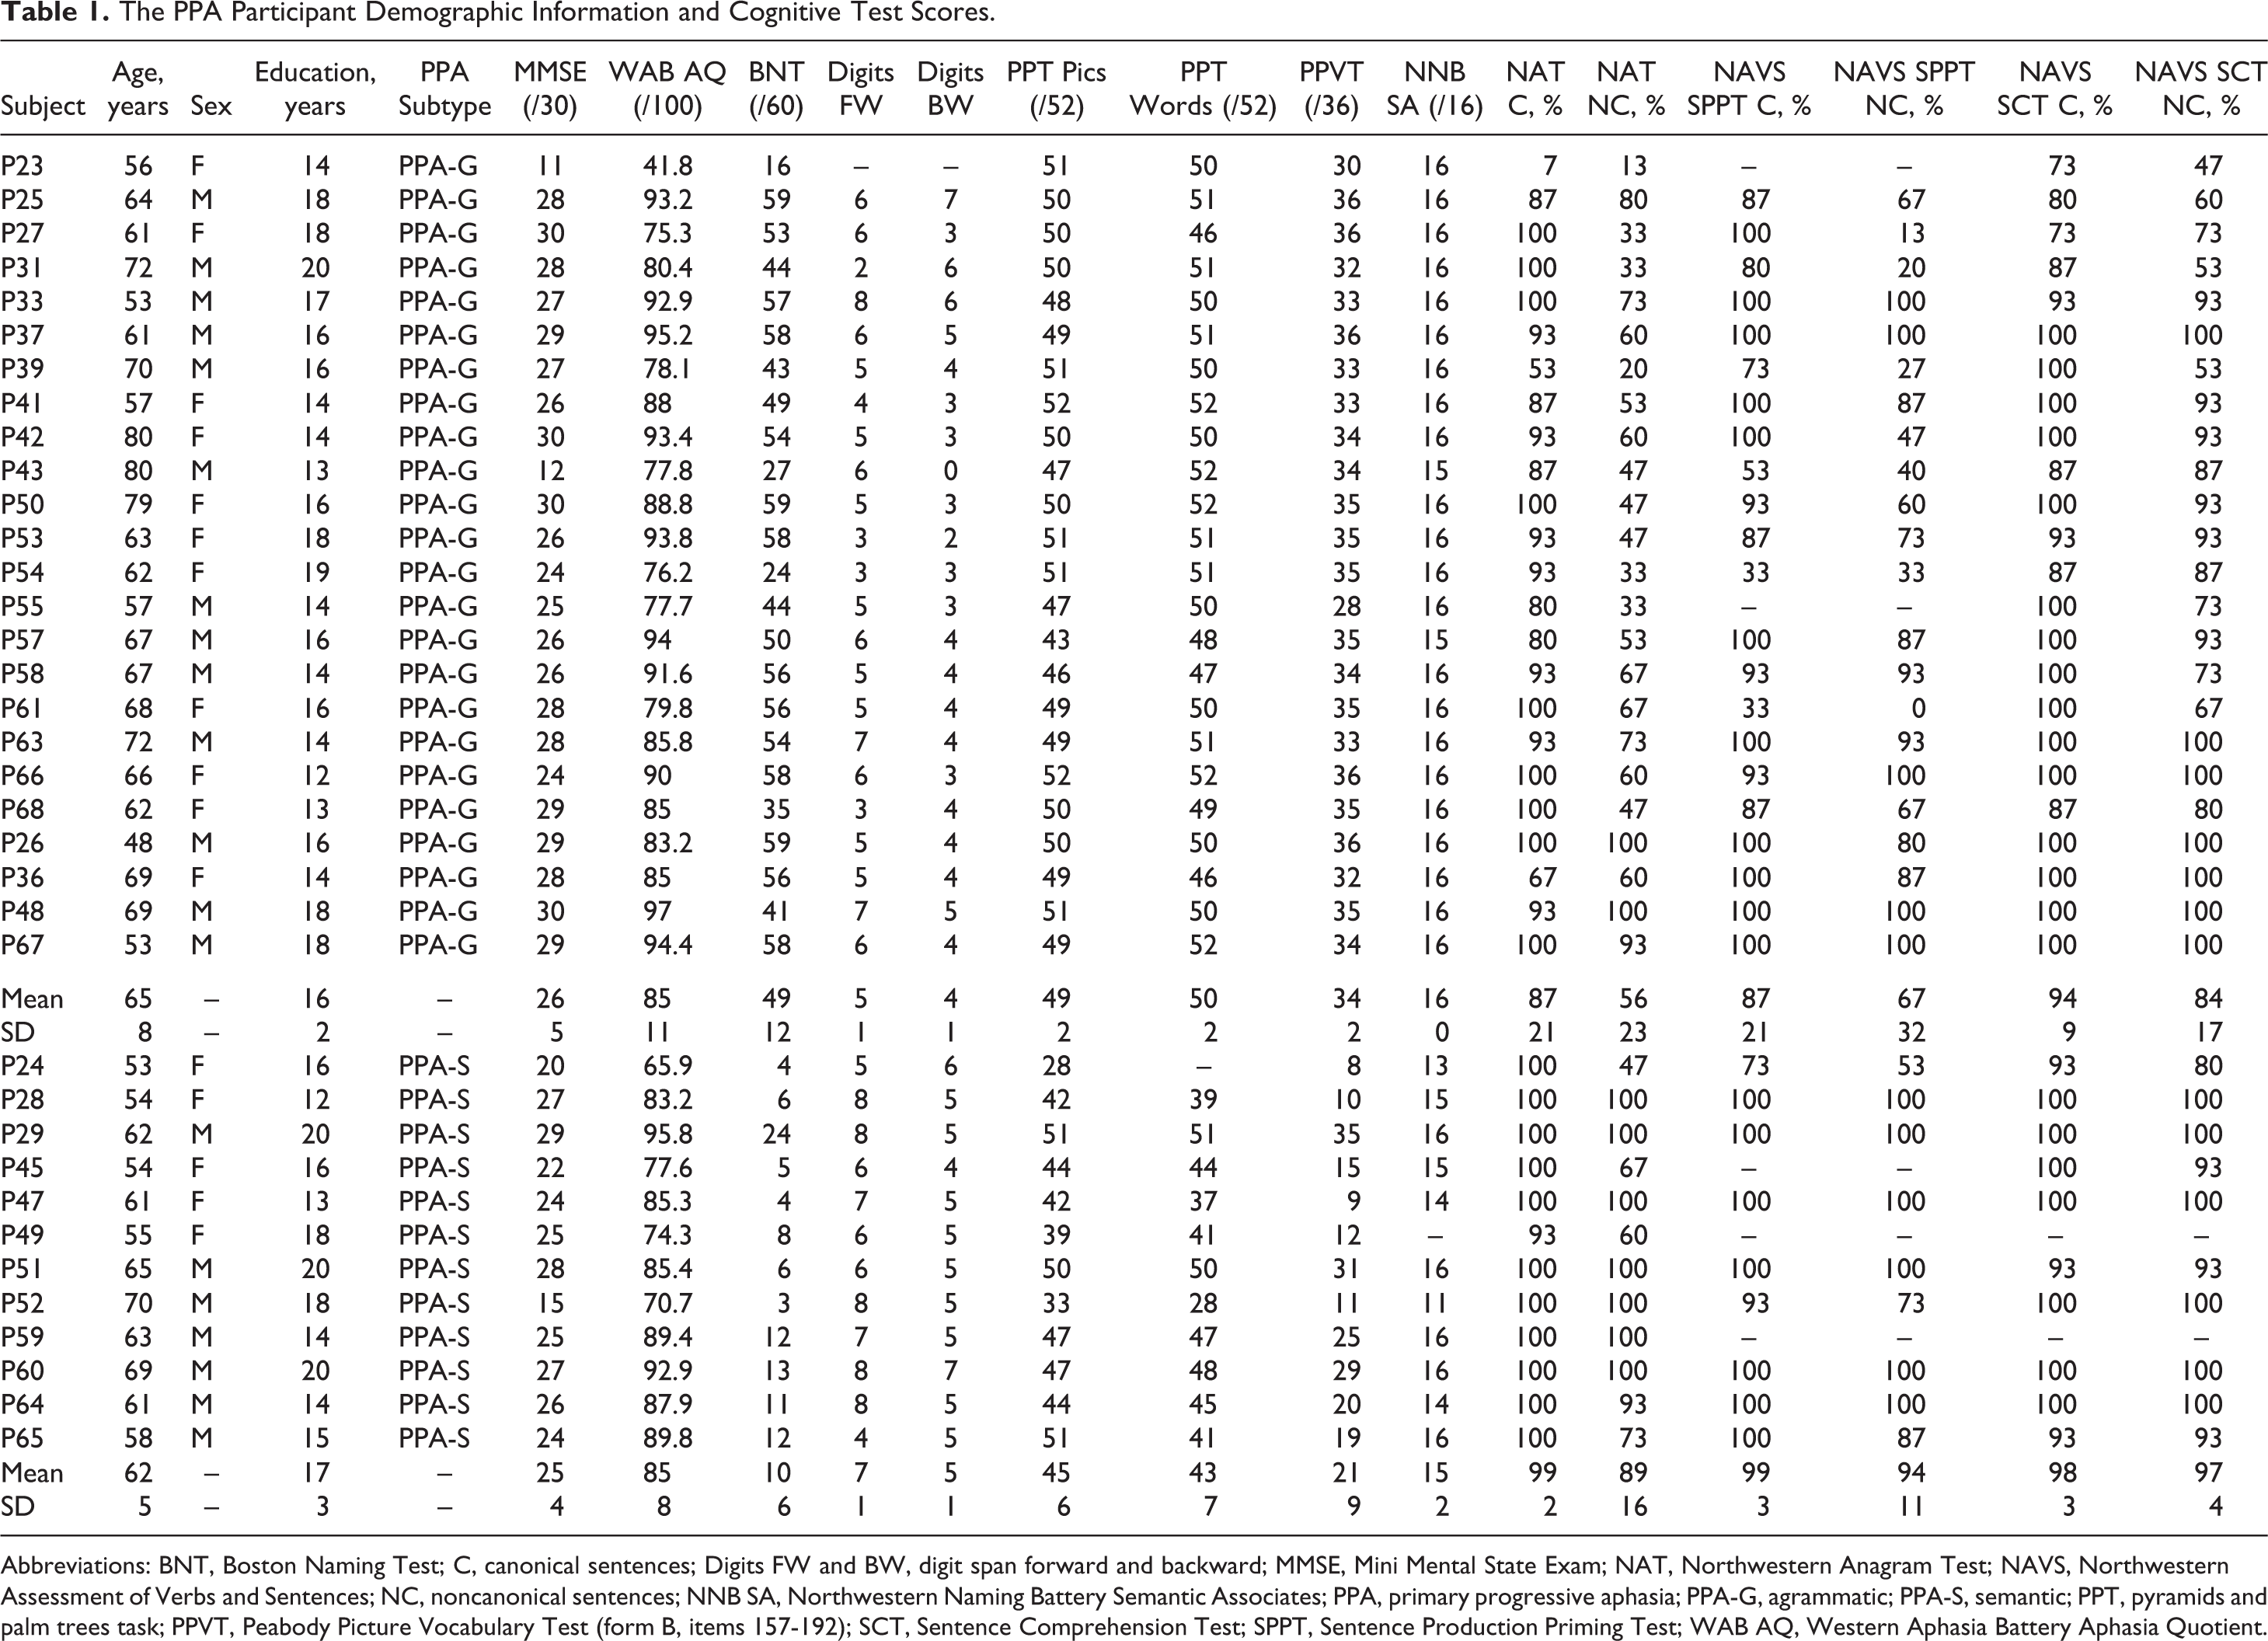
Abbreviations: BNT, Boston Naming Test; C, canonical sentences; Digits FW and BW, digit span forward and backward; MMSE, Mini Mental State Exam; NAT, Northwestern Anagram Test; NAVS, Northwestern Assessment of Verbs and Sentences; NC, noncanonical sentences; NNB SA, Northwestern Naming Battery Semantic Associates; PPA, primary progressive aphasia; PPA-G, agrammatic; PPA-S, semantic; PPT, pyramids and palm trees task; PPVT, Peabody Picture Vocabulary Test (form B, items 157-192); SCT, Sentence Comprehension Test; SPPT, Sentence Production Priming Test; WAB AQ, Western Aphasia Battery Aphasia Quotient.
Addition, 29 cognitively healthy older adults participated in a control group (15 females; age 50-76, M = 61.5 years). Control participants were recruited from the Chicago metropolitan area. Participants in the control group were age- and education matched to participants in the PPA group and were administered a battery of cognitive tests to rule out memory, attention, and executive function deficits. Tests included in this battery were the Mini-Mental State Exam (MMSE), 24 Wechsler Memory Scales-III (Faces I and II), 25 Facial Recognition Test, 26 Trail Making Test, 27 and a 10-item version of the Visual Verbal Test. 28 To be included as a control participant in this study, scores on these measures were required to be within normal ranges for the individual’s age and education level. Participants in the PPA and control groups were native English speakers, had normal or corrected-to-normal vision and hearing, and presented with no history of psychological or neurological injury or illness (other than PPA in the patient group). All participants provided informed consent in accordance with procedures outlined by the Northwestern University Institutional Review Board.
Materials
The stimuli used in this study were the same as those used in a category verification task by Riley and Thompson, after Kiran and Thompson. 3,4 Fifteen typical and 15 atypical items were used for each of 3 superordinate natural object categories (birds, vegetables, fish), for a total of 90 items; an additional 90 items, unrelated to the aforementioned superordinate categories, were also used as nonmember exemplars, making a total 180 items used in the tasks. In addition, 12 training trials were administered for each condition—these training items included 4 typical, 4 atypical, and 4 nonmember items. 29 Each of the 180 items was paired with 1 of 3 superordinate category labels (bird, vegetable, and fish) for use in the category verification task, yielding 180 word pairs (eg, typical pair: bird/robin, atypical pair: bird/penguin, and unrelated pair: bird/table). The typical and atypical items were paired with their matching superordinate categories (eg, bird/robin, vegetable/carrot, and fish/trout) and thus were designed to elicit a “yes” response from participants. The nonmember items were paired with 1 of the same 3 superordinate categories (eg, bird/table, vegetable/hammer, and fish/shoe) and thus were designed to elicit a “no” response from participants.
All word pairs were presented in 2 conditions: an auditory condition and a visual (written) condition. In both conditions, participants were seated at an Apple iMac computer running Superlab 4.0 (Cupertino, California, USA) (Cedrus, San Pedro, California, USA); a Cedrus RB-420 button box (Cedrus) was used to collect participant responses (temporal resolution of 10-12 milliseconds). The auditory stimuli were presented at an audible level, adjusted individually for each participant during the practice trials. Each auditory stimulus was presented 1 time while the participant viewed a blank screen. The visually presented stimuli were all displayed in Arial Black font, size 48, with superordinate categories presented in capital letters and target words presented in lowercase letters. In both conditions, participants were first presented with a superordinate category word (eg, BIRD), followed by a fixation cross, followed by a typical (eg, robin), atypical (eg, penguin), or unrelated (eg, table) target item. After presentation of the target item, participants indicated via button press whether the item belonged to the category, with the left button indicating a “yes” response and the right button indicating a “no” response. In the auditory condition, the superordinate category word was presented for the duration of the audio file (500-700 milliseconds), followed by 200 milliseconds of silence, followed by auditory presentation of the target word (500-700 milliseonds), followed by a 1500-millisecond interval between trials. In the visual condition, the superordinate category word was presented for 750 milliseconds, followed by a 200-millisecond fixation cross, followed by presentation of the target item, which remained on screen until the participant responded, followed by a 1500-millisecond interval between trials (see Figure 1).
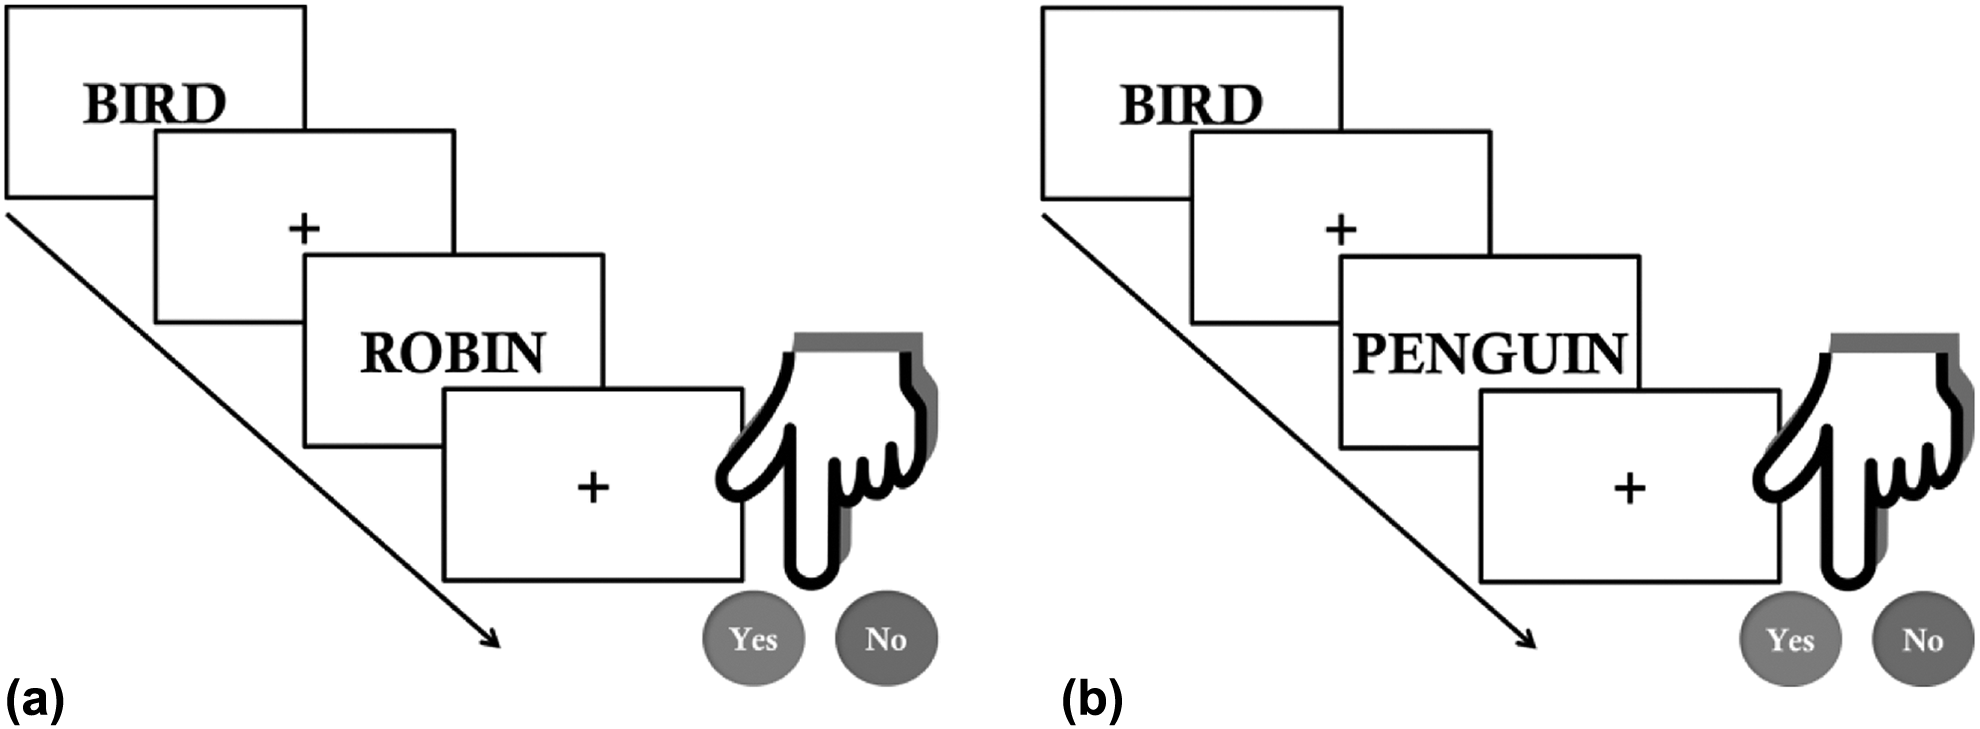
Schematic representing a typical trial (a) and an atypical trial (b) in the visual condition.
All participants completed the experiment on the same day, with at least 2 hours between sessions. The order of conditions was counterbalanced across participants.
Data Analysis
Mixed-effects logistic (for accuracy) and linear (for RTs) regression analyses 30,31 were performed in R, version 3.3.3. (R Core Team, 2016). For both accuracy and RT analyses, the following predictors were evaluated in each regression model: participant group (healthy controls, PPA-G, PPA-S), typicality condition (typical, atypical, nonmember), modality (auditory, visual), age, and the proportion of correct responses on the PPVT. Age and PPVT score were mean centered to avoid collinearity and introduced as covariates to account for the variability in age and severity of semantic impairment across individuals. Random effects for item and participant were included in all models. For accuracy, the best-fit model was obtained by introducing 1 predictor at a time, and its contribution was evaluated by comparing models with and without that predictor. For RT, we first implemented a full factorial model that included all predictors and their interactions, as well as random effects, and then applied the backward automated procedure included in the lmerTest package version 2.0 to 3.0, 32 which progressively removed factors that did not contribute significantly to the model fit. After outliers were identified and excluded (ie, data points exceeding 2.5 SD above the residual errors), the model was refitted to ensure that results were not driven by outliers. P values for each predictor were computed using Satterthwaite approximation and corrected for multiple comparisons using the Tukey correction included in the multcomp package. 33 Only corrected P values are reported.
Results
Accuracy
The best-fit model for accuracy included an interaction between participant group and modality; therefore, separate models were implemented for each modality. Across both modalities, final regression models included participant group, typicality condition, age, and all their interactions as predictors. Overall, participant group was a significant predictor of accuracy, with the control and PPA-G groups performing significantly better than the PPA-S group across both modalities (see Figure 2a; auditory: PPA-S>controls, β = −3.589, standard error [SE] = 0.409, z = −8.777, P < .001; PPA-S>PPA-G, β = −.389, SE = 0.395, z = −6.053, P < .001; visual: PPA-S>controls, β = −3.220, SE = 0.417, z = −7.726, P < .001; PPA-S>PPA-G, β = −2.089, SE = 0.396, z = −5.269, P < .001). There was also a significant difference in performance between the control and PPA-G groups (auditory: PPA-G>controls, β = −1.199, SE = 0.367, z = −3.269, P = .025; visual: PPA-G>controls, β = −1.131, SE = 0.362, z = −3.122, P = .04); however, both control and PPA-G groups were highly accurate across all typicality conditions. Across all groups, accuracy on nonmember and typical items was overall higher than for atypical items in both the auditory (typical>atypical, β = .838, SE = 0.253, z = 3.316, P = .021; nonmember>atypical, β = .846, SE = 0.213, z = 3.977, P = .002) and the visual modality (typical>atypical, β = 1.055, SE = 0.231, z = 4.577, P < .001; nonmember>atypical, β = 1.067, SE = 0.202, z = 5.283, P < .001), and no differences were found between typical and nonmember items. Because of a significant 3-way Group × Typicality × Age interaction, separate models were run for each participant group; however, since accuracy in both control and PPA-G groups were 95% and above across all typicality conditions, only results for the PPA-S group will be reported (see Figure 2b).
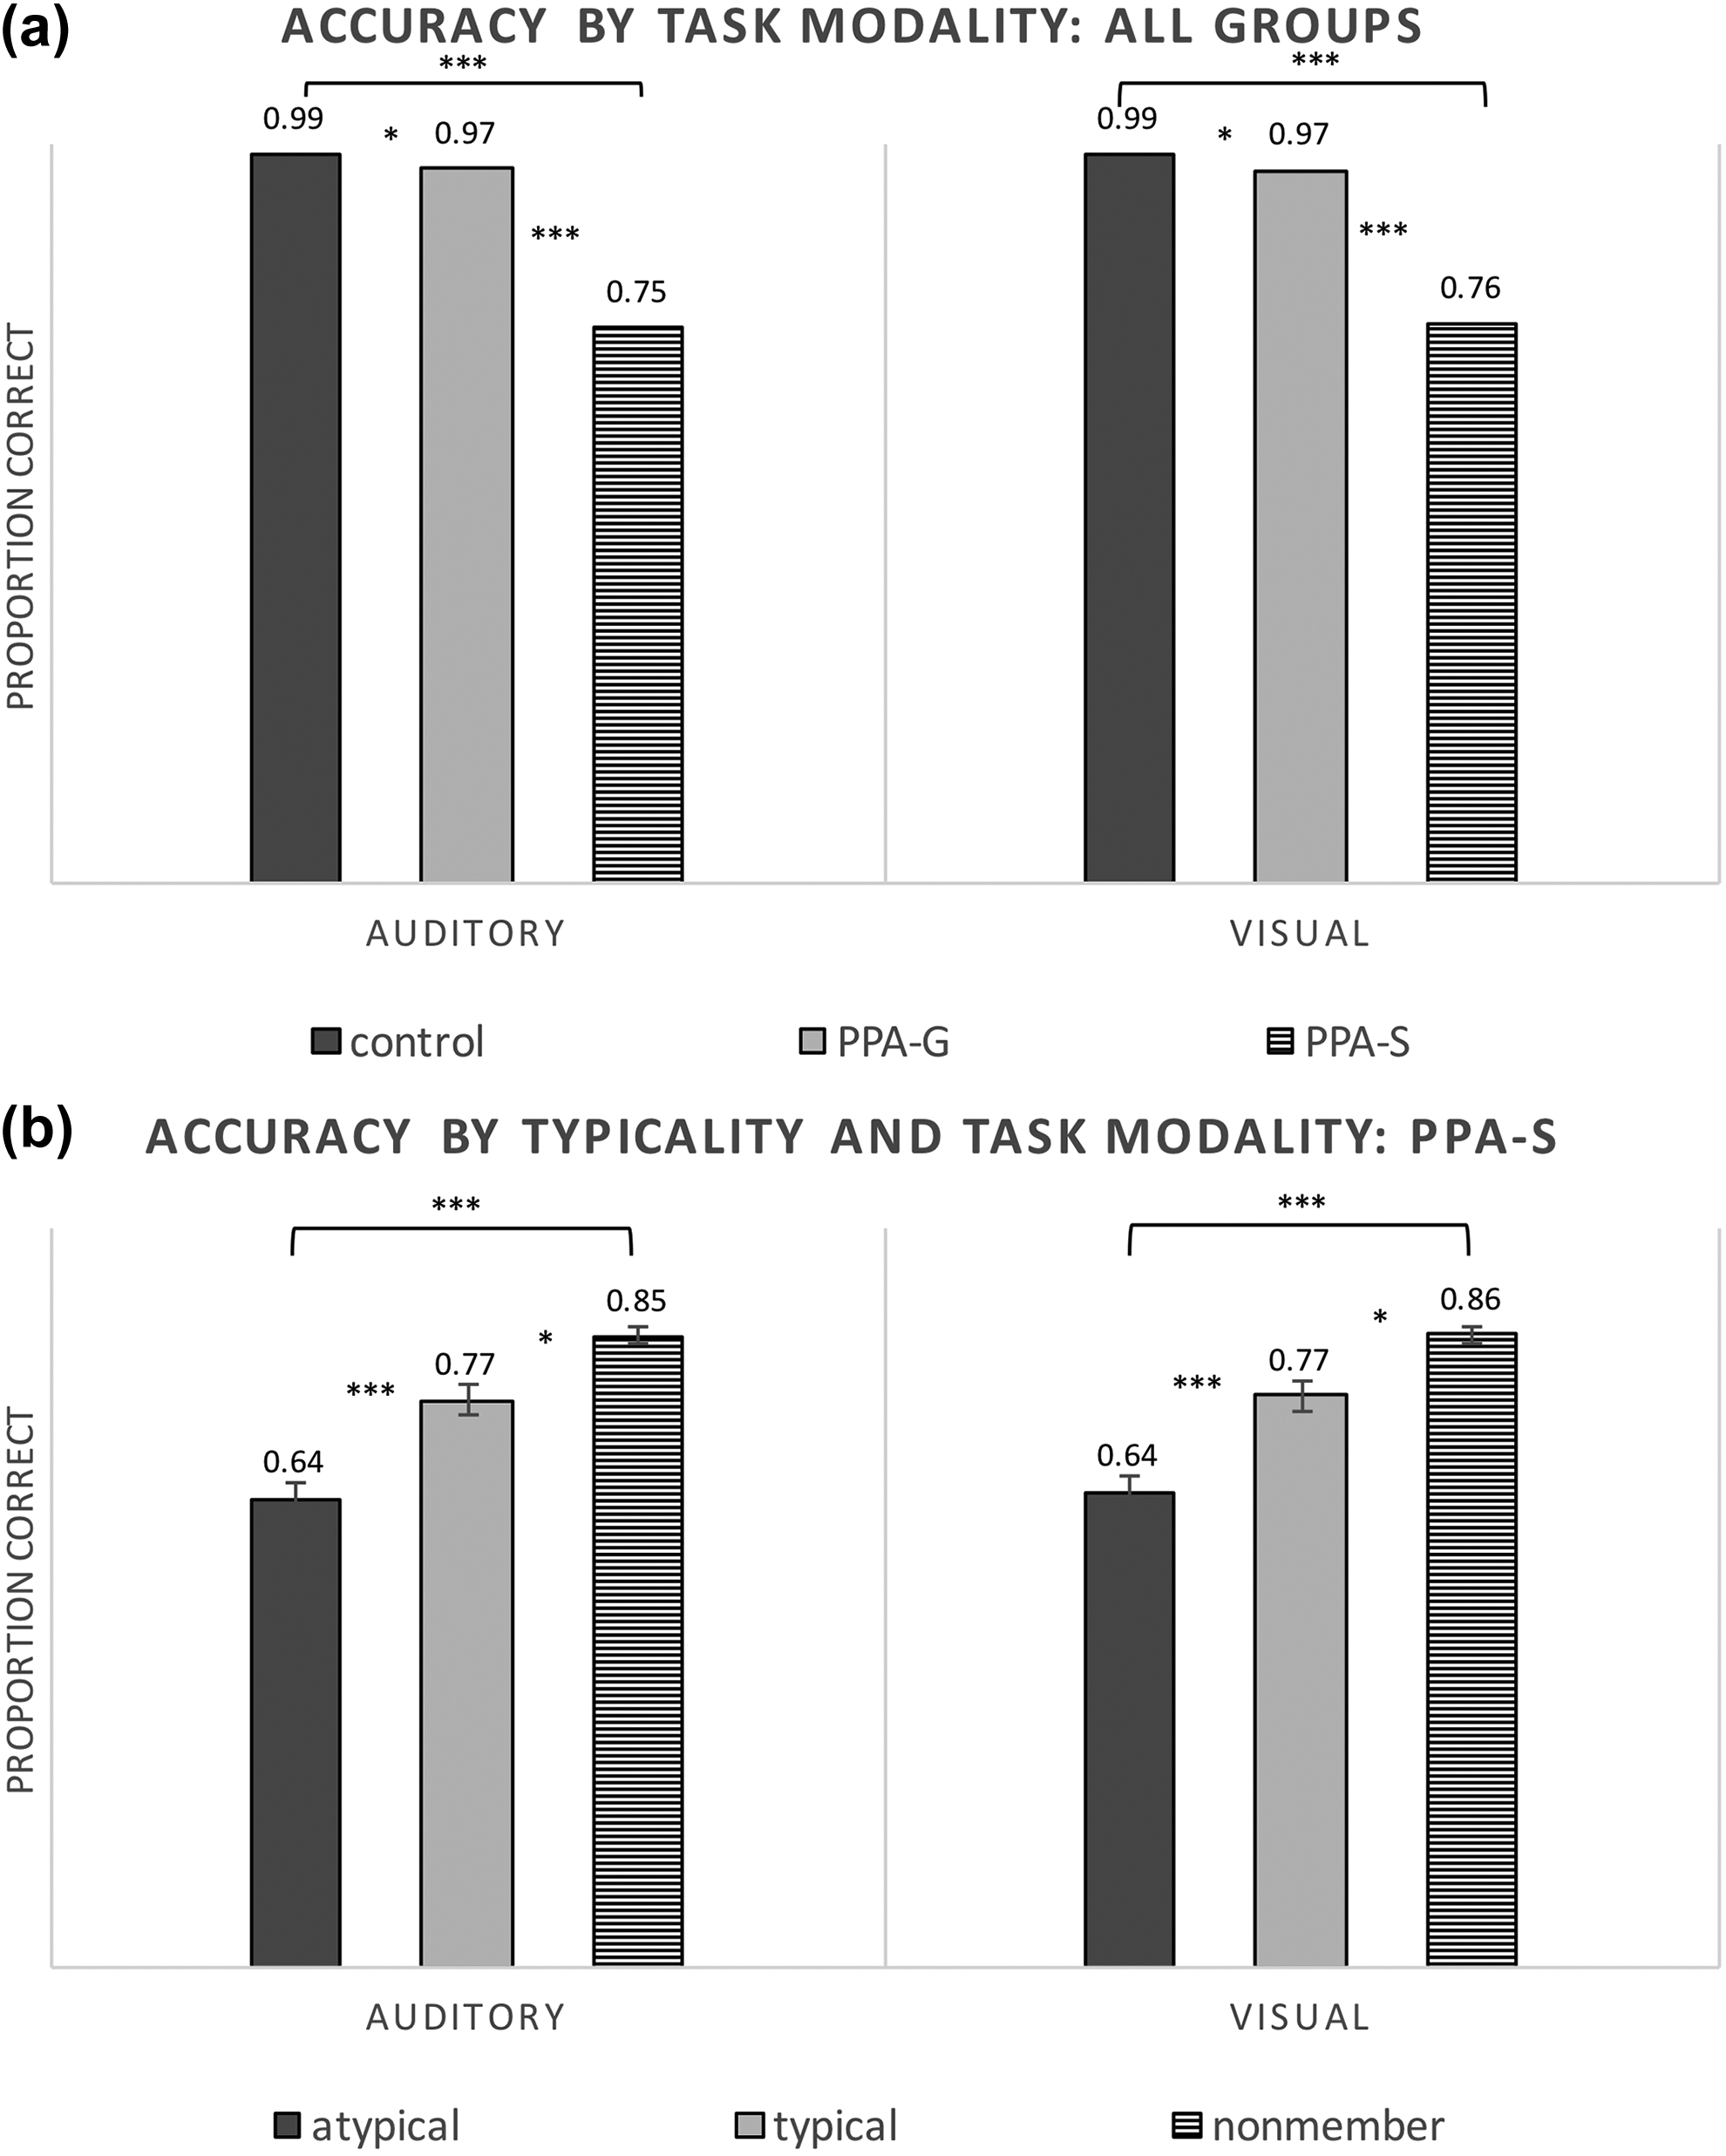
Proportion of correct responses across presentation modalities: (a) all participant groups, collapsed across typicality conditions; (b) across typicality conditions for PPA-S participants only. *P < .05, **P < .01, ***P < .001. PPA-S indicates primary progressive aphasia-semantic.
Within the PPA-S group, results showed a significant effect of performance on the PPVT (an index of severity in this group, as it is a measure of integrity of lexical–semantic knowledge), indicating overall better accuracy for mild than for severe participants (auditory: β = 4.687, SE = 0.709, z = 6.613, P < .001; visual: β = 3.302, SE = 0.730, z = 4.527, P < .001). Interestingly, a significant interaction was found between severity and typicality category. To investigate this interaction further, the group of PPA-S participants was divided into 2 subgroups by performing a median split based on the performance on the PPVT: participants with a score <19 were classified as “severe” and participants with a score of 19 and above were classified as “mild” (highest possible score on the PPVT was 36). Separate models were then run for each subgroup in each modality. These follow-up analyses revealed differences between mild and severe PPA-S, with the former showing a pattern similar to control and PPA-G participants, that is, better accuracy on nonmember than typical items and better accuracy for typical than atypical items in both modalities (auditory: nonmember>typical, β =1.396, SE = 0.371, z = 3.765, P = .001; typical>atypical, β = 1.375, SE = 0.325, z = 4.229, P < .001; visual: nonmember>typical, β = 1.487, SE = 0.384, z = 3.874, P < .001; typical>atypical, β = 1.28, SE = 0.355, z = 3.611, P = .002), and the latter showing no reliable difference in accuracy between typical and atypical items or between atypical and nonmember items in either modality and only better accuracy on typical than nonmember items (auditory: β = 1.115, SE = 0.329, z = 3.393, P = .004; visual: β = 1.768, SE = 0.401, z = 4.408, P < .001). In addition, a significant Age × Typicality category interaction was found only in the “severe” group, indicating better performance on nonmembers for younger than older participants and a reverse effect for typical and atypical items (auditory
Response Time
The best-fit model for RTs revealed a 3-way Group × Modality × Age interaction; therefore, separate models were implemented for the auditory and the visual modality.
Overall, participant group was a significant predictor of response time. The PPA-S group responded significantly more slowly than either the control or the PPA-G groups for both the auditory (PPA-S>PPA-G, β = .089, SE = 0.031, z = 2.923, P = .033; PPA-S>control, β = .202, SE = 0.029, z = 6.947, P < .001) and the visual versions of the task (PPA-S>PPA-G, β = .130, SE = 0.026, z = 4.955, P < .001; PPA-S>control, β = .229, SE = 0.026, z = 8.884, P < .001). Because of the significant Group × Typicality interaction in both the auditory and the visual modality, separate models were implemented for each participant group (see Figure 3a for auditory task and Figure 3b for visual task).
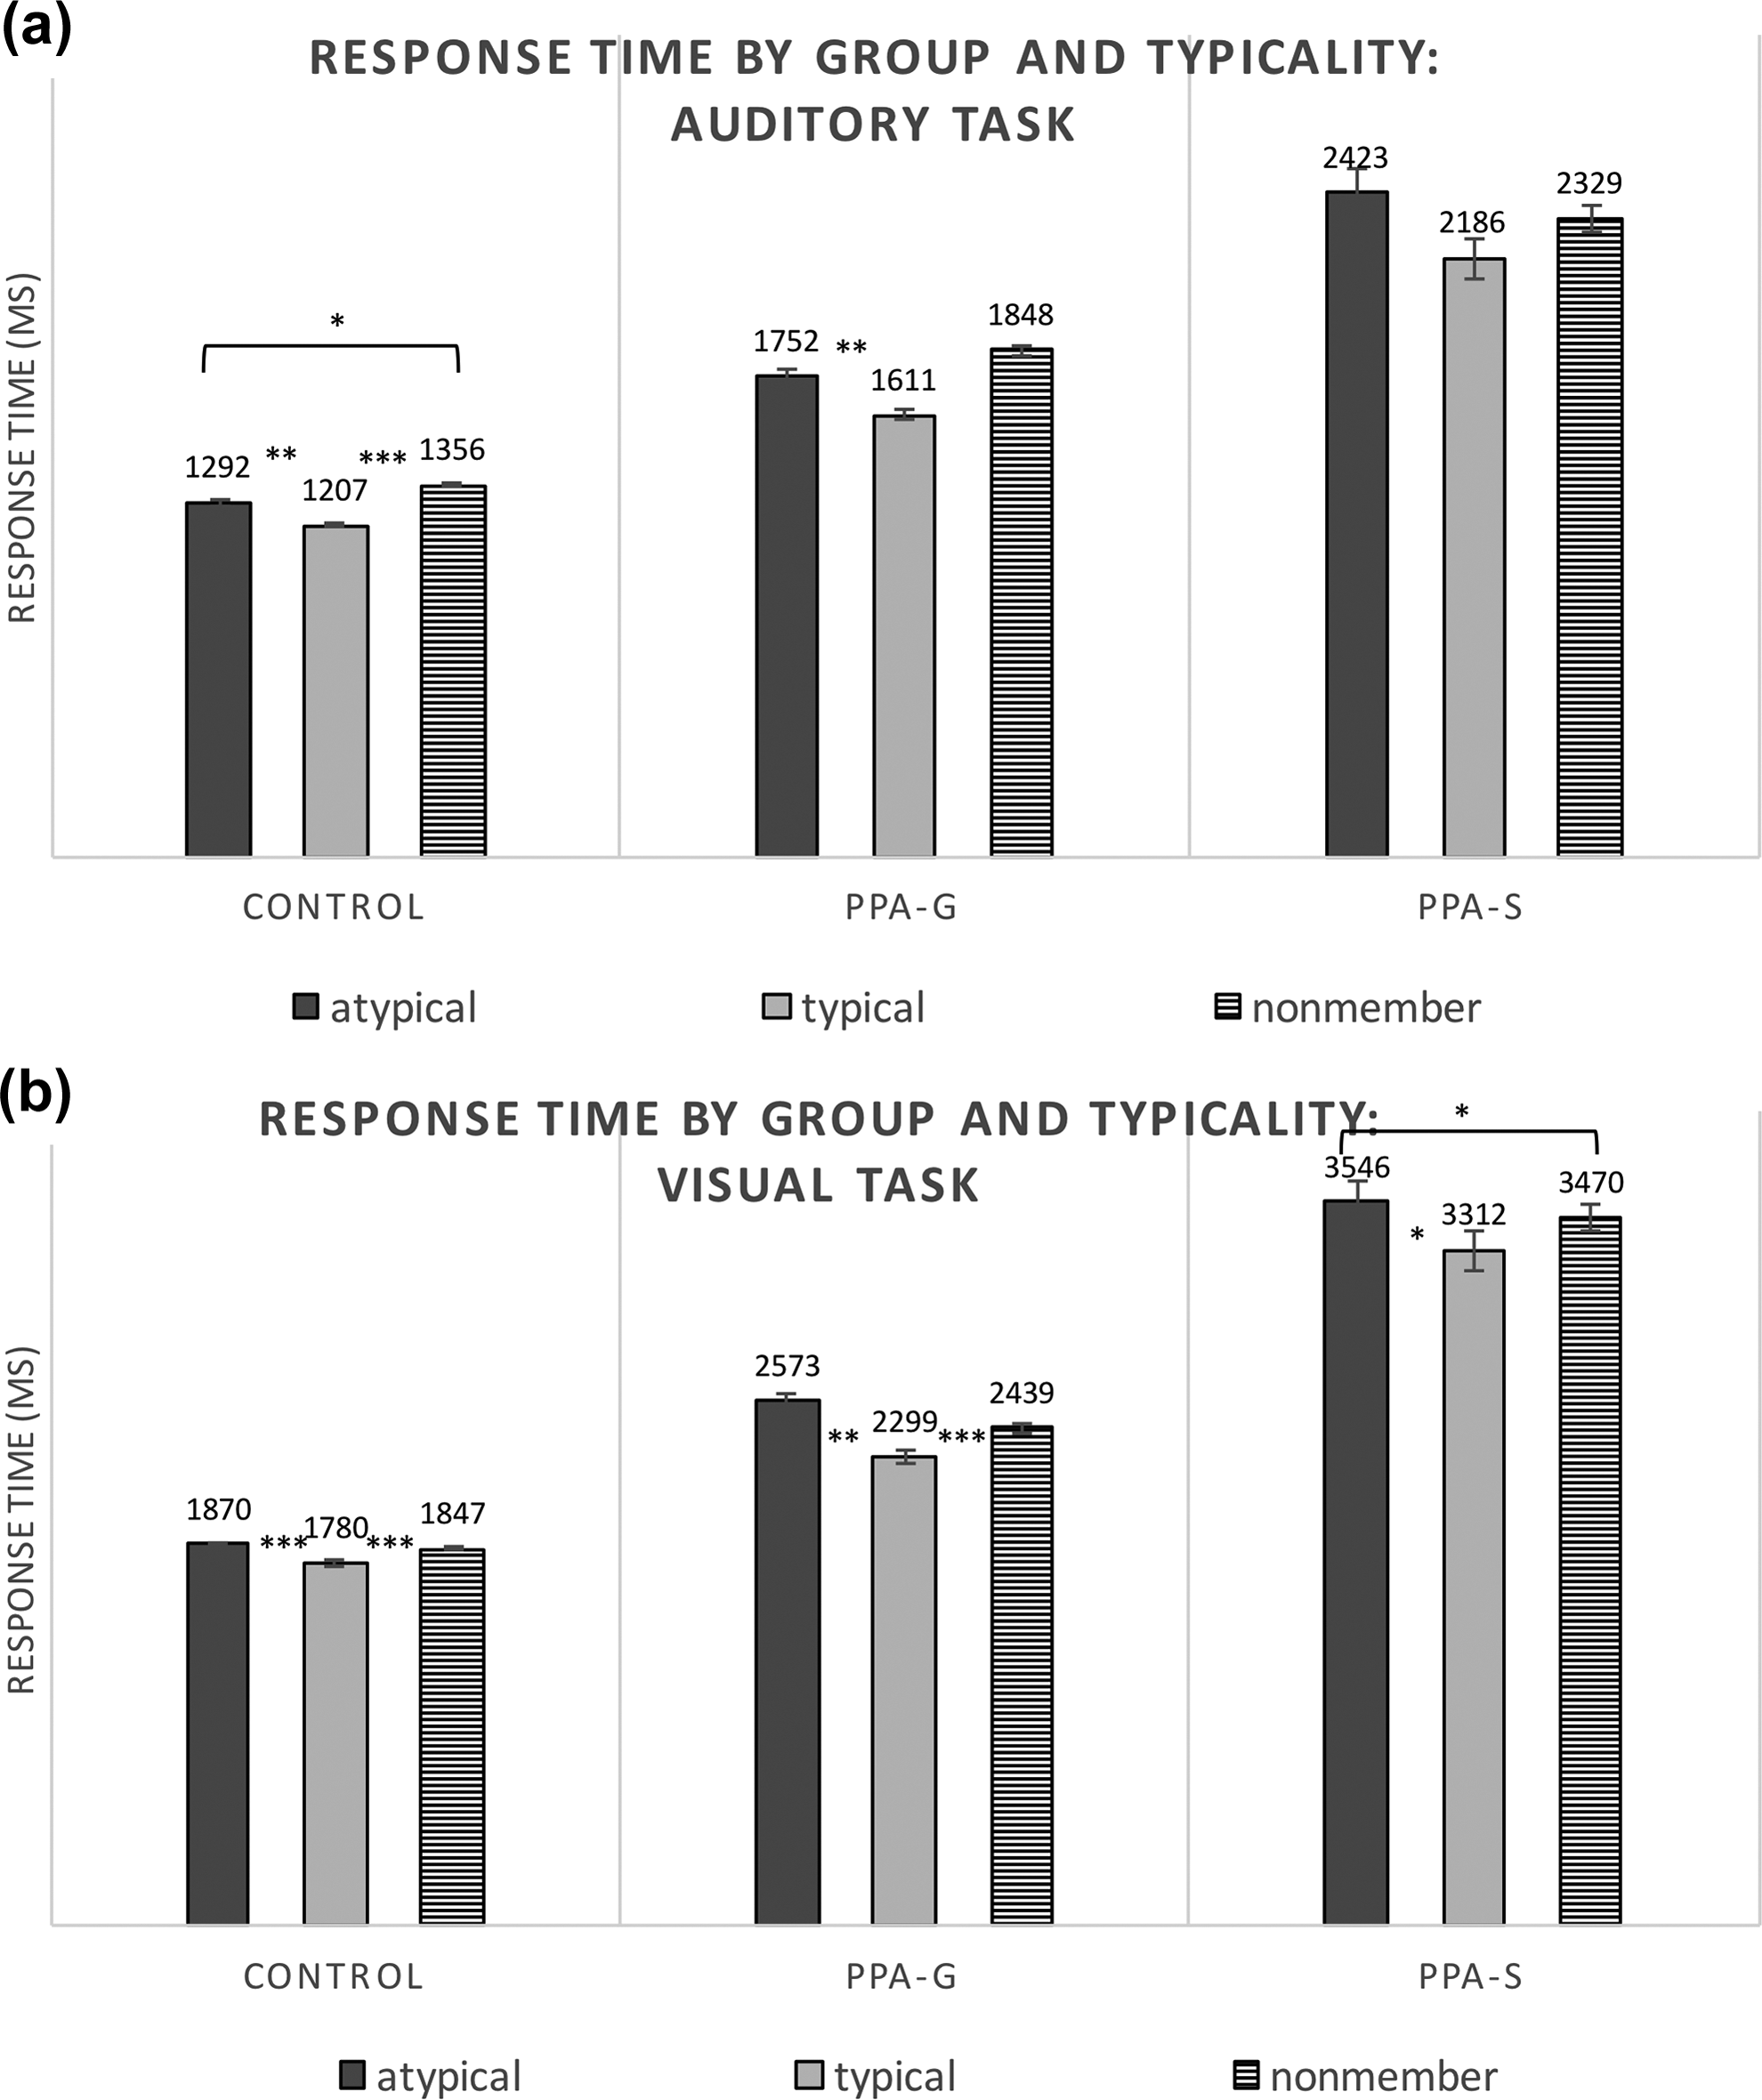
Response times across participant groups and typicality conditions for (a) auditory and (b) visual tasks. *P < .05, **P < .01, ***P < .001.
Within the control group, longer RTs were found for atypical and nonmember items than for typical items (ie, typicality effect), and this finding was consistent across both presentation modalities (auditory: typical>atypical, β = −.026, SE = 0.008, z = −3.155, P = .004; typical>nonmember, β = −.044, SE = 0.007, z = −6.185, P < .001; visual: typical>atypical, β = −.021, SE = 0.003, z = −5.902, P < .001, typical>nonmember, β = −.017, SE = 0.003, z = −5.821, P < .001). The PPA-G group showed a similar pattern to controls in the visual modality (typical>atypical, β = −.046, SE = 0.012, z = −3.908, P = .001, typical>nonmember, β = −.041, SE = 0.010, z = −4.245, P < .001), but for the auditory modality, the PPA-G group took longer to respond to atypical items only (typical>atypical, β = −.052, SE = 0.014, z = −3.618, P = .003, typical>nonmember, β = −.017, SE = 0.012, z = −1.419, not significant [ns]). In contrast to the control group, regression models for the PPA-G group across both modalities showed a significant Age × Typicality Category interaction, indicating that nonmember items elicited longer RTs than typical items more in older than in younger participants (auditory: nonmember>typical, β = .002, SE = 0.001, z = 3.384, P = .007; visual: nonmember>typical, β = .004, SE = 0.001, z = 3.092, P = .021).
Finally, results obtained from the visual version of the task indicate an interaction between age and performance on the PPVT, that is, age affected RTs to the task more for participants with lower (than higher) PPVT score (β = −.153, SE = 0.038, z = −4.061, P < .001). Because of this interaction, participants were divided into 2 subgroups by performing a median split based on the performance on the PPVT: participants with a score <35 were classified as having some semantic impairment, whereas participants who scored 35 and above on the PPVT were deemed as having intact semantics (highest possible score on the PPVT was 36). Separate models were implemented for these 2 subgroups: Although both groups still showed faster RTs to typical versus atypical items, a larger difference was found in the group with some semantic impairment (Figure 4b; typical>atypical, β = −.036, SE = 0.007, z = −4.877, P < .001) than in the group with intact semantics (Figure 4a; typical>atypical, β = −.022, SE = 0.007, z = −3.171, P = .01).
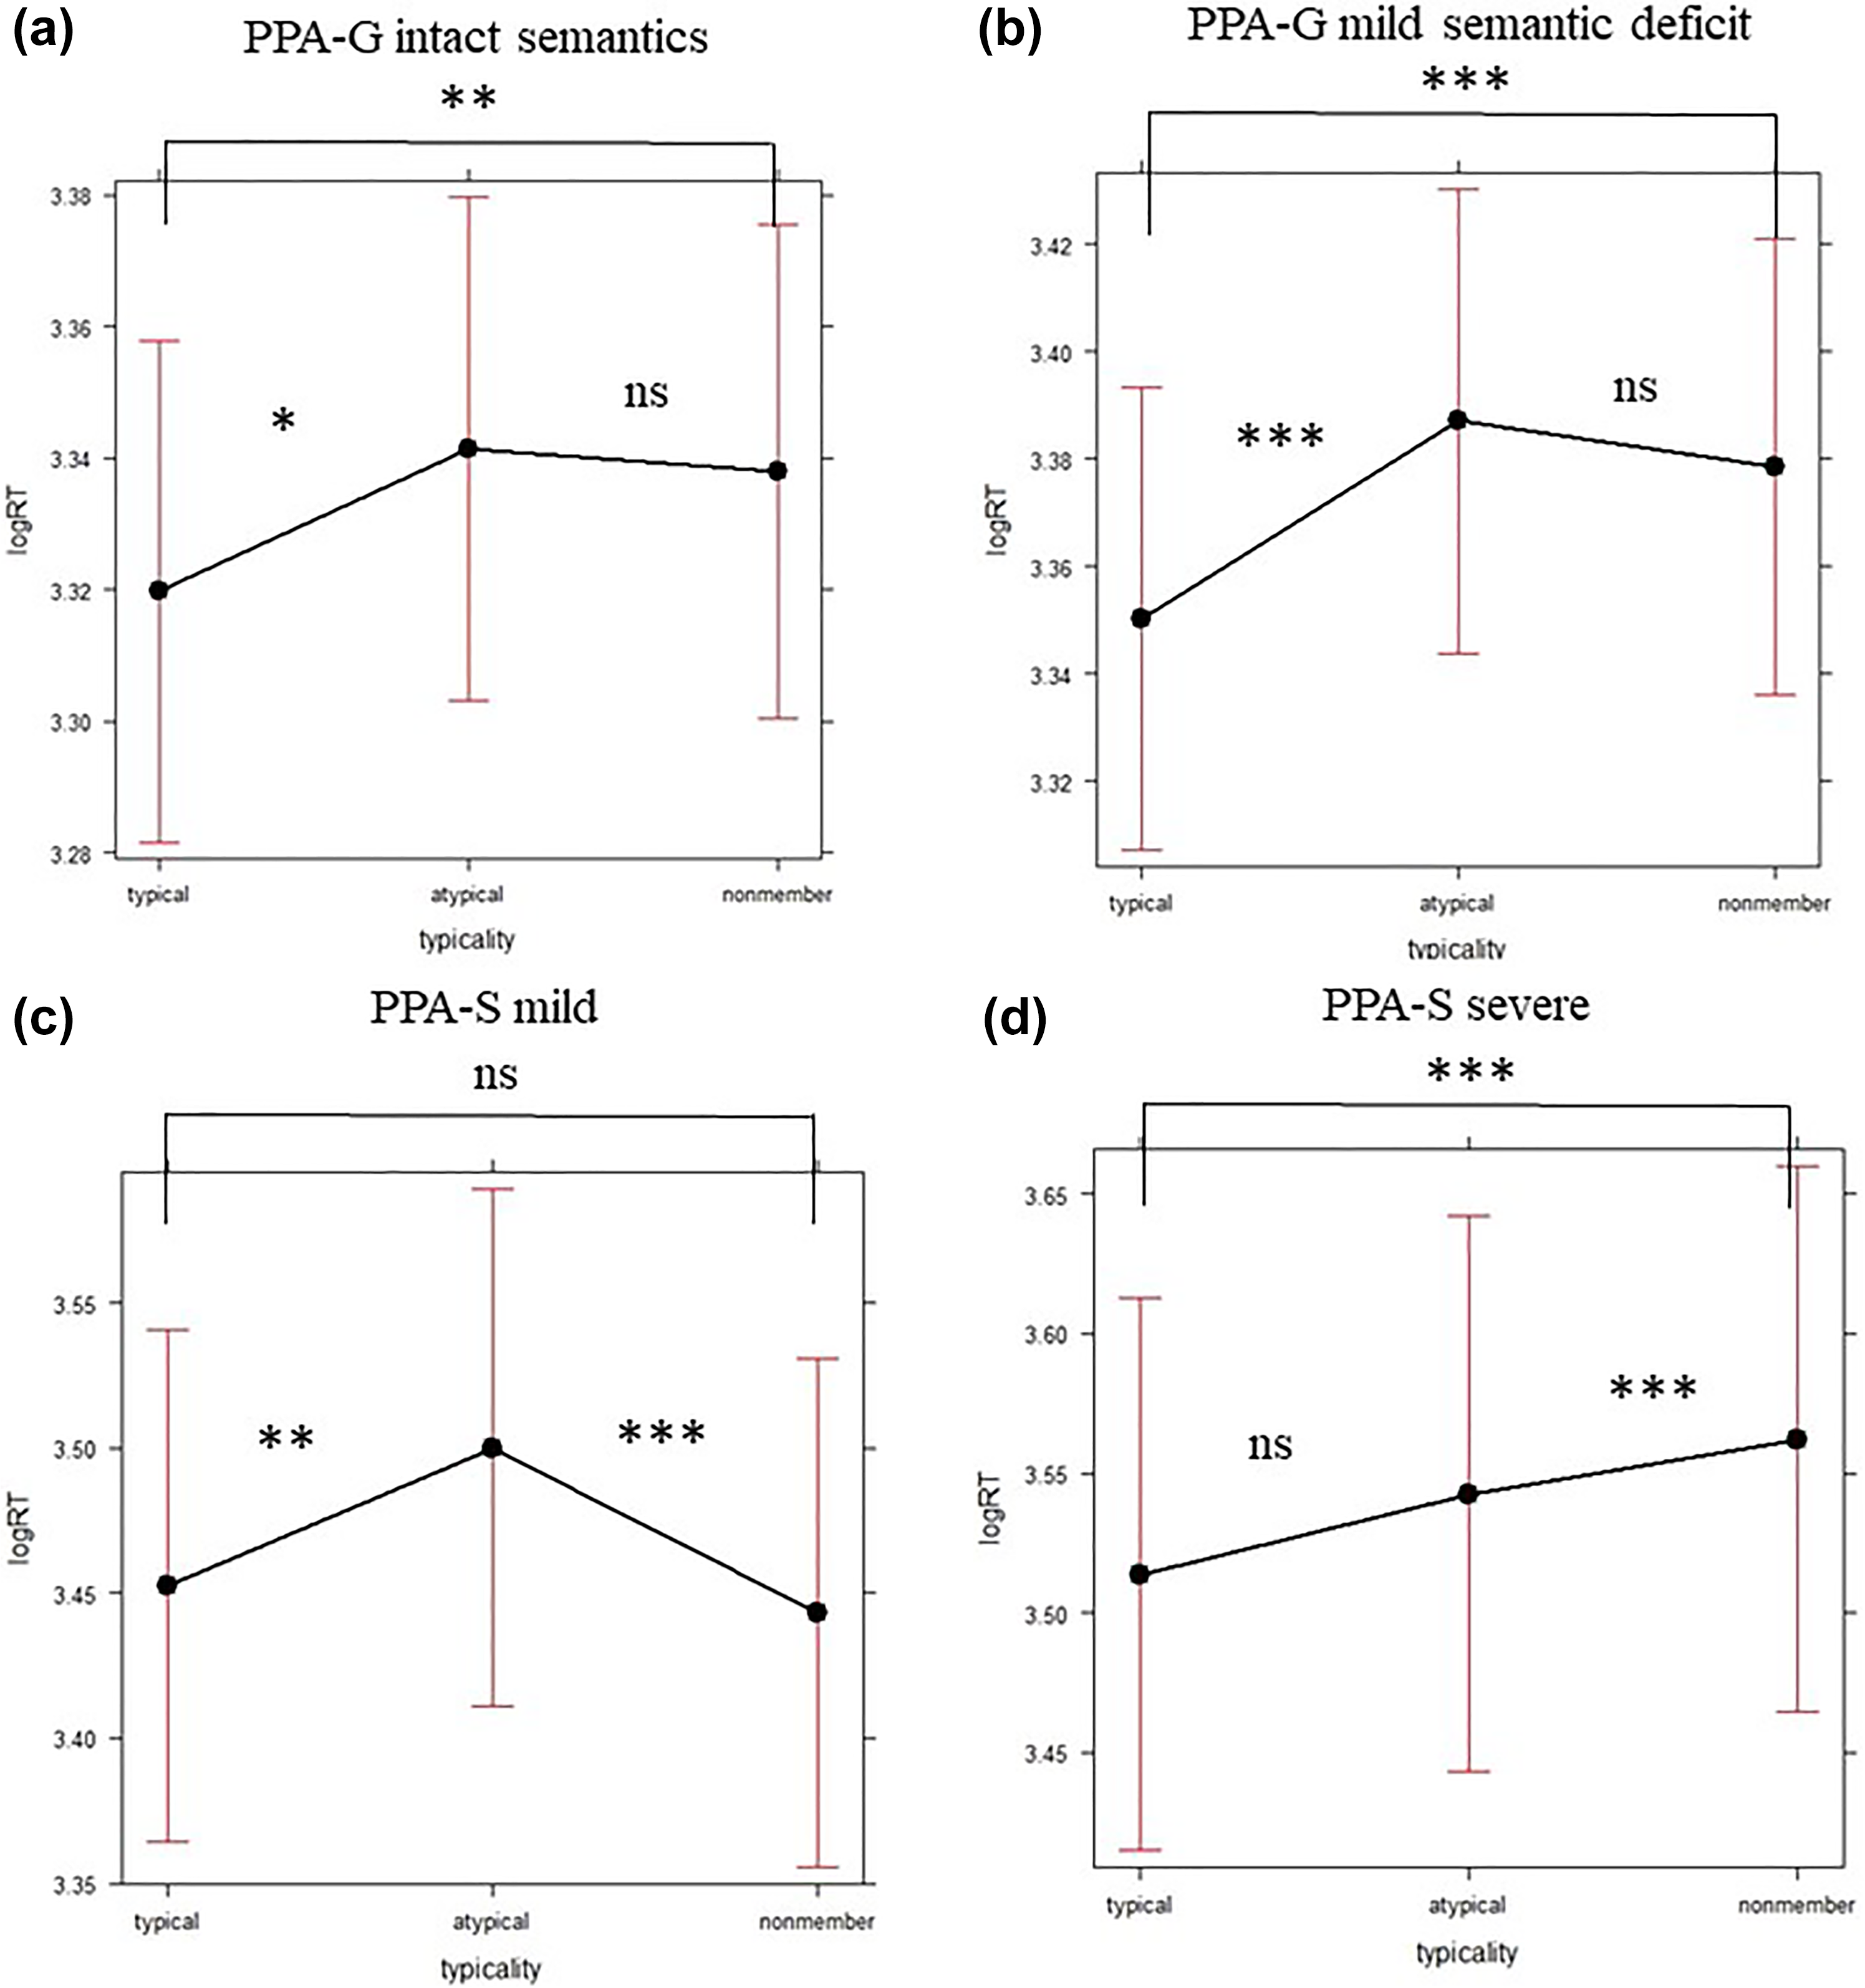
Response times across typicality conditions in the visual modality for (a) PPA-G participants with intact semantics, PPVT ≥35, (b) PPA-G participants with mild semantic deficit, PPVT <35, (c) PPA-S participants with mild semantic deficit, PPVT ≥19, (d) PPA-S participants with severe semantic deficit, PPVT <19. PPA-S indicates primary progressive aphasia-semantic; PPA-G, primary progressive aphasia-agrammatic.
Turning to participants in the PPA-S group, a significant typicality effect was found only in the visual modality (visual: typical>atypical, β = −.044, SE = 0.015, z = −2.858, P = .049; auditory: typical>atypical, β = −.040, SE = 0.018, z = −2.196, ns); in addition, typicality category interacted with performance on the PPVT in both modalities, thereby justifying a median split based on the PPVT score (median PPVT for PPA-S = 19), an indicator of severity in this group. Follow-up analyses on the 2 subgroups of PPA-S (ie, “mild” and “severe”) revealed a typicality effect that was consistent across modalities only in the “mild” group (Figure 4c; auditory: typical>atypical, β = −.033, SE = 0.012, z = −2.787, P = .034; visual: typical>atypical, β = −.043, SE = 0.013, z = −3.367, P = .005). Participants in the “severe” group instead showed no typicality effect in either modality (Figure 4d; auditory: typical>atypical, β = −.044, SE = 0.025, z = −1.76, ns; visual: typical>atypical, β = −.020, SE = 0.018, z = −1.118, ns) and rather exhibited longer RTs to nonmember items than to other items (auditory: nonmember>atypical, β = .141, SE = 0.026, z = 5.416, P < .001; nonmember>typical, β = .185, SE = 0.025, z = 7.393, P < .001; visual: nonmember>atypical, β = .094, SE = 0.021, z = 4.377, P < .001; nonmember>typical, β = .114, SE = 0.020, z = 5.574, P < .001). Finally, only within the “severe” group, a significant interaction typicality*age was found, indicating that the longer RTs to nonmembers compared to typical and atypical items were mainly driven by older participants.
Discussion
Results of the current study showed that control and PPA-G groups were highly accurate in all categories and in both visual and auditory conditions. Although significantly less accurate than the age-matched control group, the PPA-G group still performed with over 94% accuracy across conditions.
In contrast to the other 2 participant groups, accuracy was much lower overall for the PPA-S group, consistent with the general semantic processing impairments seen in PPA-S. The PPA-S group performed poorly on both atypical (65% correct) and typical (77% correct) items but performed somewhat better on nonmember items (85% correct). Notably reduced accuracy was noted in both auditory and visual conditions, indicating that PPA-S impairments are not modality specific. The interaction between group, age, and typicality in the PPA-S group further showed that the PPA-S participants who had higher PPVT scores (ie, lesser semantic impairment) showed a typicality effect (ie, better accuracy on typical items as compared to atypical items) as did the PPA-G and control participants. However, those with lower PPVT scores (ie, greater semantic impairment) did not show a typicality effect. That is, there were no significant differences in accuracy between typical and atypical items. This finding suggests that as the semantic impairment in PPA-S worsens, intracategory distinction between items (ie, semantic blurring) becomes more impaired.
Turning to response time patterns across conditions and participant groups, the control group showed longer response times (RTs) for atypical items and nonmember items than they did for typical items (ie, typicality effect), which was consistent in both auditory and visual modalities. The PPA-G group showed a similar pattern to controls in both modalities. The interaction between age and PPVT in the PPA-G group motivated a separate model for the PPA-G group, splitting the PPA-G group into those with PPVT scores above the median score (ie, unimpaired semantic processing) and those with PPVT scores lower than the median (ie, mild semantic impairment). Results showed that both PPA-G subgroups showed faster responses on typical items when compared to atypical items (ie, typicality effect). These findings suggest that even PPA-G patients with mild semantic impairment retain intracategory distinctions between typical and atypical items.
The PPA-S group was significantly slower to respond, but as a group still showed a typicality effect (ie, faster RTs for typical vs atypical items), but only in the visual modality. Interestingly, when investigating the interaction between typicality and PPVT, the PPA-S participants with lower PPVT scores did not show significant RT differences between typical and atypical items for either modality (ie, no typicality effect), whereas PPA-S participants with higher PPVT scores (ie, milder semantic impairments) showed patterns resembling controls and PPA-G participants (ie, typicality effect) for both modalities. The patterns we observe from examining response times are consistent with our accuracy results, supporting an increasing lack of intracategory distinction between items (ie, semantic blurring) as the semantic impairment in PPA-S becomes more severe.
Because the current study focused on testing verbal, lexical–semantic processing, we are unable to provide any further insight into the question of whether individuals with PPA-S demonstrate difficulty with nonverbal semantic processing. Our results do, however, provide new evidence pertaining to input modality. Individuals with severe PPA-S had difficulty processing semantic information regardless of sensory input modality. One critical reason to examine differences in input processing is to determine whether one modality-specific route offers better access to semantic knowledge. Due to individual variability, group studies like this one are not able to address this issue directly. If dissociation between modalities is present, this information could be clinically useful on a case-by-case basis.
The findings of this study also suggest a possible mechanism for the “blurring” effect observed in PPA-S. Examples of within-category semantic paraphasias in naming tasks as well as semantically related incorrect responses to picture/word-matching tasks have suggested that individuals with PPA-S are able to access the correct superordinate category for an item but experience within-category processing difficulties. 11 One proposed explanation for these findings is that semantic feature boundaries are “blurred” within superordinate categories in PPA-S, but erred items appear to be relatively random. 11 Our findings suggest that word comprehension ability, at least in part, is associated with a blurring of semantic features of both typical and atypical items within categories and that this dimension of lexicality may underlie word comprehension deficits in PPA-S demonstrated in other studies. 18,19
Footnotes
Acknowledgments
The authors would like to thank Jim Kloet and Sladjana Lukic, PhD for their assistance with data collection and analysis.
Declaration of Conflicting Interests
The authors declared no potential conflict of interest with respect to the research, authorship, and/or publication of this article.
Funding
The authors disclosed receipt of the following financial support for the research and/or authorship of this article: This project was funded by the National Institute on Deafness and Communication Disorders (R01 DC0088552, PI: Mesulam) and the National Institute on Aging (P30 AG013854, PI: Mesulam).