
Abstract
Background:
Oxidative stress (OS) is a physiological age-related brain process, dramatically overexpressed in neurodegenerative disorders like Alzheimer’s disease (AD). Nevertheless, the pathophysiological role of OS in AD pathology has not been clarified yet. OS as a biomarker for AD is a controversial issue. A comparison of previous data is difficult due to a remarkable methodological variability. Most of the previous studies have shown higher levels of OS markers and lower antioxidant power in patients with dementia when compared to mild cognitive impairment (MCI) and healthy controls.
Methods:
We followed a strict protocol in order to limit intrasite variability of OS assessment. In addition, we have taken into account possible confounding factors.
Results:
In agreement with previous reports, we found both lower plasmatic OS and higher plasmatic antioxidant defenses when comparing patients with AD having dementia that is stably treated to patients with MCI-AD.
Discussion:
A speculative hypothesis based on correlative data is provided.
Keywords
Introduction
Oxidative stress (OS) occurs when reactive oxygen species (ROS) and reactive nitrogen species (RNS) production are not adequately counterbalanced by endogenous antioxidant defense mechanisms. 1,2 The OS is a physiological age-related brain process, which several studies found to be dramatically overexpressed in neurodegenerative disorders, like Alzheimer’s disease (AD) from asymptomatic stages. 3 -5 To date, it is not clear whether OS, in AD, is a cause or a consequence of the main neuropathological mechanisms involved (protein misfolding, neuroinflammation, mitochondrial dysfunction) and how it interacts with them. 6 -10
Given the key role OS might have in AD pathogenesis and disease progression, 11,12 it has been proposed as a novel candidate biomarker, especially in prodromal stage of the disease.
Previous studies on this topic showed high heterogeneity in many aspects: patients’ enrollment criteria and possible confounding factors for which a possible influence on the OS levels has already been demonstrated.
This study aims to compare plasma levels of OS biomarkers in patients with AD having mild-to-moderate dementia (AD) stably treated with antidementia therapies, patients with mild cognitive impairment (MCI) due to AD (MCI-AD), and healthy controls (HC) matched for age and sex while taking into account many possible confounding factors. In detail, we compared baseline advanced oxidation protein products (AOPP; markers of oxidative damage to proteins), ferric reducing antioxidant power (FRAP; marker that identifies an estimate of the total antioxidant power), and –SH (significant component of nonenzymatic antioxidant barrier) 13 -16 in the 3 subgroups.
Patients and Methods
Patients
We retrospectively identified outpatients with AD (N = 30) and MCI-AD (N = 29) from our Centre for Cognitive Disorders, among the patients who had underwent assessment of OS plasma levels between November 2013 and January 2014.
All patients had a diagnosis of either AD or MCI-AD according to the National Institute on Aging–Alzheimer’s Association diagnostic criteria. 17,18 All patients with AD recruited had been on stable antidementia therapies for at least 3 months when laboratory tests were performed (for demografic and clinical data, see Table 1).
Demographic/Clinical Data of Patients With AD, MCI-AD, and Healthy Controls.a
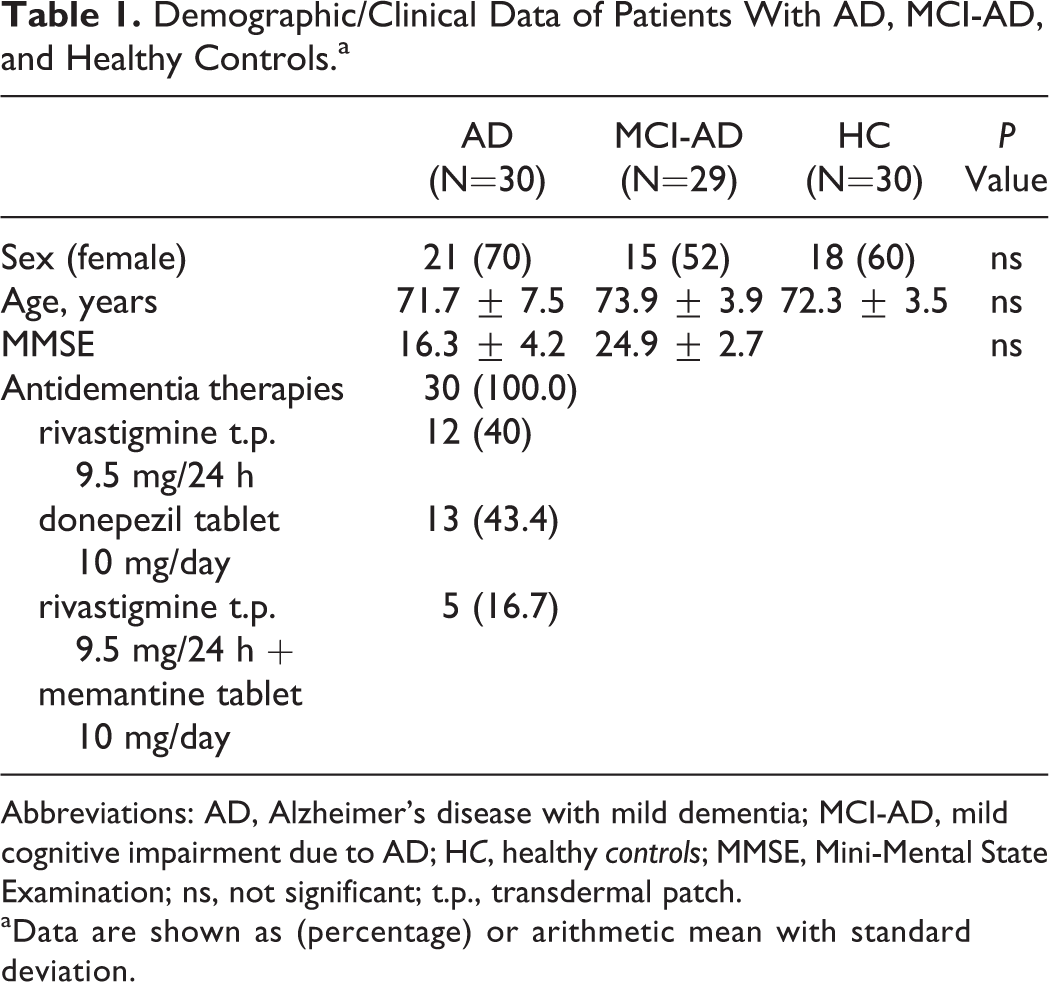
Abbreviations: AD, Alzheimer’s disease with mild dementia; MCI-AD, mild cognitive impairment due to AD; HC, healthy controls; MMSE, Mini-Mental State Examination; ns, not significant; t.p., transdermal patch.
aData are shown as (percentage) or arithmetic mean with standard deviation.
Patients with MCI-AD recruited for this study were those patients among the MCI group who converted to dementia within 24 months after sample collection. None of the patients with MCI-AD was receiving or previously received antidementia treatment at the time of sample collection.
Exclusion criteria were the presence of a moderate–severe white matter lesions (WML) load 19 and/or a Clinical Dementia Rating Scale score higher than 2. Both patients with AD and MCI-AD underwent apolipoprotein E (ApoE) genotyping within the diagnostic workup for dementia.
The HC (N = 20) enrolled were age- and sex-matched people not genetically related to patients and without a family history of neurodegenerative cognitive decline. Data were obtained from previous studies approved by the local ethics committee. 13,14 All participants had provided a valid written informed consent before blood samples. Among the most relevant modifiable risk factors for AD, those for which a possible influence on OS levels is reported were accurately recorded 20 -29 (see Table 2).
Possible Confounding Factors Explored.a
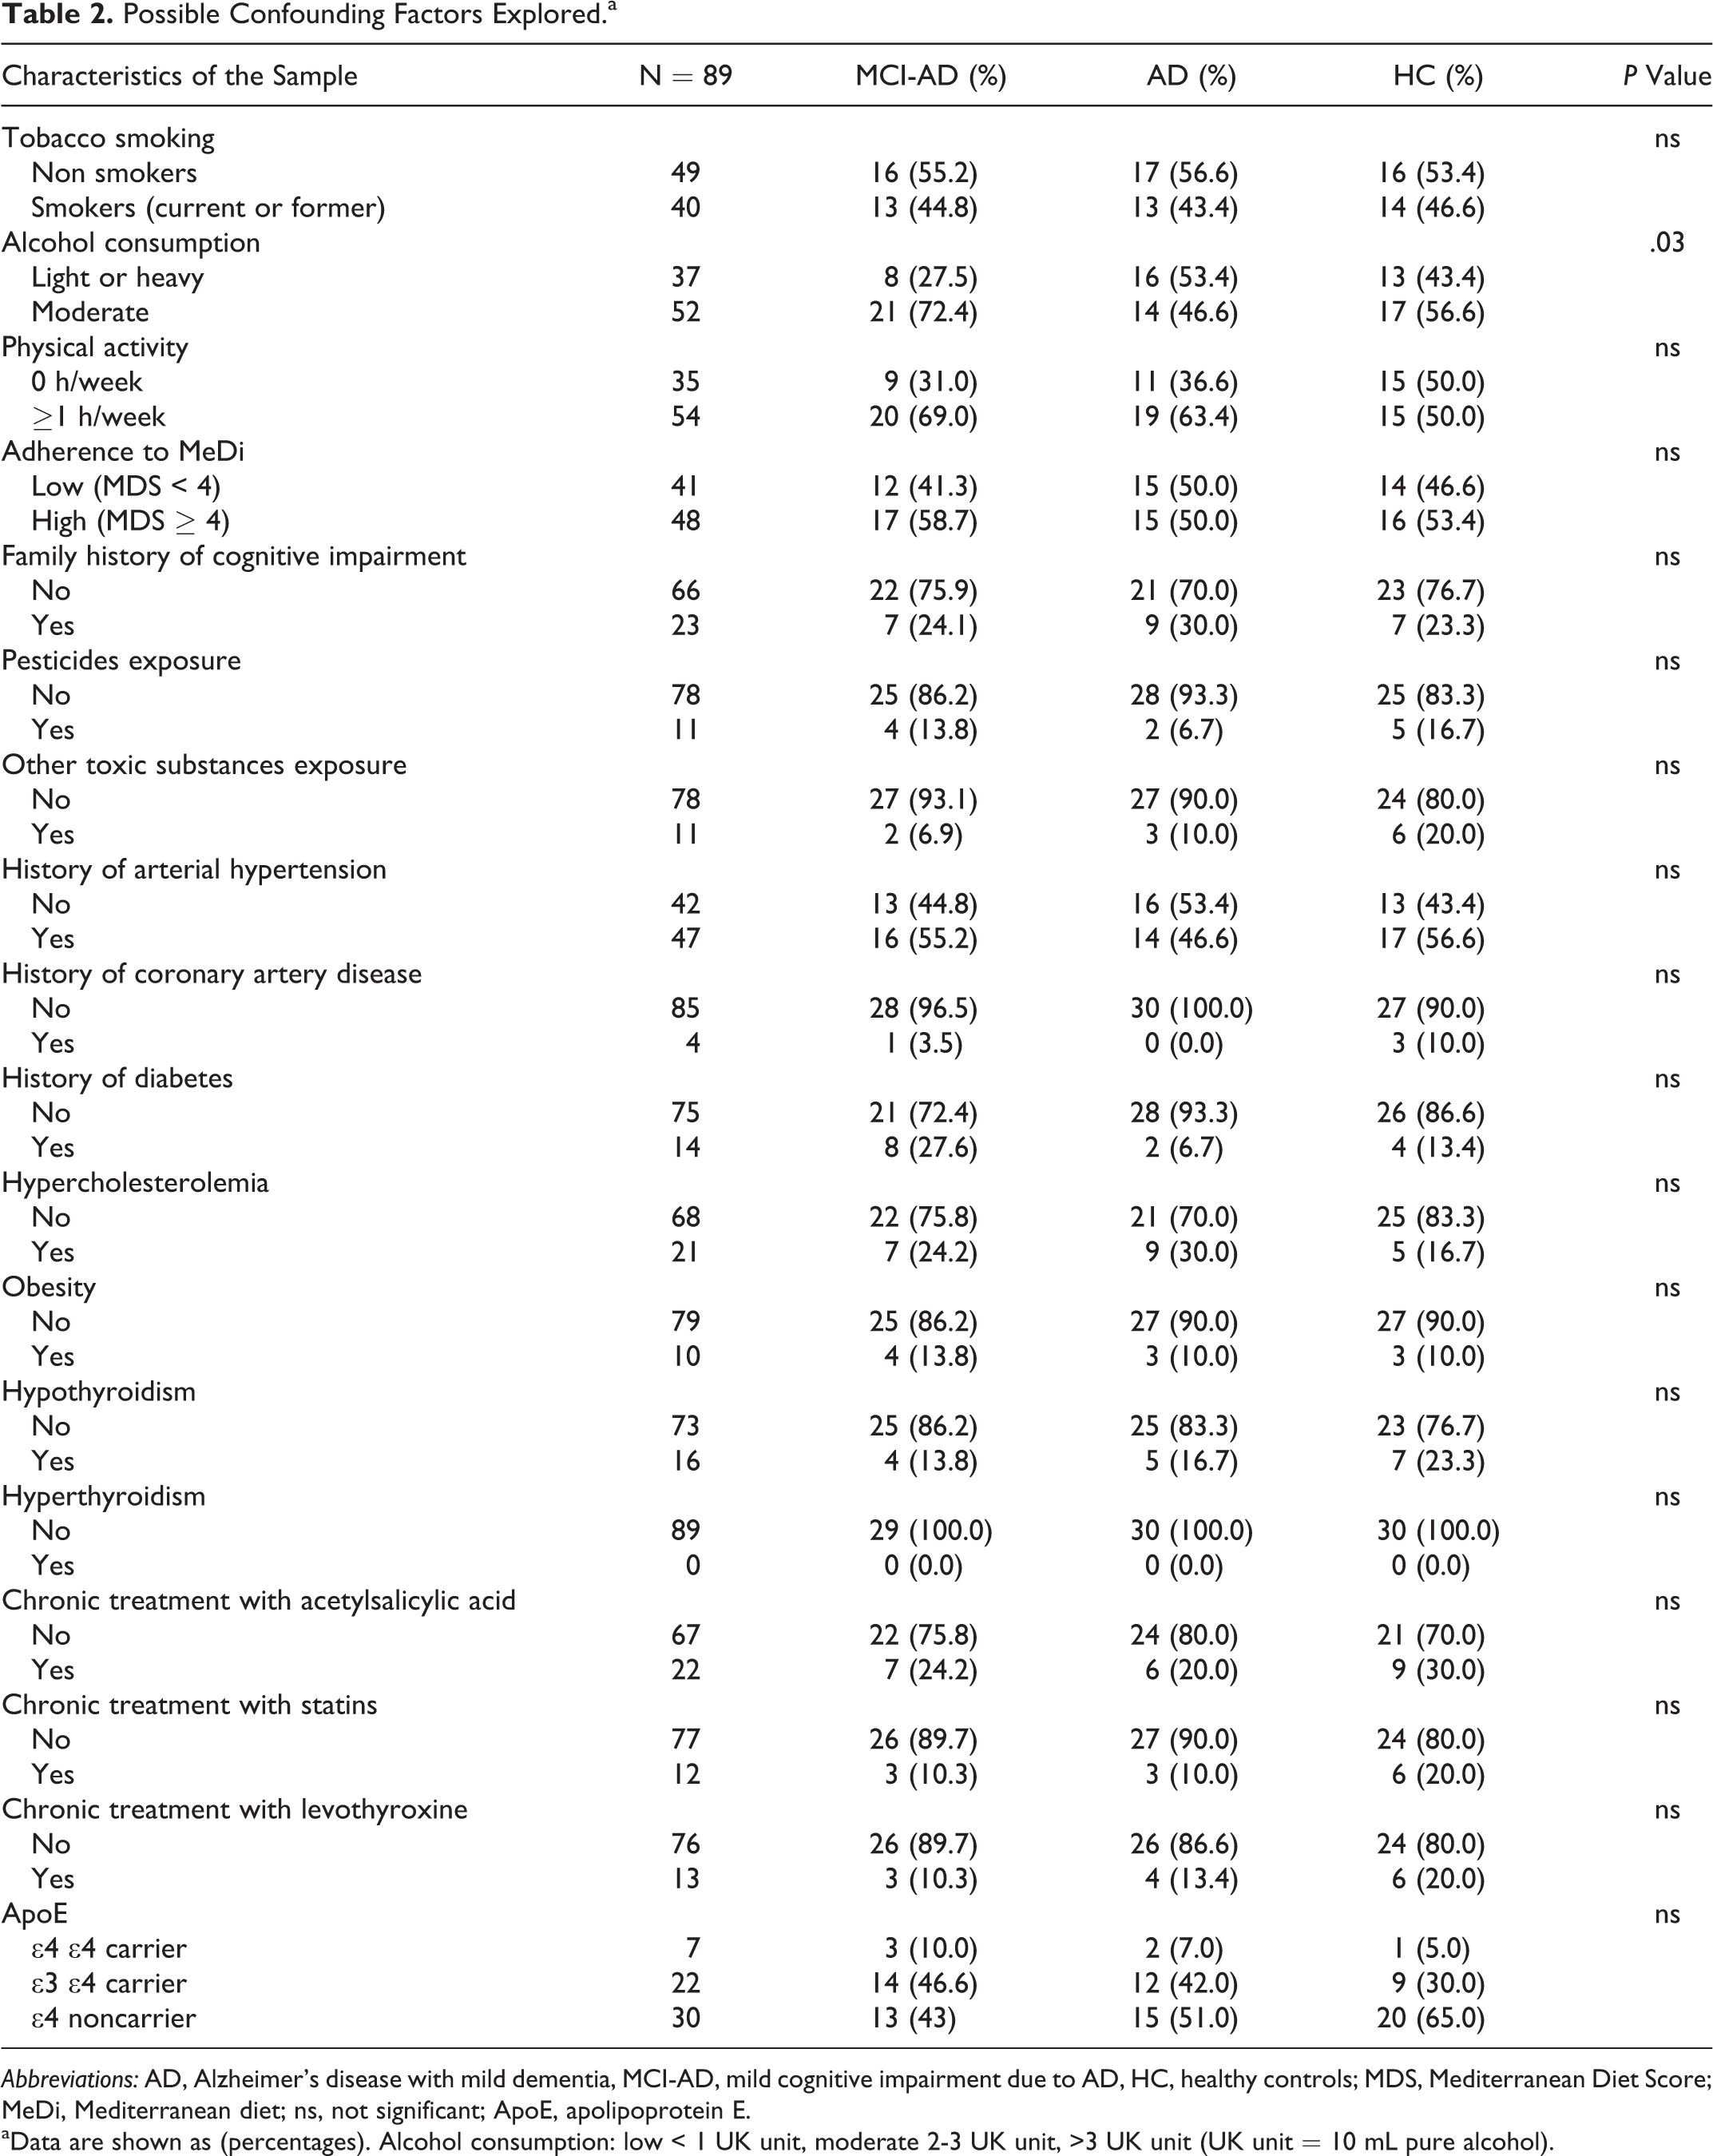
Abbreviations: AD, Alzheimer’s disease with mild dementia, MCI-AD, mild cognitive impairment due to AD, HC, healthy controls; MDS, Mediterranean Diet Score; MeDi, Mediterranean diet; ns, not significant; ApoE, apolipoprotein E.
aData are shown as (percentages). Alcohol consumption: low < 1 UK unit, moderate 2-3 UK unit, >3 UK unit (UK unit = 10 mL pure alcohol).
Plasmatic OS Assessment
Plasmatic levels of AOPP, FRAP, and –SH were determined in patients with AD, MCI-AD, and HC. Blood venous samples were collected at early morning, shortly after a light breakfast. Samples were centrifuged at 3000rpm for 10 minutes at 4°C within 2 hours after collection and analyzed within 1 month after collection. AOPP, FRAP, and –SH were determined as described elsewhere 13,14 (see Supplementary Materials). All procedures were performed at our Neurology Unit Laboratory.
Statistical Analysis
Chi-square test with continuity correction or Fisher exact test was utilized for comparison of categorical variables, whereas Mann-Whitney U test or t test (paired or unpaired) was used for comparison of continuous variables. In order to test the hypothesis that diagnosis (AD, MCI-AD, and HC) and each possible confounding factor had an effect on levels of OS biomarkers, a one-way analysis of variance was performed. Significant differences between means were assessed using Fisher least square differential post hoc test. Spearman rank-order correlation was utilized for comparison of continuous variables and OS levels. All significant results on OS biomarkers investigated were adjusted for age, gender, and each possible confounding factor using linear regression. All tests were 2-tailed, and P values <.05 were considered statistically significant. The statistical analysis was carried out using SPSS version 16.0 for Windows.
Results
Plasmatic levels of AOPP, FRAP, and –SH were assessed in 30 patients with AD, 29 patients with MCI-AD, and 30 HC (see Table 3). Among possible confounding factors, we found a significantly higher moderate alcohol consumption in patients with MCI-AD compared to those with AD (P = .03), see Table 2 for more details.
Plasmatic levels of AOPP, FRAP, and –SH in AD, MCI-AD, and HC.a
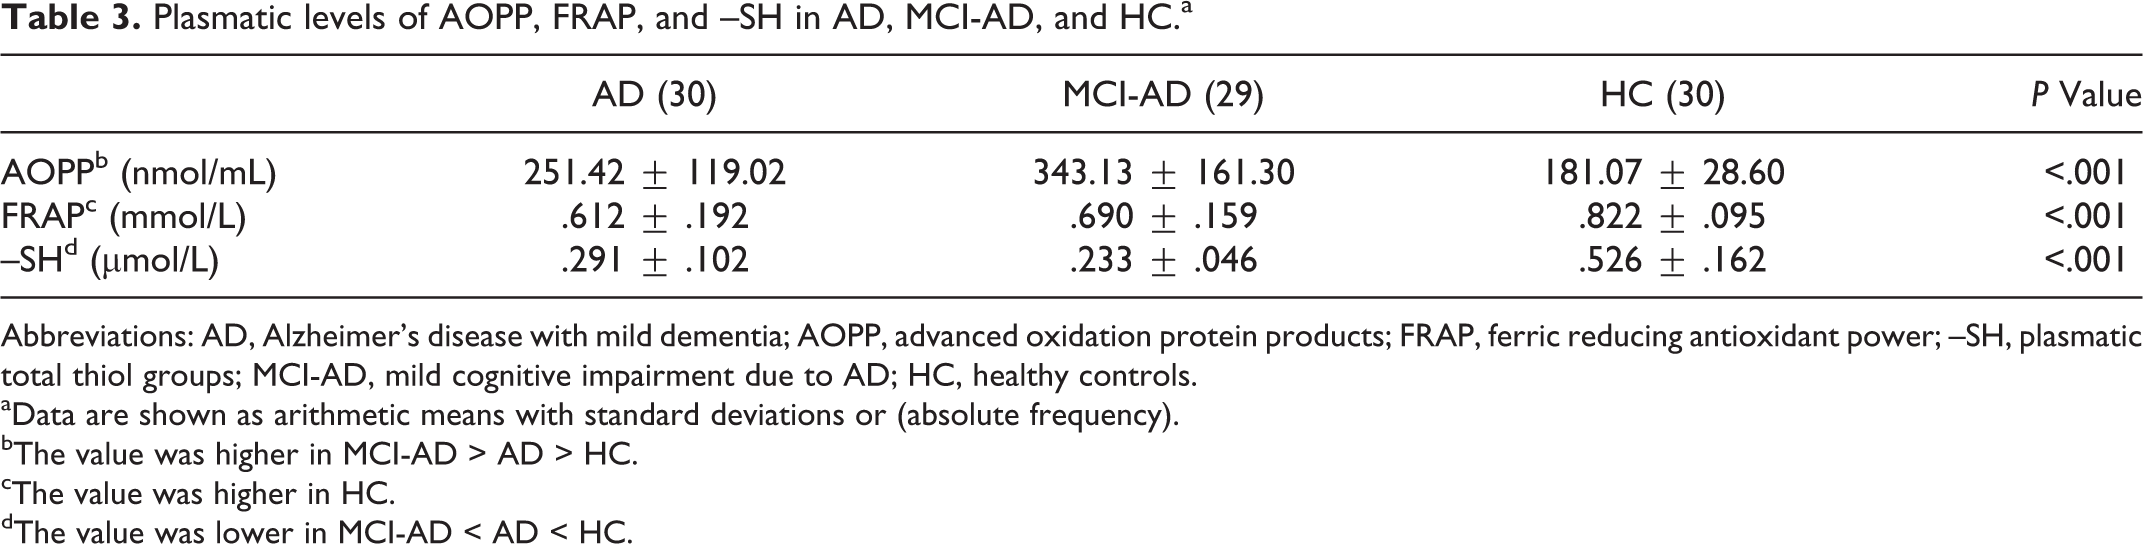
Abbreviations: AD, Alzheimer’s disease with mild dementia; AOPP, advanced oxidation protein products; FRAP, ferric reducing antioxidant power; –SH, plasmatic total thiol groups; MCI-AD, mild cognitive impairment due to AD; HC, healthy controls.
aData are shown as arithmetic means with standard deviations or (absolute frequency).
bThe value was higher in MCI-AD > AD > HC.
cThe value was higher in HC.
dThe value was lower in MCI-AD < AD < HC.
As shown in Table 3, HC had lower AOPP levels than those with MCI-AD (P = .022) and AD (P < .001), while patients with MCI-AD showed higher AOPP levels than AD (P = .009; Figure 1A). The FRAP was higher in HC compared to both patients with AD (P < .001) and MCI-AD (P = .001), without significant differences between MCI-AD and AD (Figure 1B). Regarding -SH, HC showed higher levels compared to both AD (P < .001) and MCI-AD (P < .001), but we found no significant differences between AD and MCI-AD (P = .057; Figure 1C). All significant results on OS levels were similar after correction for each possible confounding factor. None of the possible confounding factor was correlated with any of the evaluated OS biomarkers.
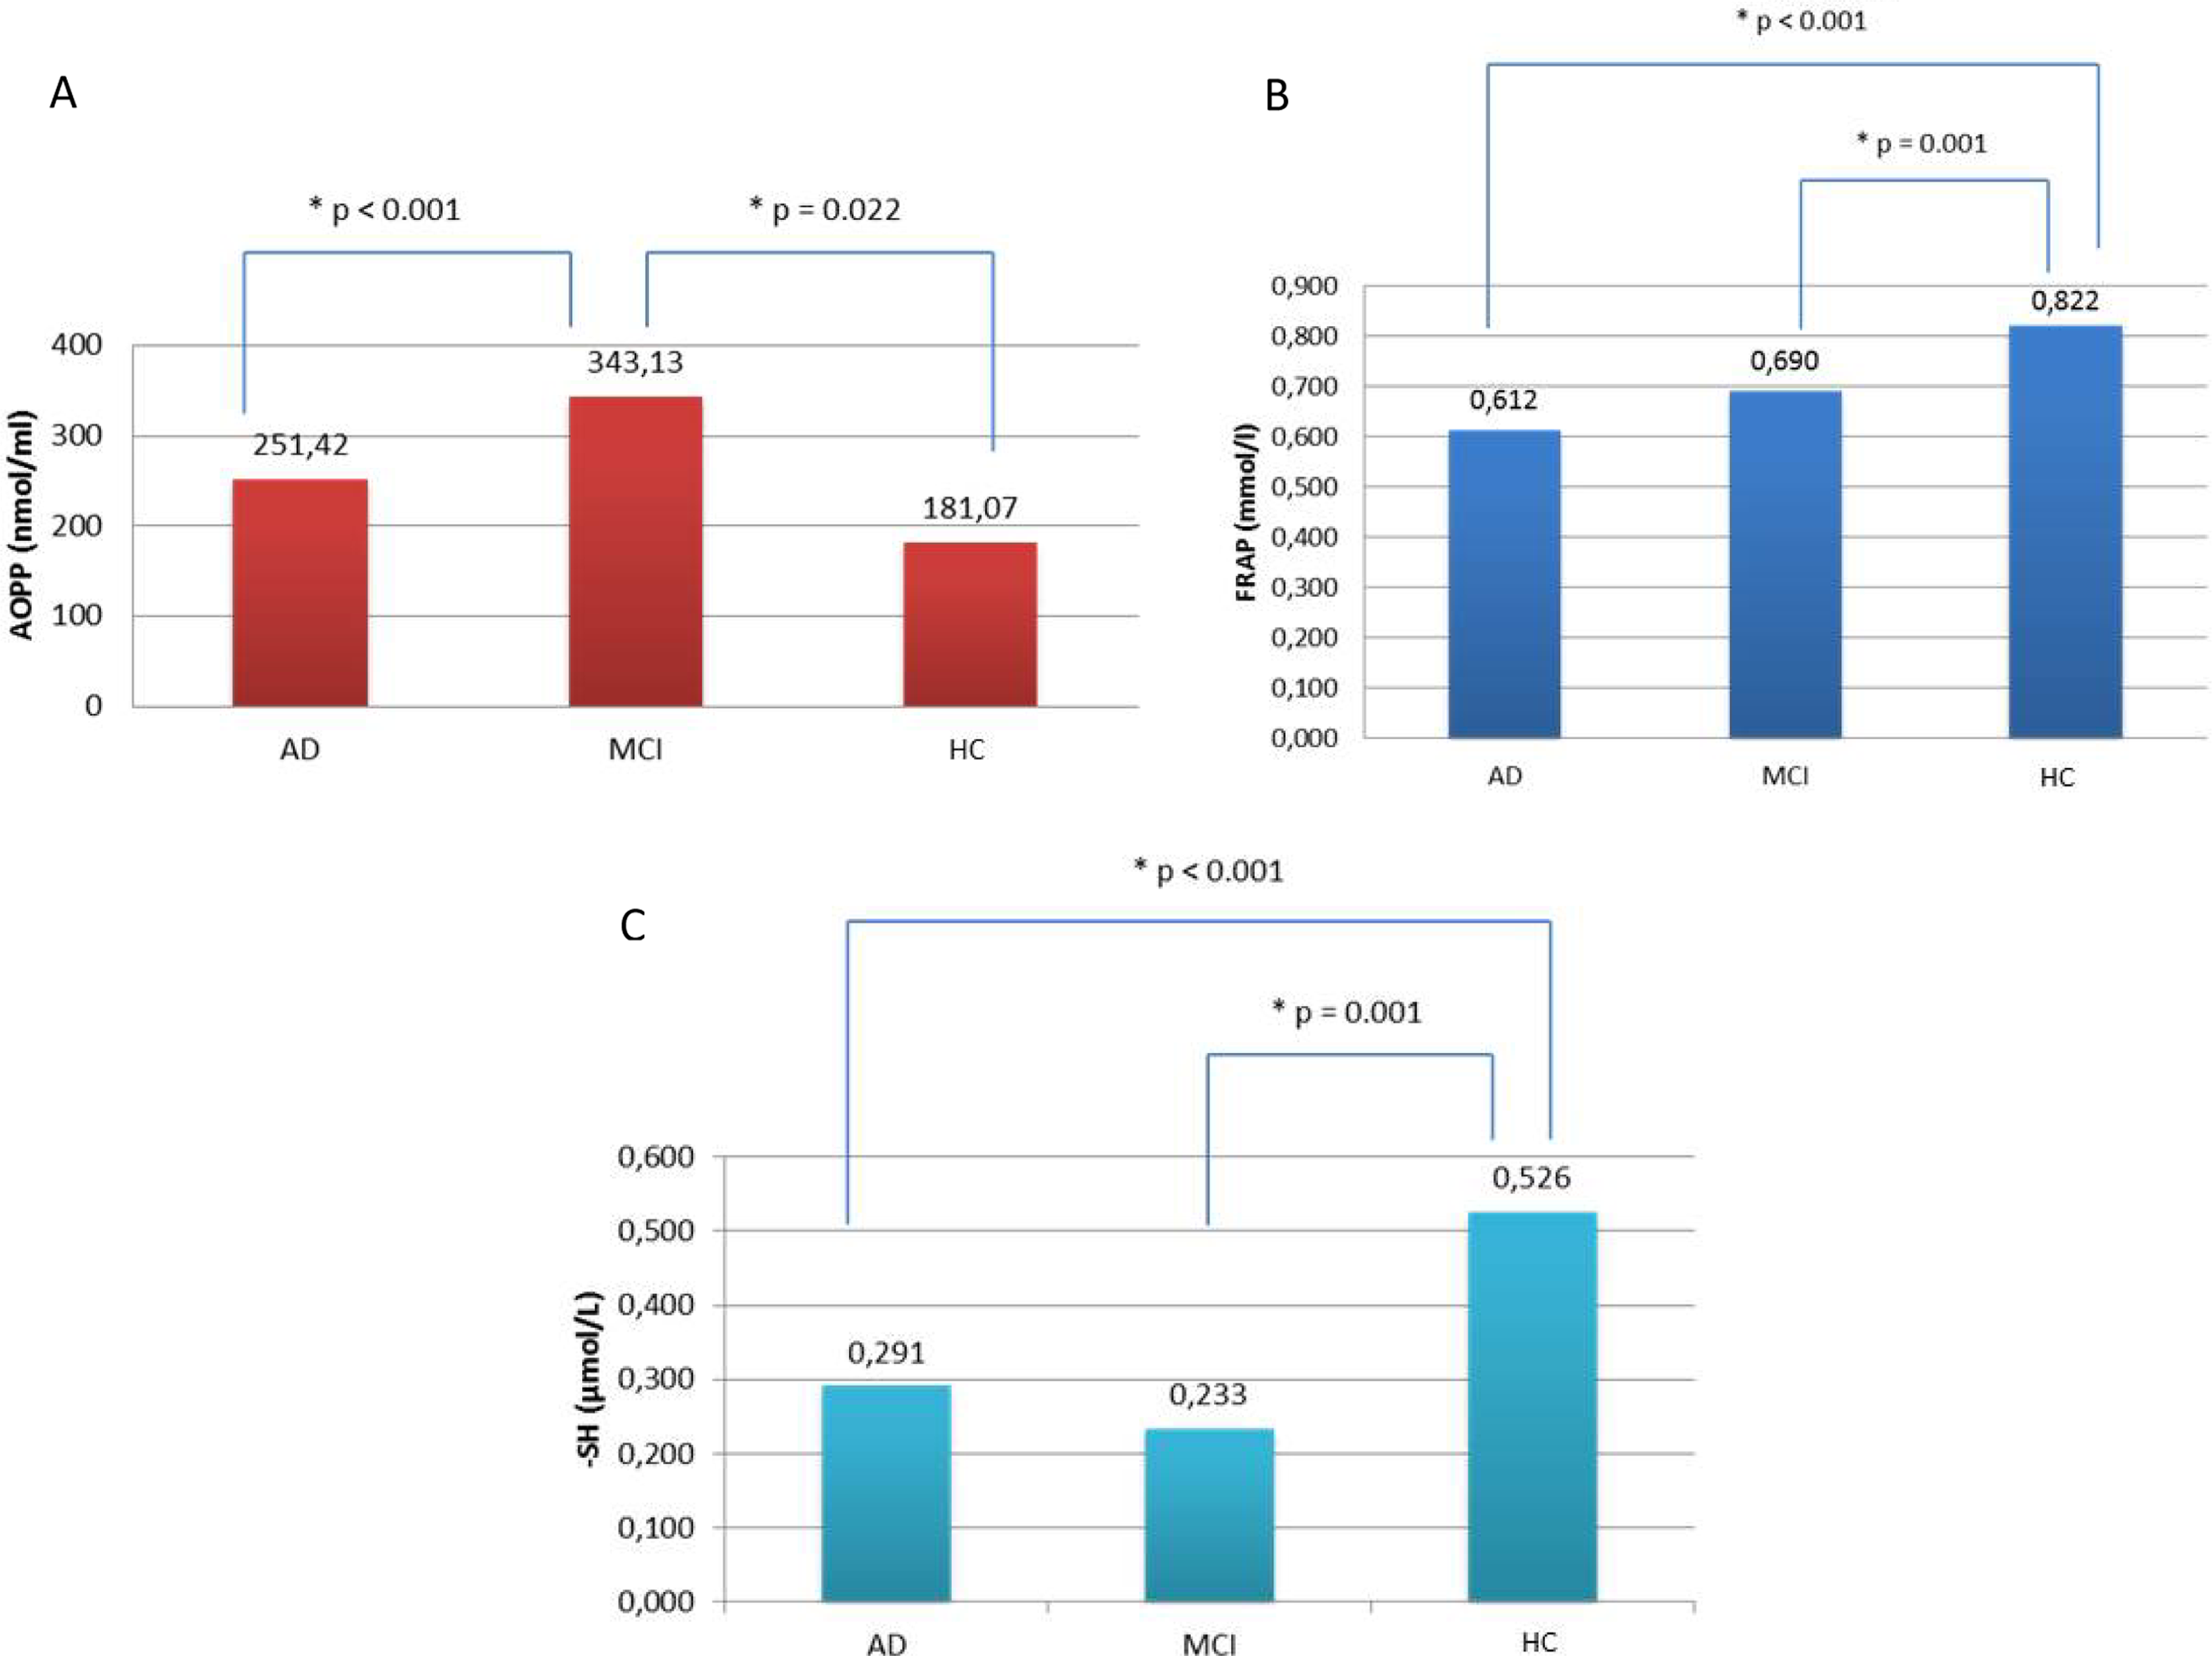
(A) The advanced oxidation protein products (AOPP) value was higher in mild cognitive impairment due to AD (MCI-AD) > Alzheimer disease with mild dementia (AD) > healthy controls (HC). (B) The ferric-reducing antioxidant power (FRAP) value was higher in HC. (C) The plasmatic total thiol groups (–SH) value was lower in MCI-AD < AD < HC.
Discussion
The ideal biomarker should be minimally invasive, inexpensive, practical, rapid, and reliable with low level of expertise required. Therefore, plasmatic OS assessment could be a good candidate as a novel biomarker for AD in clinical practice. 13,14,30 -34
In our study, we showed a higher OS in patients with MCI than in patients with AD and HC; antioxidant power was similar in both patients with MCI and AD and higher in HC. It is difficult, though, to compare ours with previous data 6 -10 due to high heterogeneity in protocols adopted from patient recruitment to the methods utilized for OS assessment.
It was previously demonstrated that ApoE ε4 carrier patients with AD have higher OS plasma levels compared to non-ε4 carrier patients with AD. 14 Badia et al reported that asymptomatic patients at risk of AD (ApoE ε4 carriers) have a peripheral imbalance in favor of antioxidant products. 35 Recently, Lloret et al 36 proposed the concept of reductive stress as a possible compensatory mechanism in prodromal stage of AD. Our findings are not likely to be affected by ApoE ε4 carrier status since the AD and MCI-AD were similar in terms of distribution of homo- and heterozygosity ε4-ε3 condition (see Figure 2), and all significant results on OS levels remained the same after correction for ApoE ε4 carrier status.
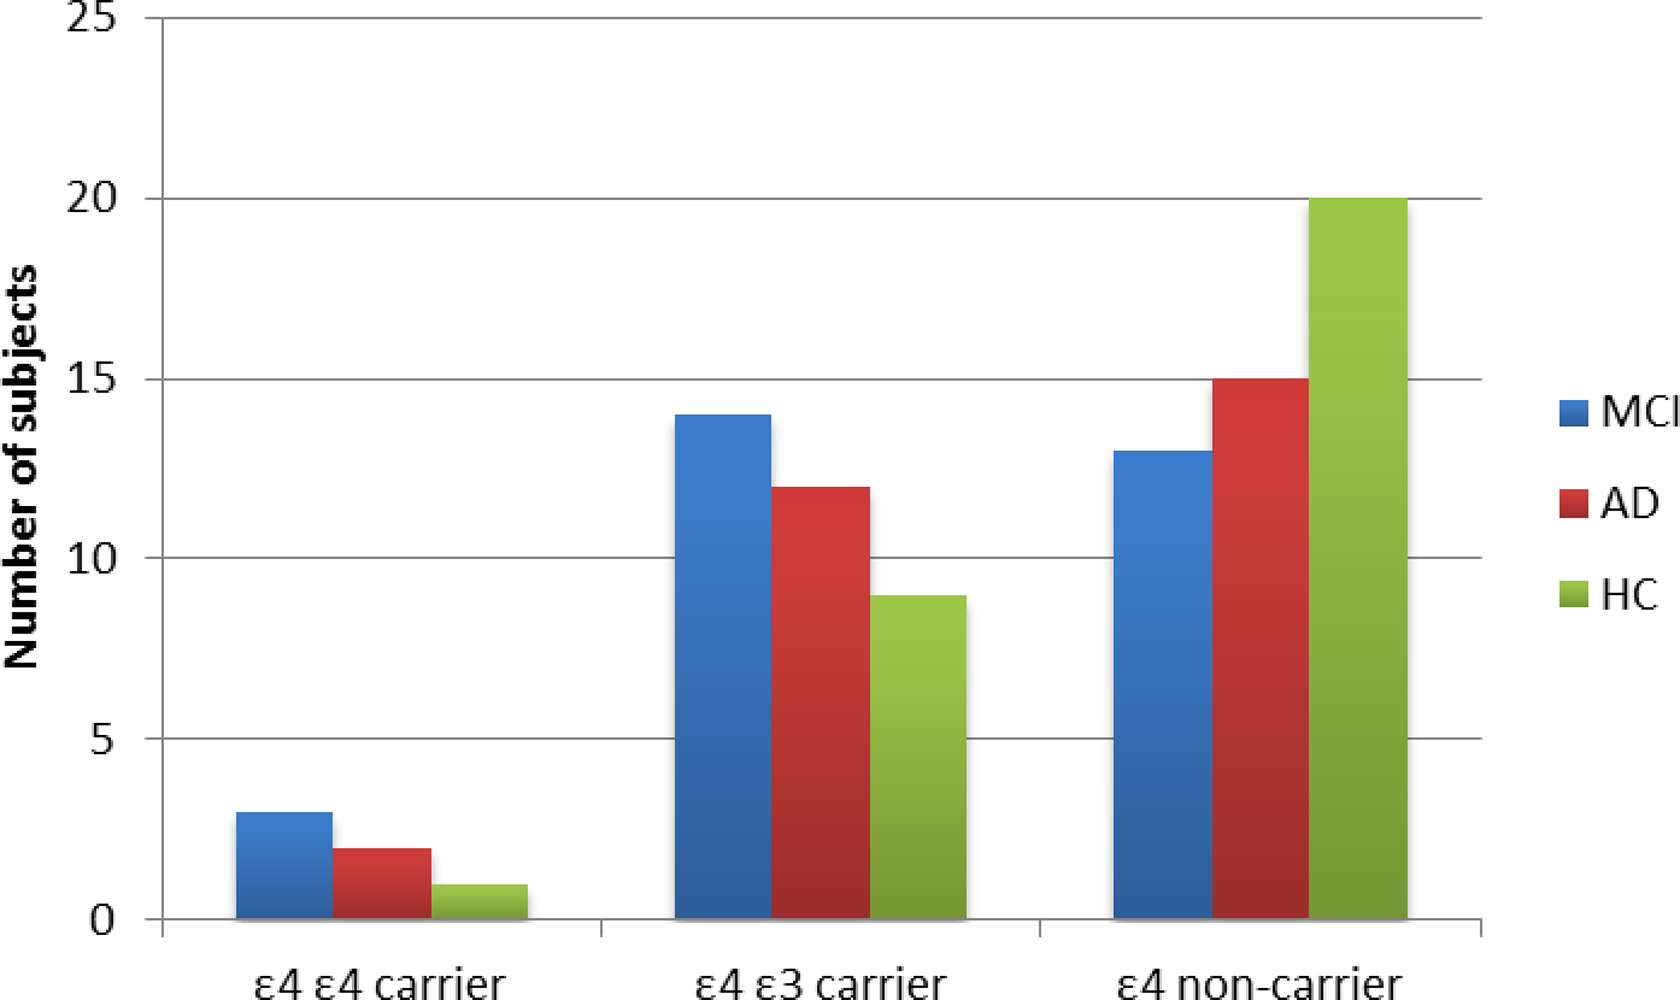
Apolipoprotein E (ApoE) ε4 carrier status, both homo- and heterozygosity, did not significantly differ between Alzheimer’s disease with mild dementia (AD), mild cognitive impairment due to AD (MCI-AD), and healthy controls (HC).
Moderate alcohol consumption has been shown to reduce plasmatic OS levels by introducing antioxidant substances. 23,24,37 Our finding of higher moderate alcohol consumption in MCI-AD further strengthen the OS-level difference between the 2 groups. It has also been reported that vascular WML might be associated with brain OS and increased plasma OS levels. 38 -41 We avoided this possible bias by excluding patients with mixed dementia. 19
It has been demonstrated that AChEI might modulate OS activity. 42,43 However, this finding is controversial and still debated. Sinem and colleagues 44 showed a short-term effect of AChEI in reducing oxidized LDL (plasmatic markers of lipidic peroxidation) and nitric oxide in patient with AD. Only one study compared OS levels in a group of patients with AD treated with AChEI and a group of drug-naive patients, showing no significant differences. 45
Memantine, an N-methyl-
According to our knowledge, this is the first study on OS assessment taking into account several possible confounding factors including antidementia therapy. 34,50,51 We did not evaluate use of antidepressants for which a possible antioxidant effect was recently reported. 52 -54
The result of lower OS in patients with AD having stable antidementia treatments we found should be interpreted with caution, as OS levels were not assessed in these patients before antidementia therapy.
We found that patients with MCI-AD (not treated with any antidementia treatment) showed higher OS levels when compared to patients with AD stably treated with either anticholinesterase inhibitors or memantine or both in few cases. This finding has two possible interesting explanations: (1) OS in AD might have a peak in MCI stage rather than overt dementia; this could be mainly due to increasing neuronal loss and widespread cell apoptosis affecting critical brain regions for AD along its progression, and (2) antidementia treatments might have an antioxidant role as pointed out in previous preclinical data.
We are fully aware that longitudinal OS assessment through various phases of AD, since prodromal stage to dementia one, would be ideal to test the two hypotheses above. In addition, measurement before and after antidementia treatment would be mandatory for this purpose. Data from longitudinal studies would lead to achieve an estimate of plasmatic changes in OS in development and progression of AD.
We didn’t find any association between parameters investigated for OS detection and each possible confounding factor (data not shown). This might be due to the small sample size we utilized, and if shown in larger studies, it might strengthen our results.
Conclusion
Further studies are needed for OS plasmatic levels assessment in drug-naïve AD and after antidementia therapy in order to better elucidate the role of OS in the disease and the possible effects of antidementia drugs on OS. Moreover, larger samples are needed to determine normal cutoffs and longitudinal trajectories of OS plasmatic levels in AD along its progression.
Footnotes
Declaration of Conflicting Interests
The authors declared no potential conflict of interest with respect to the research, authorship, and/or publication of this article.
Funding
The authors received no financial support for the research, authorship, and/or publication of this article.
Supplemental Material
Supplementary material for this article is available online.
References
Supplementary Material
Please find the following supplemental material available below.
For Open Access articles published under a Creative Commons License, all supplemental material carries the same license as the article it is associated with.
For non-Open Access articles published, all supplemental material carries a non-exclusive license, and permission requests for re-use of supplemental material or any part of supplemental material shall be sent directly to the copyright owner as specified in the copyright notice associated with the article.