
Abstract
Introduction:
Estimates of US adults with dementia differ widely and don’t distinguish adults living in the community.
Methods:
Behavioral Risk Factor Surveillance System data from 120 485 households in 21 states that used a cognitive decline module in 2011 were used. Data for both respondents and other adults with subjective cognitive decline (SCD) were included through proxy responses. Using responses to questions about the receipt of informal care for their SCD and diagnosed dementia, estimates were made for each state.
Results:
Overall, 2.9% (range: 1.5% in Tennessee to 5.3% in Arkansas) of all noninstitutionalized adults in these states received informal care for their SCD and 0.9% (range: 0.5% in Tennessee to 2.0% in Arkansas) were estimated to have dementia. Limiting results to respondents reduced estimates significantly.
Discussion:
Combined results for respondents and nonrespondents from a representative telephone survey provide varying estimates of SCD-related measures across states, highlighting the need for state-specific estimates.
Keywords
Introduction
Dementias such as Alzheimer’s disease (AD) are already a significant health problem for millions of US adults and their caregivers and the impact is expected to increase as the population ages. The most commonly used estimates of the numbers of adults with AD or dementia derive from the Chicago Health and Aging Project (CHAP), 1 which estimated AD only, and the Aging, Demographics, and Memory Study (ADAMS), 2 which included all dementia. Estimates were based on different methodologies and include long-term care residents along with adults in the community. Each estimate has limitations, 3,4 and the CHAP study 1 produced estimates for AD about twice as high as those from the ADAMS study. 2
An optional Cognitive Decline module 5,6 for the Behavioral Risk Factor Surveillance System (BRFSS) offers a means to obtain direct estimates of adults with dementia who reside in the community from a large and representative random sample. In 2011, 21 states (Arkansas, California, Florida, Hawaii, Illinois, Iowa, Louisiana, Maryland, Michigan, Nebraska, New Hampshire, New York, North Carolina, Oklahoma, South Carolina, Tennessee, Texas, Utah, Washington, West Virginia, and Wisconsin) opted to include this module in their BRFSS. The BRFSS is a state-based telephone survey coordinated by the Centers for Disease Control and Prevention that collects information from noninstitutionalized adults on behaviors related to premature morbidity and mortality. 7 The module questions addressed “confusion or memory loss that is happening more often or is getting worse during the past 12 months,” which was considered subjective cognitive decline (SCD). Questions were asked not only of survey respondents but also asked about other adults in the household with SCD. If the respondent reported SCD, subsequent questions pertained to the respondent, but if there was another (nonrespondent) adult in the household with SCD and the respondent did not report SCD, the additional questions were asked about the other adult. Follow-up questions addressed the receipt of informal care for SCD and having a dementia diagnosis. Selected results for respondents 5,8,9 or nonrespondents 10 only, and both respondents and nonrespondents, 11,12 have been published. The aim of the current study was to use those data to estimate numbers and percentages of noninstitutionalized adults receiving care from a family member or friend for SCD and those diagnosed with dementia in each of the 21 states.
Methods
Data
Publicly available 2011 BRFSS data 13 from the 21 states that asked the Cognitive Decline module 5,6 were used. In a departure from usual procedures, the module not only addressed randomly selected respondents but also obtained proxy responses for other adults in the household. These other adults will be termed “nonrespondents” in this article to distinguish them from the primary respondents who provided the responses for themselves (respondents) and these other household adults (nonrespondents). Data were limited to landline surveys because only landline surveys could include nonrespondent adults and thus excluded cell phone interviews in the 7 states which included them. The median survey response rate for landline surveys in the 21 states in 2011 was 53.4%, ranging from 37.4% in California to 66.0% in Nebraska. 14
Module questions used in 2011 are available at http://www.cdc.gov/aging/pdf/impact_of_cognitive_impairment_module.pdf. Module question 1 (for respondent) and question 2 (proxy response for nonrespondent adults in the household) addressed “confusion or memory loss that is happening more often or getting worse during the past 12 months.” Question 2 was asked only of respondents who indicated there were 2 or more adults in the household and asked how many other adults in the household (besides the respondent) had these changes and how old the person was. The term “SCD” was defined in this article to include anyone identified in either question.
Starting with the 121 304 landline surveys with nonmissing data for question 1, records with missing and inconsistent values for question 2 were removed, resulting in a total of 120 485 households. The number of nonrespondent adults with SCD in each household was summed and one was added to that number if the respondent also reported SCD to determine the total number of adults with SCD in each household (range: 0-5). Adults with SCD in the household were identified as respondents (n = 11 896) and nonrespondents (n = 4662) based on answers to questions 1 and 2. Age was determined for respondents as years of age, while age for the nonrespondent adult was obtained for 10-year age groups (18-29, 30-39, 40-49, 50-59, 60-69, 70-79, 80-89, and 90 and older).
Follow-up questions were similar for respondents and nonrespondents for whom the respondent provided proxy responses, but only if the respondent did not report SCD. In households where both the respondent and the nonrespondent adult had SCD, respondents were asked the follow-up questions about themselves. If there was more than 1 nonrespondent adult with SCD, the one with the most recent birthday was selected. Follow-up questions included one on informal care: “During the past 30 days, how often has a family member or friend provided care or assistance”…to the person with SCD, with responses of always, usually, or sometimes combined versus rarely or never. Questions about treatment (such as therapy or medications) and diagnosis were only asked about persons who had discussed their SCD with a healthcare professional. For the diagnosis question, responses of AD or some other dementia were combined into “any dementia diagnosis” versus “no diagnosis.” Those adults who had not seen a healthcare professional about their SCD were considered not to have received treatment or a diagnosis. Ten-year age groups, as noted above, were used for age.
Analysis
Data analysis was conducted using Stata version 14.1 (StataCorp LP, College Station, TX, USA), which accounts for the complex sample design of the BRFSS. All analyses used a household weight which reflects the probability of the household being selected. Because none was provided for the 9 states that used multiple survey versions, a household weight was created for all 21 states, using the same procedure BRFSS uses but without final adjustment for household size. 12,13 Respondents who refused to answer or who answered “don’t know/not sure” were excluded from analysis involving that measure.
Pearson χ2 statistics with α = .05 were determined for comparisons of respondents and nonrespondents with SCD. Logistic regression was done for the outcomes of receipt of informal care and any dementia diagnosis comparing nonrespondents with SCD with respondents with SCD as the referent group and controlled for age (in age groups noted above), household income (US$75 000 or more, US$50 000-US$74 999, US$25 000-US$49 999, US$15 000-US$24 999, <US$15 000, and unknown), number of adults in the household, state of residence, and each of the other possible module measures (all persons with dementia had talked with a healthcare professional about their SCDs, so this measure was not included in the dementia diagnosis model). The final models removed variables that were not significant in the initial model.
Estimates of the fraction of respondents and nonrespondent adults with SCD among all adults in the household were made for each state using the survey ratio command in Stata. The total number of adults in the household obtained during the random selection process was the denominator and responses to questions 1 and 2 provided numerators for respondents and nonrespondents, respectively. Estimates of the number of respondent and nonrespondent adults with SCD for each state were made in Excel using estimates of the fraction with SCD and census population figures. 15 Final estimates for each state were determined from the estimates of respondents and nonrespondents with SCD and the percentages of those who reported each outcome. These estimates included numbers and percentages of household adults with dementia and receiving informal care in each of the 21 states and the totals for all 21 states. Separate estimates using only respondent data and weights along with the census population data were also determined for each state.
Results
Characteristics of Sample and Weight Comparisons
Compared to respondents with SCD, the nonrespondents with SCD were significantly older, lived in higher income households, with more household adults, and their state of residence also varied (Table 1). Over half of the weighted results were contributed by California, Florida, New York, and Texas combined. Among adults with SCD in the 21 states, 20.5% (95% confidence interval [CI]: 19.2-21.8) of respondents and 50.1% (95% CI: 47.5-52.7) of nonrespondents received informal care and 2.6% (95% CI: 2.1-3.1) of respondents and 22.0% (95% CI: 19.8-24.3) of nonrespondents had dementia, with variations across states for both measures. Among the 1299 adults with dementia, 78.6% were 60 years or older and 64.7% were 70 years or older. The final logistic regression model for dementia (Table 2) confirmed that these differences between respondents and nonrespondents were not simply due to the demographic differences shown in Table 1, with an adjusted odds ratio (OR) comparing nonrespondents with respondents of 3.0. Results also showed that being treated for dementia was the measure with the highest adjusted OR of 16.7. Increasing age ≥60 years was also a notable predictor of dementia, with OR ≥2.8 and consistent with the unadjusted finding that about 79% of adults with dementia were 60 years or older. Similar results were found for receipt of informal care except that increasing age had much less of an effect than it did for dementia, and lower household income increased ORs for this outcome. The highest OR for receipt of informal care was 6.6 for having functional difficulties (not shown).
Demographics of Sample.a,b
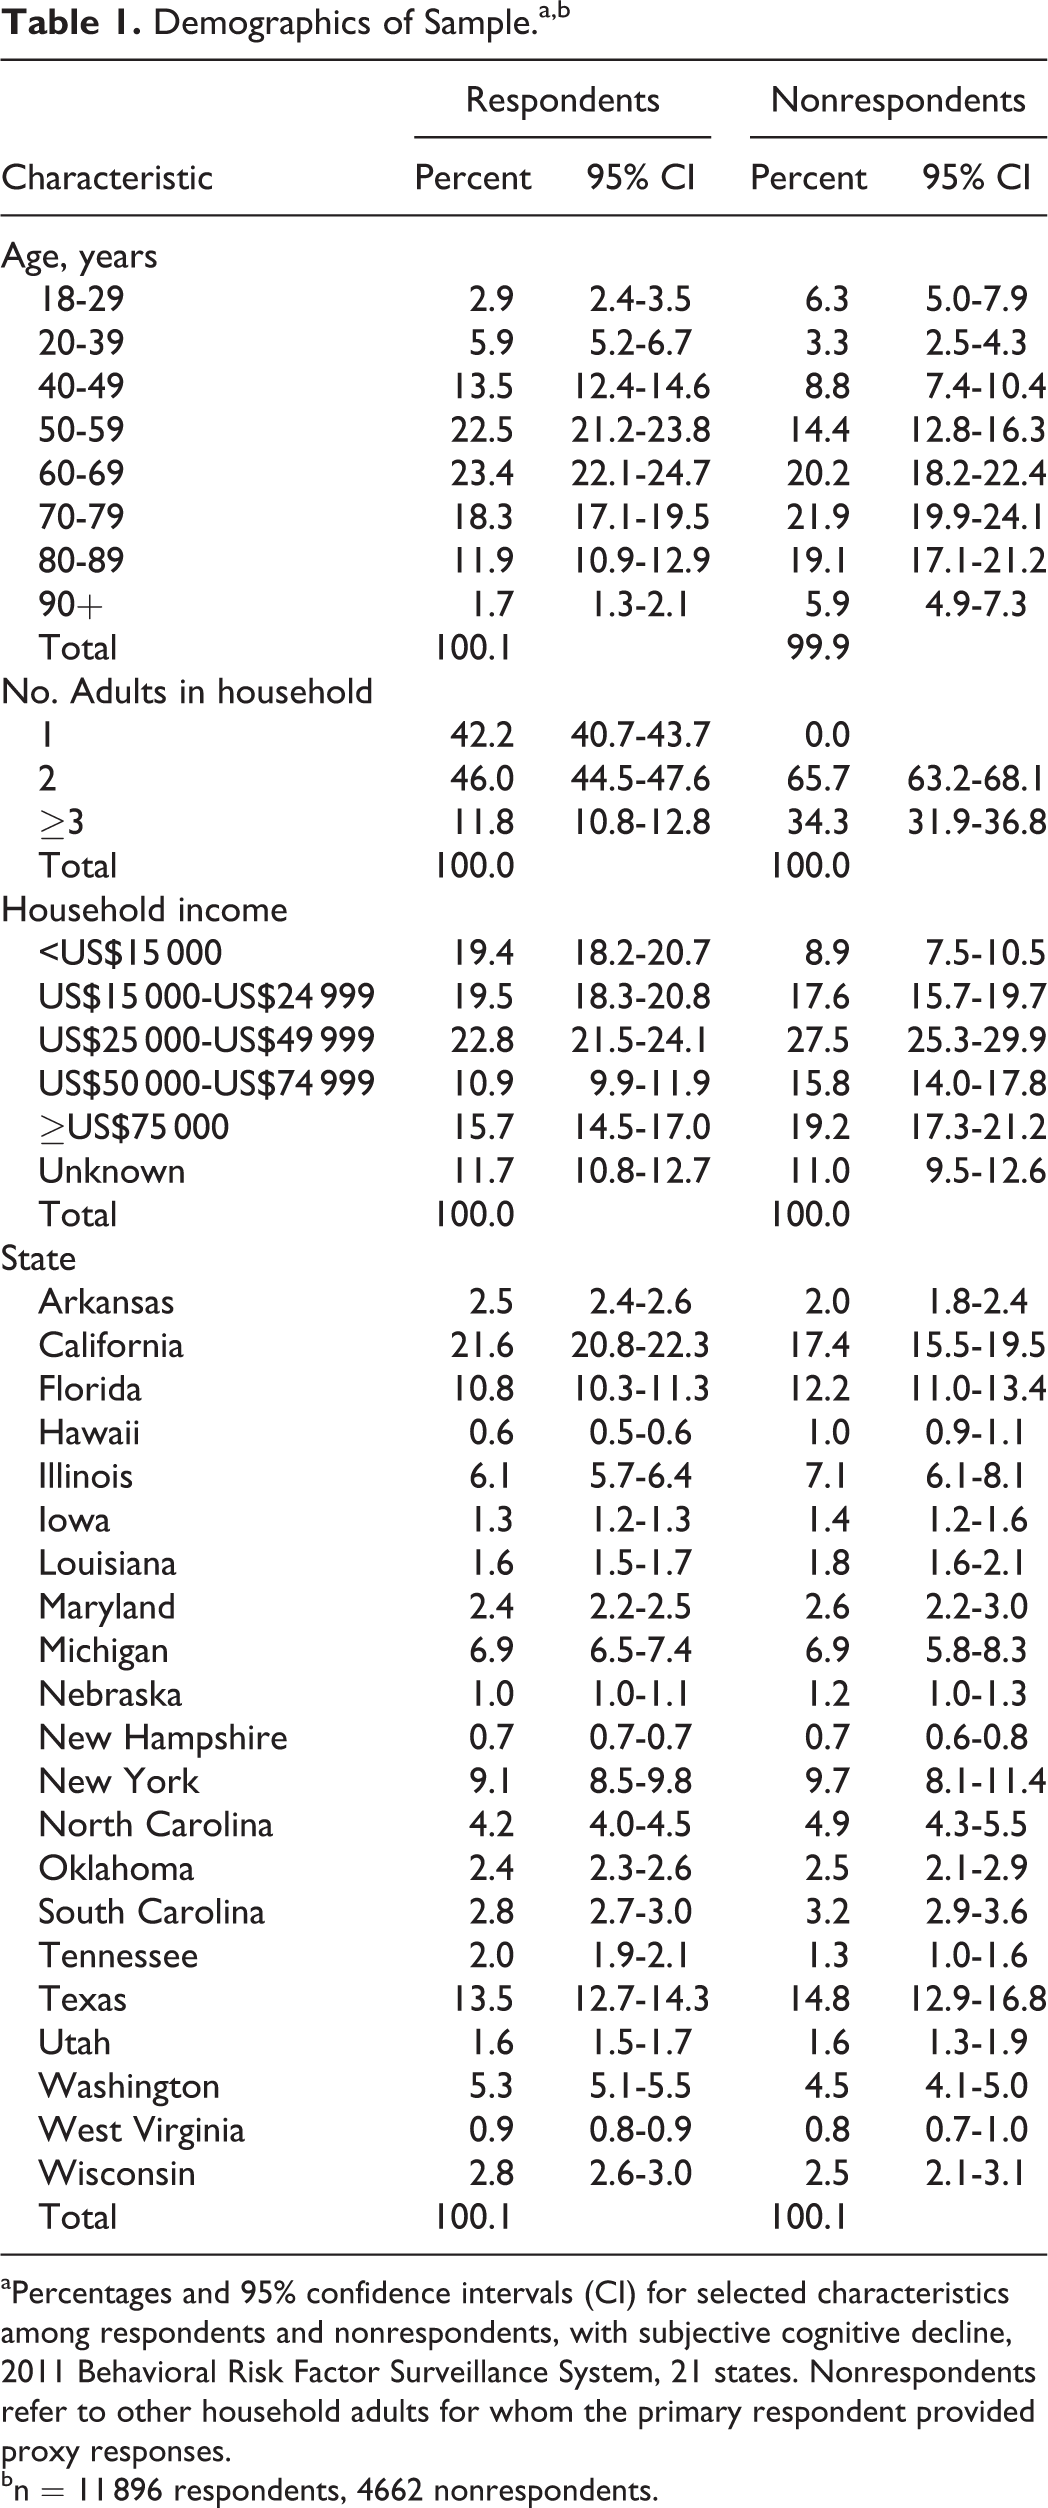
aPercentages and 95% confidence intervals (CI) for selected characteristics among respondents and nonrespondents, with subjective cognitive decline, 2011 Behavioral Risk Factor Surveillance System, 21 states. Nonrespondents refer to other household adults for whom the primary respondent provided proxy responses.
bn = 11 896 respondents, 4662 nonrespondents.
Results of Logistic Regression.a,b
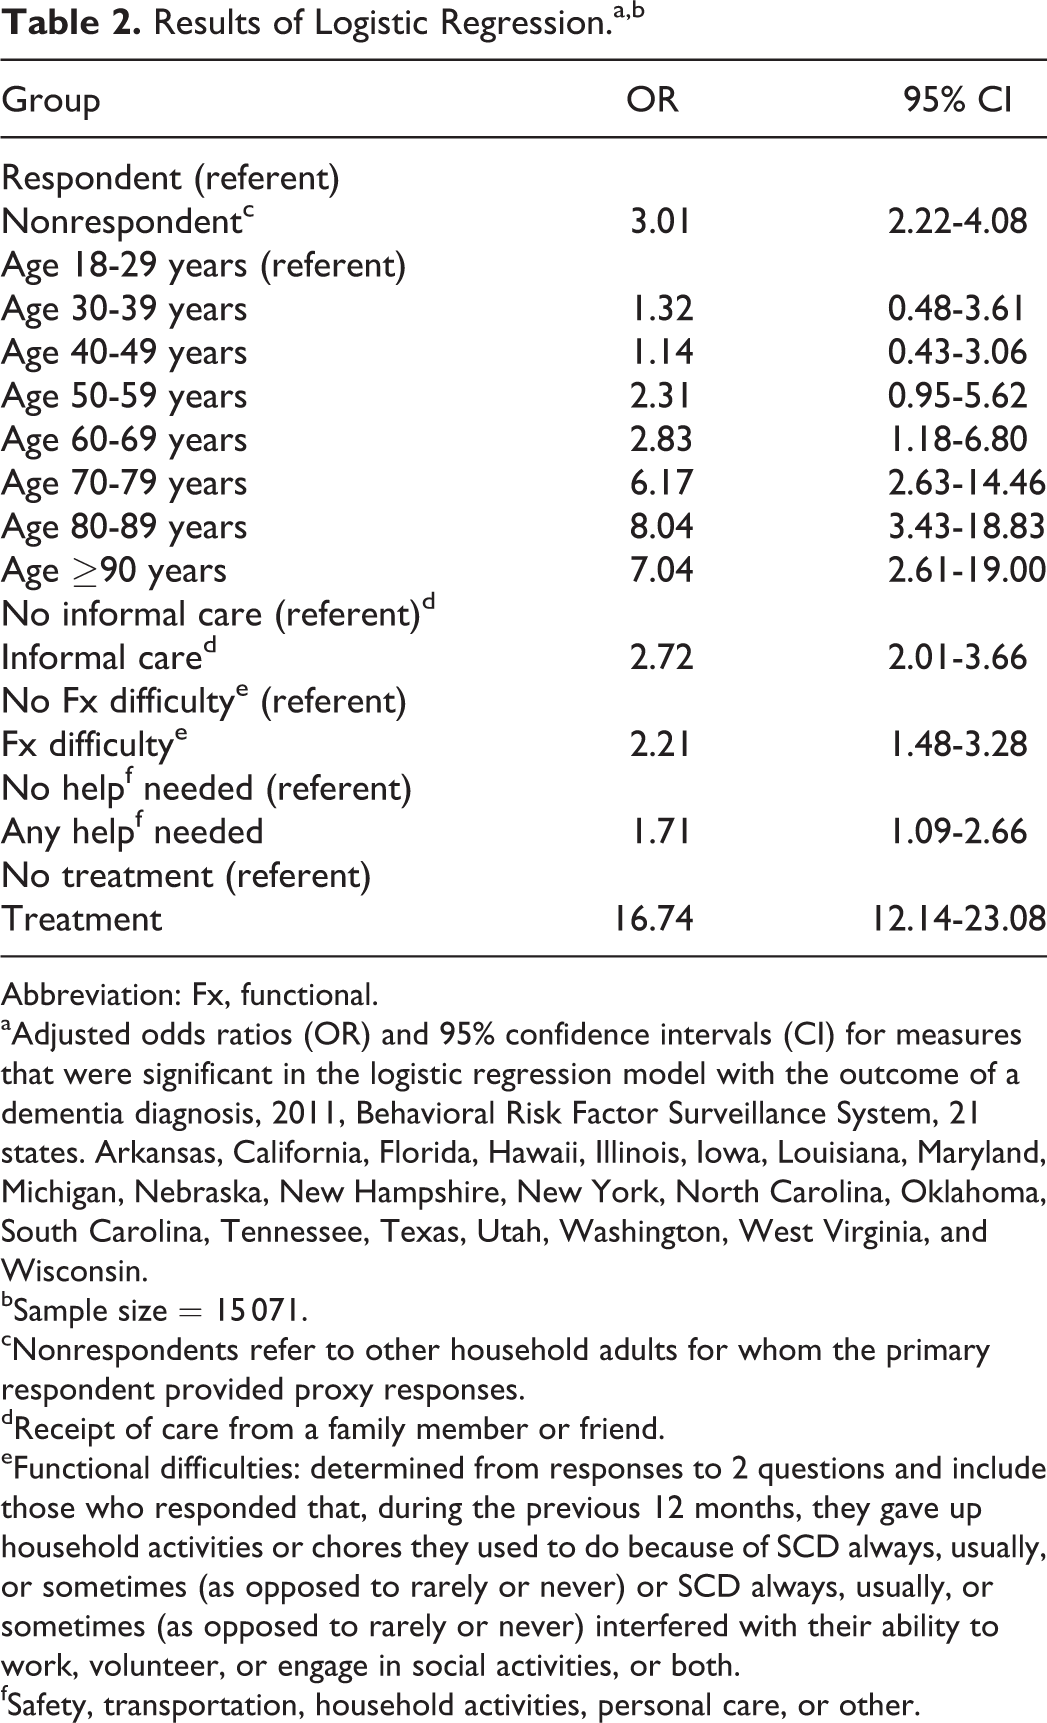
Abbreviation: Fx, functional.
aAdjusted odds ratios (OR) and 95% confidence intervals (CI) for measures that were significant in the logistic regression model with the outcome of a dementia diagnosis, 2011, Behavioral Risk Factor Surveillance System, 21 states. Arkansas, California, Florida, Hawaii, Illinois, Iowa, Louisiana, Maryland, Michigan, Nebraska, New Hampshire, New York, North Carolina, Oklahoma, South Carolina, Tennessee, Texas, Utah, Washington, West Virginia, and Wisconsin.
bSample size = 15 071.
cNonrespondents refer to other household adults for whom the primary respondent provided proxy responses.
dReceipt of care from a family member or friend.
eFunctional difficulties: determined from responses to 2 questions and include those who responded that, during the previous 12 months, they gave up household activities or chores they used to do because of SCD always, usually, or sometimes (as opposed to rarely or never) or SCD always, usually, or sometimes (as opposed to rarely or never) interfered with their ability to work, volunteer, or engage in social activities, or both.
fSafety, transportation, household activities, personal care, or other.
Estimates of Numbers of Adults With Dementia
Based on the number of adults in all 120 485 households, 5.5% (95% CI: 5.4-5.7) were respondents with SCD and 3.5% (95% CI: 3.4-3.7) were nonrespondents with SCD, for a total of 9.1% (95% CI: 8.8-9.3) of household adults estimated to have SCD. Table 3 reports these figures for respondents and nonrespondents in each of the 21 states and the total for all 21. Thus, nonrespondent adults with SCD were estimated to represent about 39% (3.5%/9.1%) of all adults with SCD, with a range among states from 23% to 51%. On a household basis, 7.9% of households in these 21 states included a respondent with SCD, 3.9% included one or more nonrespondents with SCD, and 2.4% of households included both but the respondent answered follow-up questions for himself or herself (not shown). Because the household weight reflects the latter proportions, estimates were done separately for respondents and nonrespondents to minimize the overrepresentation of respondents. Table 4 includes the number of respondents and nonrespondents with SCD from Table 3 and shows the percentage of these adults who have dementia (obtained from Stata) along with the estimated number of all adults with dementia for each state obtained using census population estimates. 15 Results for all 21 states combined indicate 0.92% of all adults have dementia, ranging from 0.51% in Tennessee to 1.96% in Arkansas. For these 21 states, the estimated total number of adults with dementia is about 1.30 million. Not shown is the estimate of 307 000 adults with dementia for the 21 states based only on respondent data that used rates for SCD and dementia obtained using respondent weights. Thus, using only respondent results, the estimated number of adults with dementia is less than one-fourth of that produced using both respondent and nonrespondent data. Projecting the dementia rate of 0.92% on the total US population of adults produces an estimate of 2.17 million noninstitutionalized adults in the United States with dementia in 2011.
Estimates of Adults With Subjective Cognitive Decline (SCD), by State.a
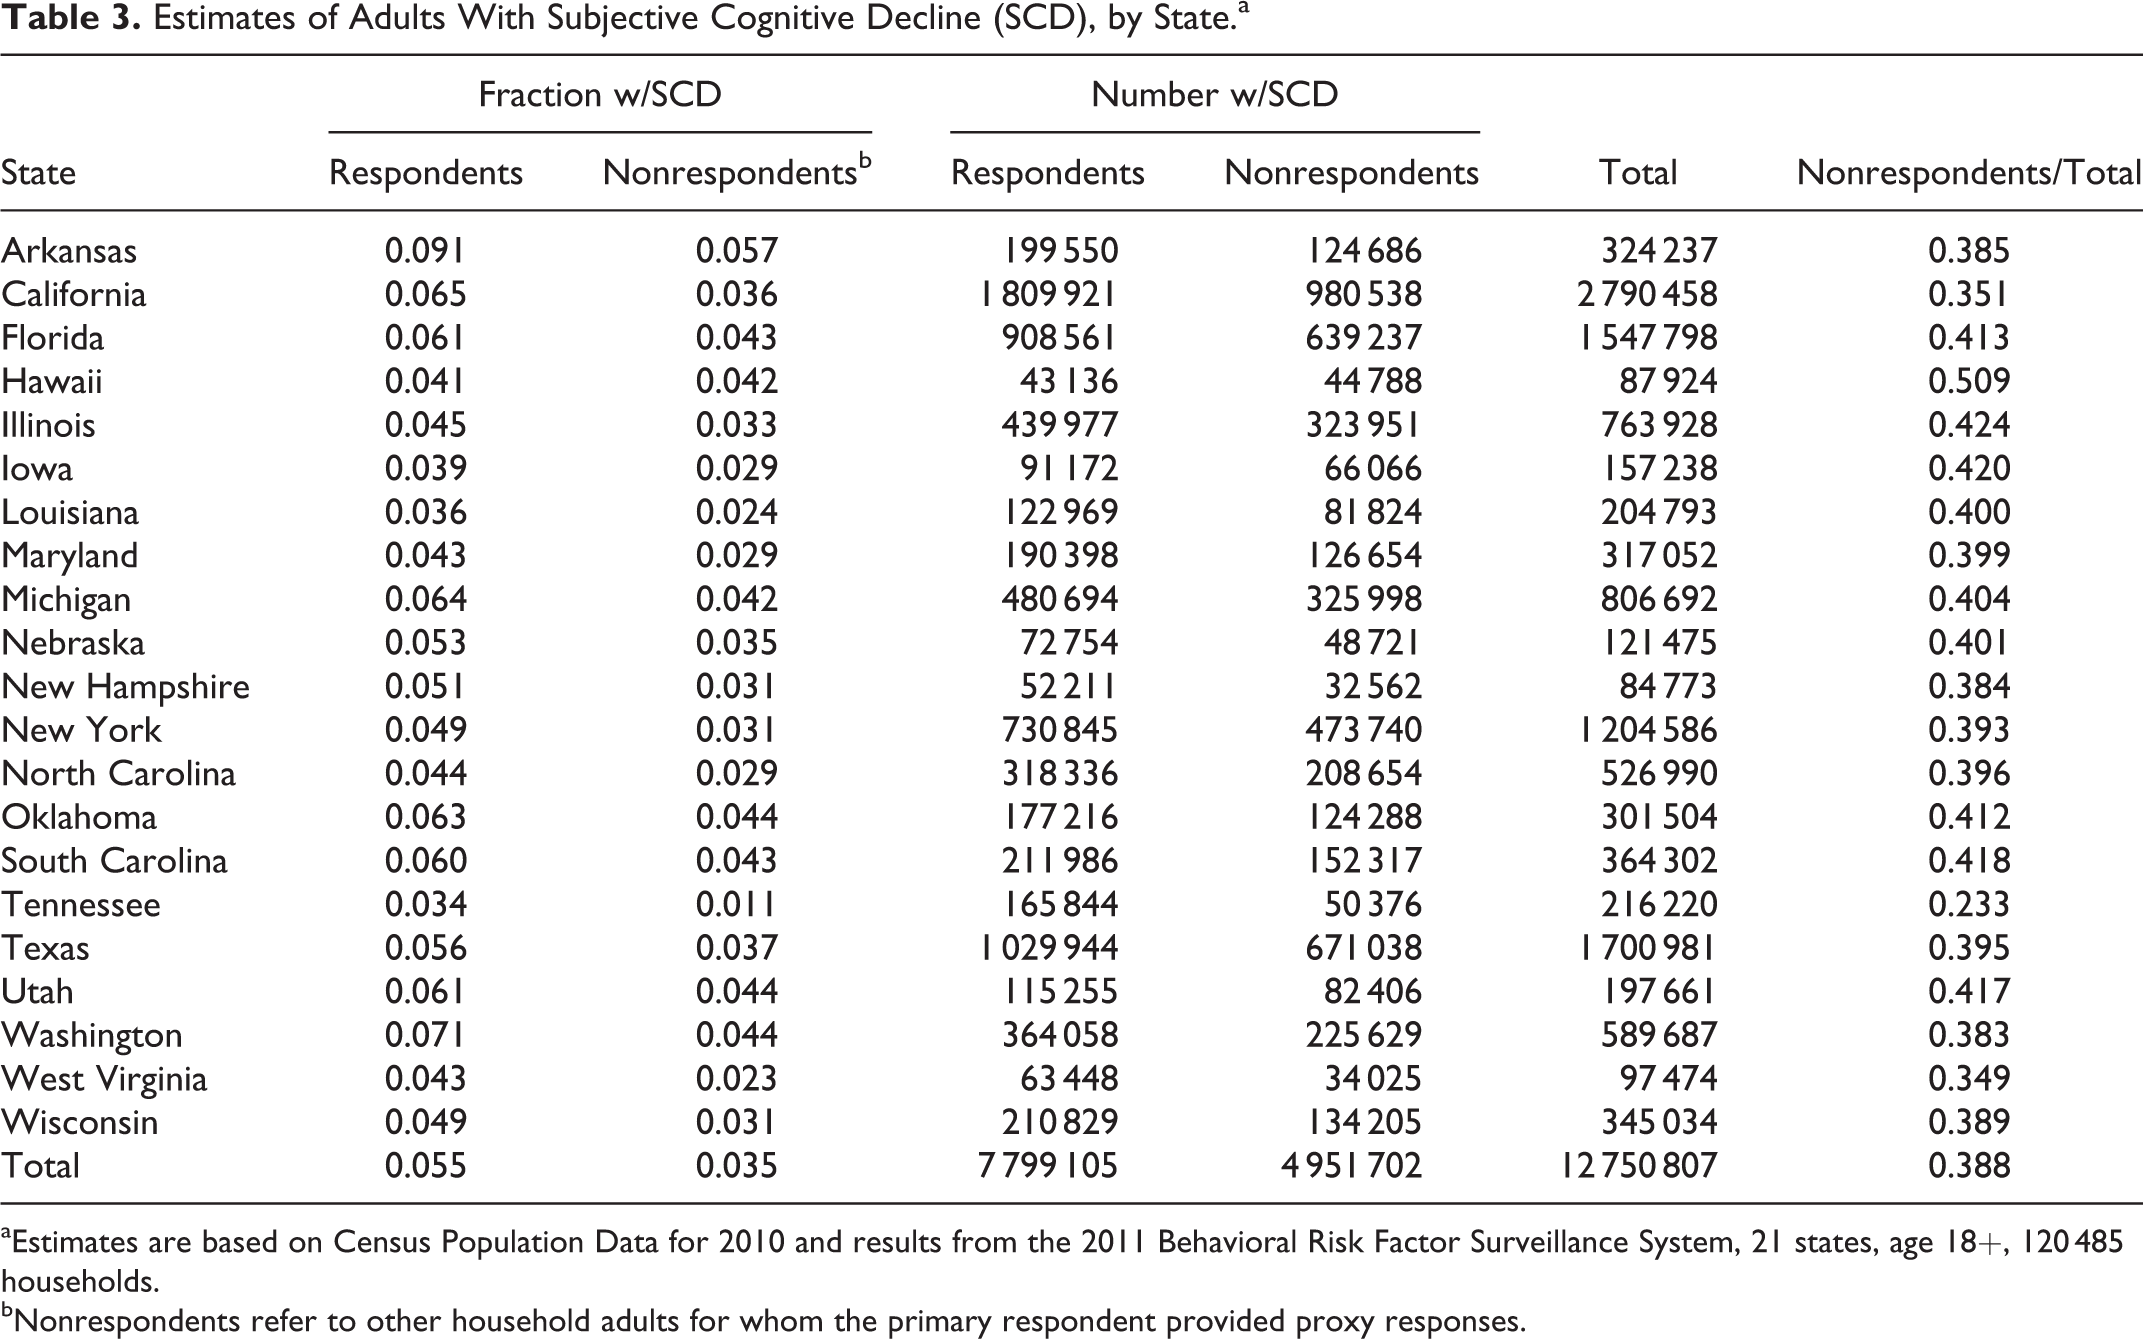
aEstimates are based on Census Population Data for 2010 and results from the 2011 Behavioral Risk Factor Surveillance System, 21 states, age 18+, 120 485 households.
bNonrespondents refer to other household adults for whom the primary respondent provided proxy responses.
Estimates of Adults With Dementia, by State.a,b
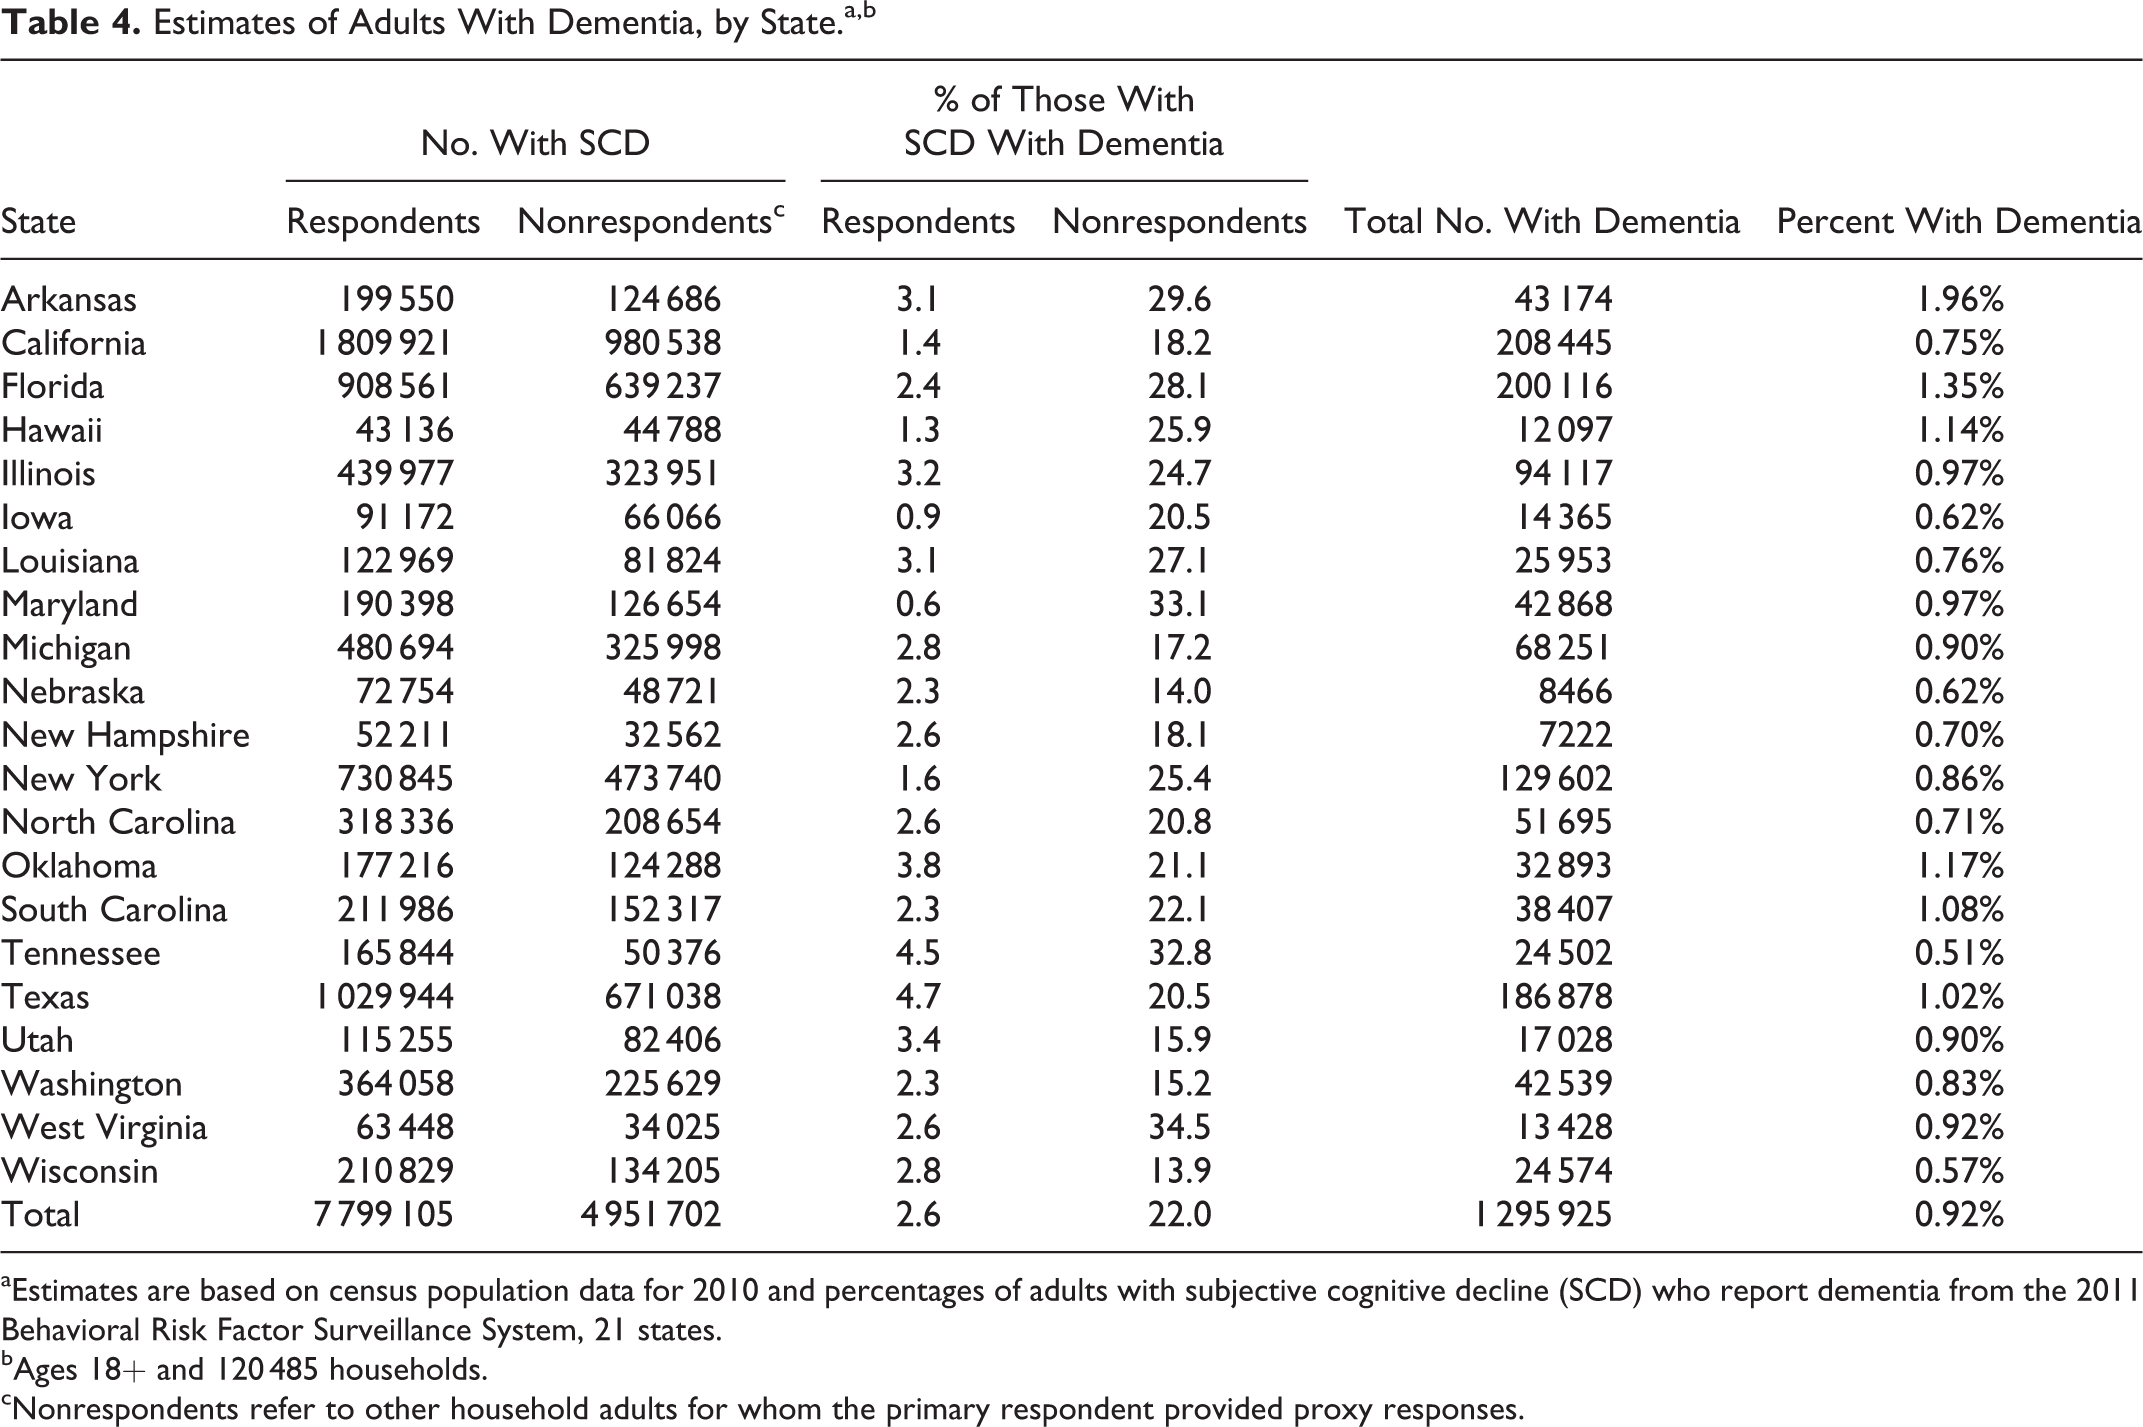
aEstimates are based on census population data for 2010 and percentages of adults with subjective cognitive decline (SCD) who report dementia from the 2011 Behavioral Risk Factor Surveillance System, 21 states.
bAges 18+ and 120 485 households.
cNonrespondents refer to other household adults for whom the primary respondent provided proxy responses.
Results for Adults With Dementia
Because nonrespondent adults can only reside in households with 2 or more adults, one consequence of the large difference in reported dementia diagnosis between respondents and nonrespondents with SCD was that most adults with dementia lived in households of 2 or more adults. Among households with an adult with dementia, only 11.1% included just 1 adult, while 88.9 (95% CI: 85.2-91.7) contained 2 or more, including 58.2% that contained 2 adults and 30.7% with ≥3 adults. For comparison, among these 21 states, 33.8% of all households included only 1 adult. In addition, among adults with diagnosed dementia, 80% reported receiving treatment.
Adults With SCD Receiving Informal Care
Overall, 50.1% of nonrespondents and 20.5% of respondents with SCD (not just those with dementia) were getting informal care for their SCD. The percentage of all adults in each state (not just those with SCD) who were receiving care for SCD from a family member or friend was 2.9% and ranged from 1.5% in Tennessee to 5.3% in Arkansas (Table 5). Eighty percent of adults with diagnosed dementia were receiving informal care compared to 24% of those with SCD but not diagnosed, which resulted in 22% of all adults with SCD who received informal care having been diagnosed with dementia (not shown). Due to the small numbers of respondents and nonrespondents with dementia in each state, these results were not broken out by state.
Estimates of Number of Adults With Subjective Cognitive Decline (SCD) Who Receive Care for it From a Family Member or Friend, by State.a,b
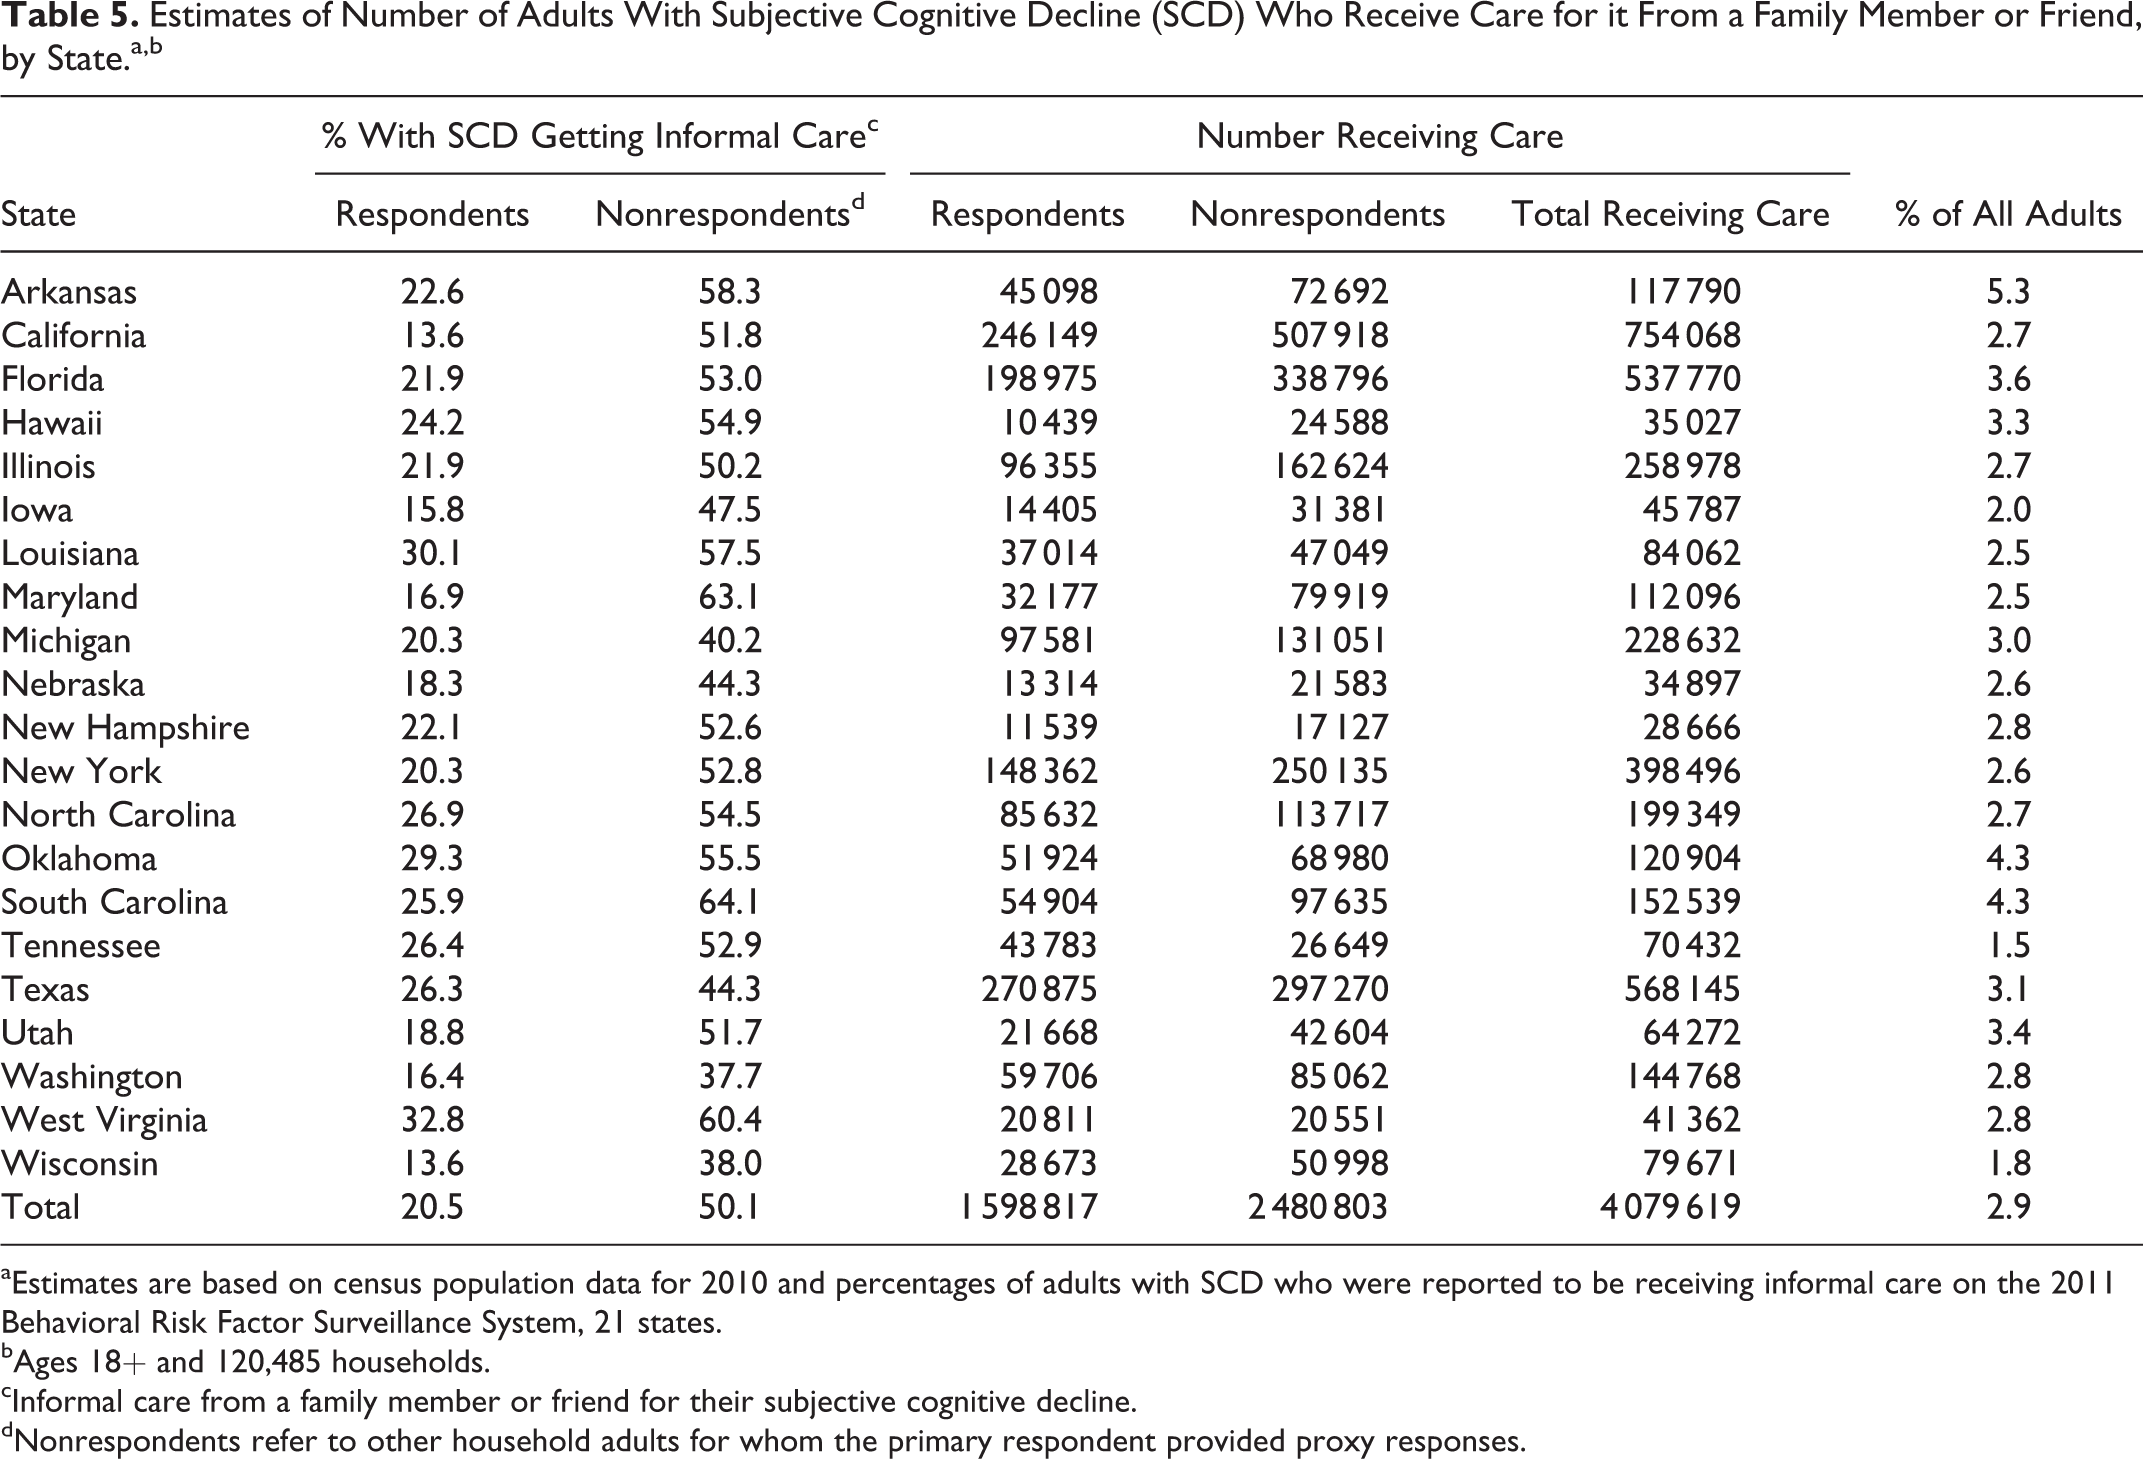
aEstimates are based on census population data for 2010 and percentages of adults with SCD who were reported to be receiving informal care on the 2011 Behavioral Risk Factor Surveillance System, 21 states.
bAges 18+ and 120,485 households.
cInformal care from a family member or friend for their subjective cognitive decline.
dNonrespondents refer to other household adults for whom the primary respondent provided proxy responses.
Discussion
Using data from a large, representative telephone survey that includes results for both respondent and nonrespondent adults, this study estimates that approximately 1 in 100 noninstitutionalized adults living in the community have dementia with a range across the 21 states from 1 in 200 to 3 in 200. About 80% of these adults with dementia are getting treatment and 80% are receiving informal care. This latter figure represents 2.9% of all adults in the 21 states—not just those with dementia or SCD—who are receiving informal care for cognitive decline. These are estimates for all 21 states combined and vary by the state of residence.
By directly comparing respondents with SCD and proxy responses for nonrespondents with SCD, large differences in both rates were found that were confirmed when adjusted for demographics and other factors. These differences are unlikely to be the result of using proxy responses as they far exceed any differences found between proxy responses and the data used for their validation in other studies involving proxies. 12,16,17 For dementia, receiving treatment had the highest adjusted odds ratio of 16.7, which is consistent with the finding that 80% of study adults with dementia received treatment and because current treatments are only available for dementia and not for SCD. Limiting results to respondents lowered the estimated number of household adults with dementia by over 75% and also significantly reduced estimates of receipt of informal care. These estimates are not meant to replace existing dementia estimates but to provide a new source of information based on sampling in separate states. Both measures show state-by-state variations, which are consistent with other results from the BRFSS 5 and highlight the importance of state-based estimates. Results also show that relying only on respondent data from telephone surveys may seriously underestimate results. 12
The large differences in results between respondents and nonrespondents may arise from the BRFSS survey methodology. In the first step of selecting a respondent, a landline phone number is randomly selected and called and a random selection is made among all adults in the household. If the selected adult is physically or mentally unable to answer a telephone survey, the entire household is dropped from the sample without conducting an interview. Thus, it is likely that when an adult with moderate to severe dementia is selected to respond, no BRFSS interview would be conducted in that household. This same criterion does not apply to nonrespondent adults in the household who were not randomly selected, so they could have more serious dementia than respondents. This suggests that respondent results only represent adults capable of responding to a survey and to represent all household adults, results for nonrespondents must be included. In general, the BRFSS results have been found comparable to other surveys with higher response rates 18 but that would undoubtedly not hold true for dementia if based only on respondent data. These results demonstrate the necessity for including results for both respondents and nonrespondents in these estimates. 12
The projected total of about 2.17 million adults with dementia for the entire United States is lower than commonly used ADAMS 2 and CHAP study 1 estimates, which is to be expected because only noninstitutionalized adults are included. Comparison of various estimates is difficult because they are based on different methods, years, and ages and include different diagnoses and study populations (eg, all adults vs noninstitutionalized), 3 but these estimates appear to be consistent with estimates based on either the ADAMS 2 or CHAP 1 studies. These new estimates add to these earlier estimates by showing that somewhere between 1 in 200 and 3 in 200 (overall approximately 1 in every 100) adults in the community have dementia and they appear to show more state-to-state variation than the Alzheimer’s Association estimates. 4 Study estimates that include both respondent and nonrespondent data are far more consistent with commonly used estimates 1,2,4 than are results that are limited to respondents.
The results for adults with SCD receiving care from a family member or friend reiterate the importance of informal caregivers not just for adults with dementia but for those with cognitive decline as well. The Alzheimer’s Association estimates that in 2015, family and friends provided over 18 billion hours of unpaid care to adults with dementia with an estimated value of US$221.3 billion. 19 Caregivers are more likely to reside in low-income households and lose about US$15,000 in income due to their caregiving as a result of having to reduce hours or quit work. In their own survey, the Association found a significant financial burden associated with caregivers who provided care to a family member or friend with dementia, including having to cut back on basic necessities. 19 Of course, their survey focused on the caregiver rather than the care recipient, but these study results on care recipients are in agreement concerning household income.
Using a household weight is unusual on the BRFSS and requires some care in reporting results. It is important to keep in mind that total results represent the distribution of respondents and nonrespondents within a household and that each household is represented by a single respondent. Thus, nonrespondents are underrepresented because there can be multiple nonrespondents per household (but only 1 respondent), and in the 2.4% of households which contain both respondents and nonrespondents, the follow-up questions pertain to the respondent. To lessen this effect, estimates were made separately for respondents and nonrespondents. However, households with both respondents and nonrespondents with SCD are still represented in the results by the respondent, which results in overrepresentation of respondents. Estimates were converted to an individual basis by using the actual numbers of adults to determine the proportion of adults with SCD in each household, again doing this separately for respondents and nonrespondents.
Limitations of the study include the usual limitations of self-reported data on telephone surveys plus a few extra. These include the unknown quality of proxy data reported for persons who are cognitively impaired, although at least 1 recent study relied on their use. 20 Also, proxy information tends to agree best with self-reports when reported by a household member, which was the case in this study. 16 Testing of other questions on the BRFSS suggests that the validity of measures in medical records (eg, a dementia diagnosis) is high, 21 but the same criteria for diagnosing dementia may not have been used for everyone. Dementia may also be underreported because people diagnosed with dementia are not always told or aware of the diagnosis 22 and only those who had talked to a healthcare provider were asked about diagnosis. Dementia can be reversible, which could result in overestimation of dementia; however, reversible dementia appears to represent only a small percentage of total cases. 23 The combined effect of these limitations suggests that the dementia estimates reported here likely underestimate the true number of adults in the community with dementia. This is not unique to dementia, as other chronic conditions including diabetes, 24 chronic obstructive pulmonary disease, 25 and hypertension 26 are also commonly underdiagnosed. The generalizability of these results is unknown and most likely would be affected by geographic variation as reported here and elsewhere. 27 Lack of age information on all adults in the household restricts analysis by age to adults with SCD.
There are several strengths of this study. First is the use of data from a large and representative survey, which produced estimates of household adults with dementia for each of the 21 states represented. In contrast, the often referenced ADAMS study 2 is based on only 856 adults aged 70 and older from different regions of the United States; of which only 308 had dementia. The CHAP study 1 was limited to a sample in the Chicago area that was 54% black, with only 408 cases of AD. This current study includes 1299 adults with dementia in the 21 states from a sample that included over 120 000 randomly selected households. Because factors such as race/ethnicity of participants, 28,29 urban/rural status, 3,27 and state-to-state variation 5 can affect estimates, using a population-based survey is a major strength compared with commonly used estimates. In addition, study estimates are limited to adults in the community whose needs may be very different from adults with dementia in long-term care. The study also provides potentially valuable information on the receipt of informal care for SCD and treatment of dementia, although the exact nature of the treatment is unknown.
The implications for these results are many. It is clear from these results that nonrespondent adults are much more likely to be receiving informal care and to have dementia than respondents. To get accurate estimates of the burden of SCD and dementia in the community, results for these nonrespondents must be included. To lessen the underrepresentation of nonrespondents when using a household weight, estimates should be made separately for nonrespondents and respondents. Knowing that most adults with dementia live in households with 2 or more adults may help in identifying households that require caregiver and other assistance, but adults with dementia who are the only adult in the household represent special concerns and needs. Most adults (80%) with dementia in these states are receiving treatment so their healthcare providers may be aware of their dementia and need for care but may not be as aware of needs for those with SCD who were not diagnosed. Although the publicly available 2011 data include only 21 states, additional states asked the questions in 2012 and 2013 and have their own data. Applying these same methods to those data could produce estimates of dementia and receipt of informal care for all but a handful of states.
In summary, directly comparing respondents reporting SCD with nonrespondent adults with SCD shows that nonrespondent adults are far more likely than respondents to report receiving informal care for SCD (50.1% vs 20.5%) and to have been diagnosed with dementia (22.0% vs 2.6%). Doing separate calculations for respondents and nonrespondents, approximately 1.3 million adults in the community in these 21 states are estimated to have dementia, an estimate about 4 times higher than would be obtained using only respondent data. Adults with dementia represent about 1 in every 100 community adults in the 21 states, ranging from 1 in 200 to 3 in 200 across the states. Estimates that 2.9% of all household adults in these 21 states are receiving informal (unpaid) care for SCD, ranging from 1.5% to 5.3% across the states should be useful to states in planning for future caregiver needs. These results add to available information by highlighting the importance of using state-specific data and including results for both respondents and nonrespondents for dementia-related measures. Limiting results to adults in the community whose needs may be very different from those in long-term care situations offers a different perspective from that of commonly used estimates.
Footnotes
Declaration of Conflicting Interests
The author declared no potential conflicts of interest with respect to the research, authorship, and/or publication of this article.
Funding
The author received no financial support for the research, authorship, and/or publication of this article.