
Abstract
Amnestic mild cognitive impairment (aMCI) and vascular cognitive impairment with no dementia (VCIND) are highly predictive of Alzheimer’s disease and vascular dementia. In this study, a 2-dimensional magnetic resonance spectroscopy was performed in 25 patients with aMCI, 28 patients with VCIND, and 32 normal controls (NCs). The concentrations of N-acetyl aspartate (NAA), choline (Cho), myoinositol (MI), and creatine (Cr) were measured, and their ratios were calculated. The patients with aMCI displayed significantly lower NAA/MI bilaterally in the posterior cingulate gyrus (PCG) and white matter of occipital lobe (OLWM) than NC participants or patients with VCIND , whereas patients with VCIND displayed markedly lower NAA/Cho bilaterally in the white matter of frontal lobe (FLWM) and left OLWM, and right dorsal thalamus (DT) than patients with NC or aMCI. Compared with the controls, patients with aMCI displayed lower NAA and NAA/Cr in bilateral PCG, left precuneus, and DT, whereas patients with VCIND displayed lower NAA/Cr in bilateral DT and FLWM. In addition, increased MI in right PCG of patients with aMCI and increased Cho in left FLWM of patients with VCIND were also observed. The results might help guide a clinical differentiation between the 2 disorders.
Keywords
Introduction
Amnestic mild cognitive impairment (aMCI) refers to nondemented individuals with memory complaints and objective memory impairment, and has been shown consistently to have a higher risk for developing Alzheimer’s disease (AD), 1 with almost 50% of these patients progressing to AD after 3 years. 2 It is well known that AD is the most common cause of dementia, with vascular dementia (VaD) being the second leading cause. 3 Vascular cognitive impairment with no dementia (VCIND) describes those individuals whose symptoms are associated with substantial functional impairment, but do not meet the dementia criteria, and include a high proportion of individuals with subcortical ischemia with cognitive impairment of presumed cerebral vascular disease. 4 Patients with VCIND have a high risk of progression to dementia, mixed primary neurodegenerative dementia with vascular dementia, or vascular dementia, particularly if they have recurrent stroke. 5 Magnetic resonance (MR) spectroscopy (MRS) concurrently measures brain metabolites, such as N-acetylaspartate (NAA), myoinositol (MI), choline-containing compounds (Cho), and total creatine. Previous studies performed with single-voxel proton MRS on patients with mild cognitive impairment (MCI) have demonstrated increases in the concentration of MI or the MI/Cr ratio and decreases of NAA or the NAA/Cr ratio in the hippocampus, posterior cingulate, occipital lobe white matter, and parietotemporal cortex. 6 –8 Compared to patients with MCI or AD, patients with VaD exhibit global reductions in NAA/Cr ratio in the parietal gray and white matter, frontal white matter, and the temporal lobe. 9 Despite the etiologies of aMCI and VCIND are different and a significant number of patients with dementia may be with both etiologies, it is also important to differentiate between aMCI and VCIND, because it could limit the possible accuracy of research in prevention, risk factors, and treatment of dementia.
The present study aimed to evaluate and characterize the metabolic markers in patients with aMCI and VCIND compared to normal control (NC) participants using 2-dimensional (2D) chemical shift imaging proton MRS, and to assess proton MRS ( 1 H-MRS) alterations by positioning 10 volumes of interest in the brain to study the metabolic changes.
Methods
Participants
We recruited 85 elderly individuals comprised of 25 patients with aMCI, 28 patients with VCIND, and 32 NC participants through the Department of Neurological Clinic Service and Medical Examination Center in our hospital. All participants were right-handed, and demographic information for those completing the study is shown in Table 1. This study was performed with institutional review board approval. All participants and caregivers of the patients with aMCI, patients with VCIND, and NC provided written informed consent prior to MRS examination.
Characteristics of Patients With aMCI and VCIND, and NC.a
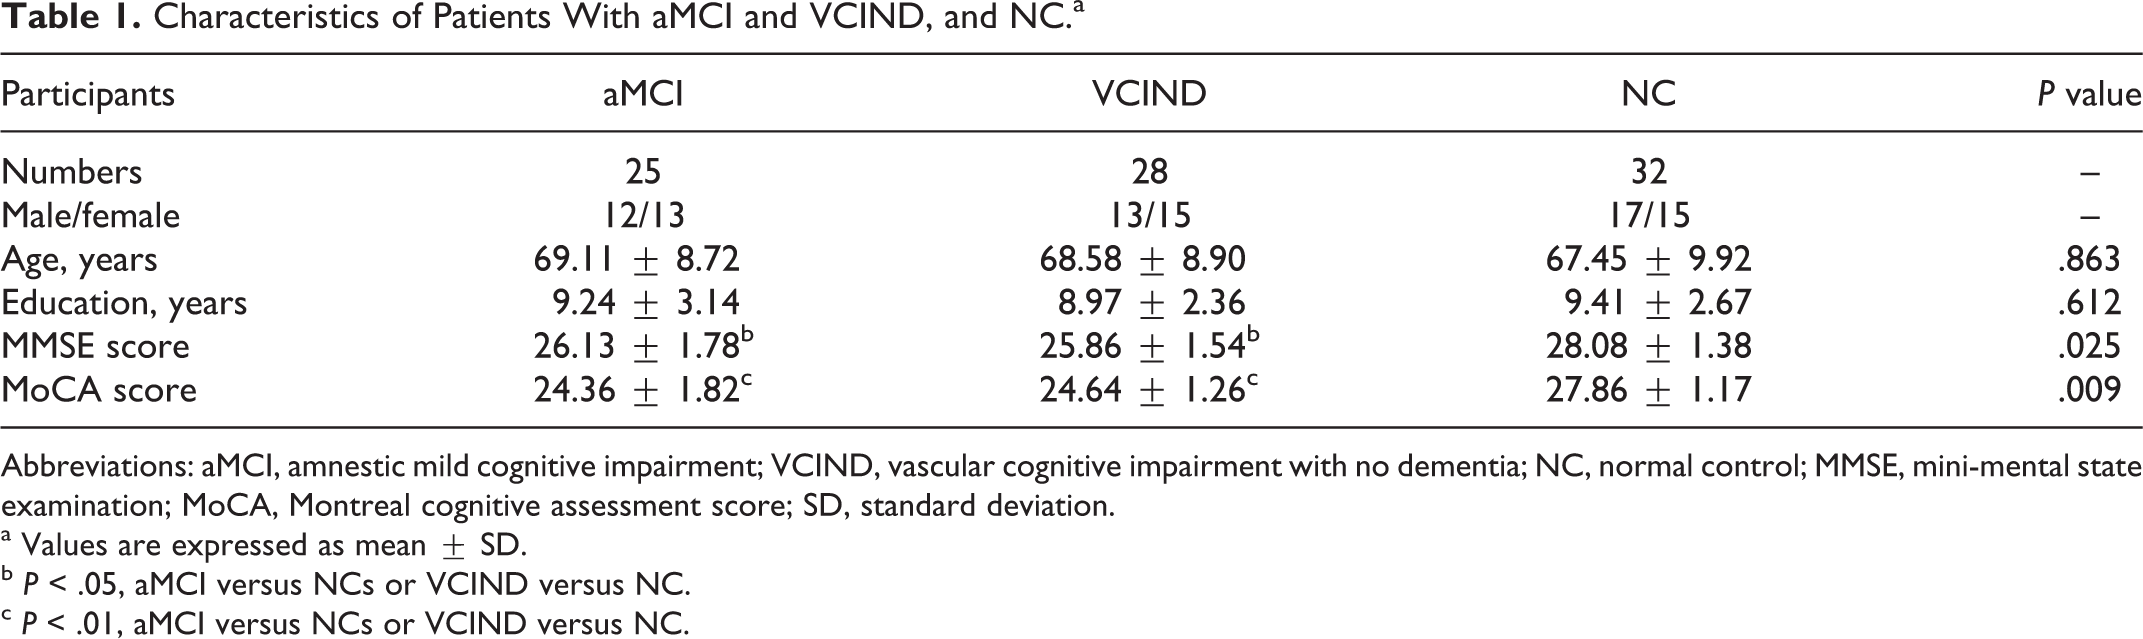
Abbreviations: aMCI, amnestic mild cognitive impairment; VCIND, vascular cognitive impairment with no dementia; NC, normal control; MMSE, mini-mental state examination; MoCA, Montreal cognitive assessment score; SD, standard deviation.
a Values are expressed as mean ± SD.
b P < .05, aMCI versus NCs or VCIND versus NC.
c P < .01, aMCI versus NCs or VCIND versus NC.
Criteria for aMCI, VCIND, and NC
Patients diagnosed with aMCI met the operational criteria proposed by Petersen et al, 10 which included: memory complaint, confirmed by an informant; abnormal memory function, documented by extensive neuropsychological evaluation; normal general cognitive function, as determined by both the clinical dementia rating scale (CDR with at least 0.5 in the memory domain) and mini-mental state examination (MMSE greater than or equal to 24); no impairment in functional activities of daily living, as determined by a clinical interview with the patient and informant; insufficient impairment, cognitively and functionally, to meet National Institute of Neurological and Communicative Diseases and Stroke-Alzheimer's Disease and Related Disorders Association criteria for AD. Neuropsychological testing included a Hachinski ischemic (HIS) score (HIS score less than or equal to 4) and Montreal cognitive assessment score (MoCA, Beijing Version, greater than or equal to 24).
Diagnosis of VCIND depended on the following criteria 11,12 : insufficient cognitive impairment to meet the Diagnostic and Statistical Manual of Mental Disorders (Fourth Edition, Text Revision) criteria for dementia; vascular etiology as follows: (a) cognitive impairment caused by cardiovascular risk factors, (b) cognitive impairment caused by strategic infarct or multiple infarcts indicated by a sudden onset or stepwise progression and responsible lesions on MR imaging (MRI) or computed tomography scans, and (c) cognitive impairment due to subcortical small vessel disease suggested by minor neurological signs (such as hemiparesis, lower facial weakness, Babinski sign, sensory deficit, dysarthria, gait disorder, urine urgency, or motor slowness), moderate white matter changes (at least 1 region score <2 according to the Wahlund rating scale), and/or multiple lacunar infarcts (<2) on brain imaging. Neuropsychological testings for aMCI, the MoCA scoring, and HIS determination (HIS greater than 7) were also performed.
The criteria for the selection of NC were no history of either cognitive decline, neurological or psychiatric disorders, uncontrolled systemic medical disorders, or abnormal findings in conventional brain MRI.
MR Spectroscopy
The 2D-CSI 1 H-MRS studies were performed in all participants. All data were acquired on a standard 1.5 T GE scanner (Signa; General Electric Medical Systems, HDx Twinspeed, Wisconsin) using a standard eight-channel head coil. Axial fast FSE T2-weighted images (slice thickness: 5 mm, field of view [FOV]: 16 cm × 16 cm) were then acquired prior to spectroscopic acquisition at the basal ganglia level for MRS acquisition. The total regions of interest (ROIs) of the multivoxel section were about 192 cm3 (12 cm × 8 cm × 2 cm: anterior to posterior, left to right, thickness). A 2D-CSI 1 H-MRS point resolved spectroscopy (PRESS) pulse sequence (echo time = 35 ms, repetition time = 1500 ms, number of excitations = 1, phase × frequency = 18 × 18) was used for acquiring the spectroscopy data. Automatic prescanning was performed in all participants until all spectra had good quality (<10 Hz of full width at half height of the unsuppressed water peak and percentages of water suppression ≥98%). The ROIs for 2D-CSI 1 H-MRS were then classified according to their location assigned to 10 regions: bilateral posterior cingulate gyrus (PCG), white matter of the occipital lobe (OLWM), inferior precuneus (Pr), dorsal thalamus (DT), and white matter of the frontal lobe (FLWM). These regions are at particular risk for MCI or VCIND. The MRS acquisition scan time was 8 minutes and 12 seconds.
Postprocessing and metabolite quantification
Postprocessing was performed as follows: all subject initial data (P file) would be created by the host machine and acquired from the ADW4.5 workstation. All P files were then transferred to a dedicated UNIX system and processed using spectroscopy analysis by general electric software. Thus, every single volume of voxels was (FOV: 16.0 cm × 16.0 cm/phase, frequency: 18 × 18) × 2.0 cm = 1.58 cm3. A standard phantom containing detectable compounds was used as an external standard to calibrate the metabolite concentrations. Absolute metabolite concentrations with %standard deviation (SD; Cramer–Rao lower bounds) of metabolite peaks of interest >20% were excluded, thus indicating that these metabolites could be reliably estimate. Absolute concentrations were then calculated using a linear combination of model. 13,14 Metabolite concentrations (mmol/L) of NAA, Cr, Cho, and MI were quantified, and metabolite ratios (NAA/Cr, Cho/Cr, MI/Cr, NAA/MI, and NAA/Cho) were calculated.
Data Analysis
Statistical analysis and graphics were performed with SPSS Version 18.0 for Windows (SPSS, Chicago, Illinois). Group differences for age, education, MMSE and MoCA scores were compared among the 3 groups using a 1-way analysis of variance. As for absolute metabolite concentrations and metabolite ratios, we used a nonparametric statistical analysis of covariance as covariates (influencing factors such as age, education, or mental status scores) with a correction (Benjamin Hochberg) to do multiple pairwise comparisons between these 3 groups. A P value < .05 was considered to be statistically significant and the values were presented as mean ± SD.
Results
Table 1 describes the demographic characteristics and neuropsychological scores of the participants. Compared with NC participants, the baseline MMSE scores (P < .05) and MoCA scores (P < .01) were lower in patients with aMCI and VCIND, No significant differences were found among the 3 groups in regard to age and level of education (P > .05).
The absolute concentrations of NAA, MI, Cho, Cr, and the metabolite ratios of NAA/Cr, Cho/Cr, MI/Cr, NAA/MI, and NAA/Cho were obtained and we checked these metabolite concentrations, and metabolite ratios were examined for a normal distribution. Concerning gender and education, there were no differences among 3 groups for each metabolite concentration and metabolite ratio in any ROIs. Table 2 shows the averaged values of brain metabolites measured in the right side volumes of interest (PCG, Pr, OLWM, DT, and FLWM) among the 3 groups. Decreased NAA/MI ratios in the right PCG (P < .01 vs NC or P < .05 vs VCIND group) and in the right OLWM (P < .05 vs NC or vs VCIND group) along with decreases of NAA concentration (P < .05) and NAA/Cr ratio (P < .05), which were consistent with the elevation in the MI level (P < .05), were observed in the right PCG in the patients with aMCI (Figure 1: 1-4). Significantly decreased NAA/Cho ratios (P < .05) in the right FLWM (P < .01 vs NC or P < .05 vs VCIND group) and in the right DT (P < .05 vs NC or vs VCIND group), along with a consistently decreased NAA/Cr ratio (P < .05) in the left DT and FLWM were observed in the patients with VCIND. However, we did not find any metabolic changes in the right Pr in the 3 groups.
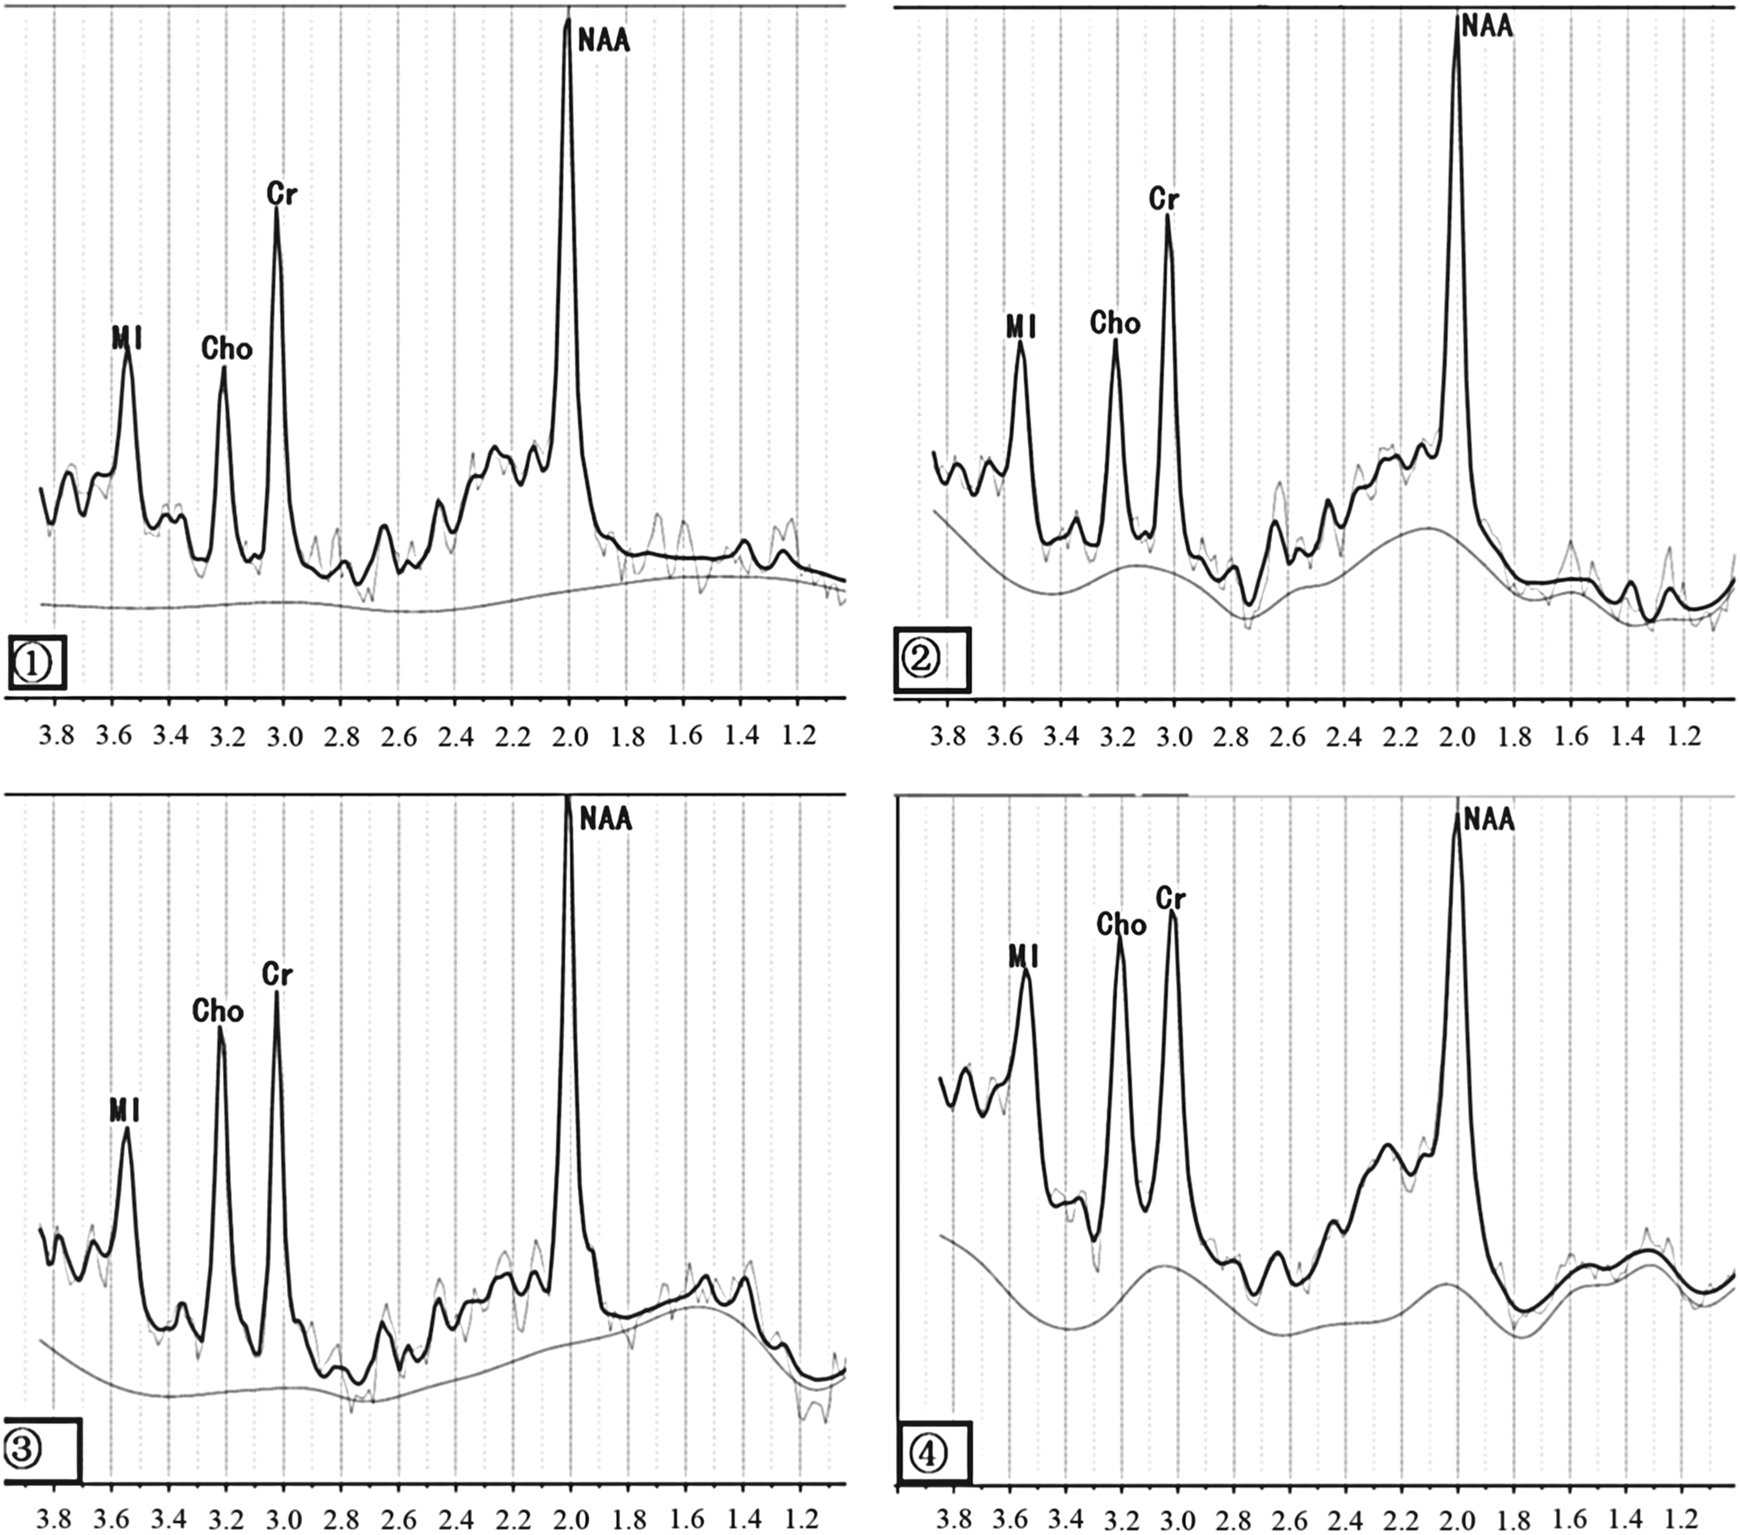
1-4 are examples of attained multivoxel spectra of the bilateral posterior cingulate gyrus (PCG) by linear combination of model evaluation of metabolite values: (1) normal control (NC) in left PCG) and (2) amnestic mild cognitive impairment (aMCI) in left PCG, (3) NC in right PCG, and (4) aMCI in right PCG. We could find myoinositol in the right PCG with aMCI increased, whereas the left may not be apparent.
Absolute Concentrations of Metabolites (mmol/L) and the Ratio of Metabolites From NC Participants, Patients With aMCI and VCIND.a
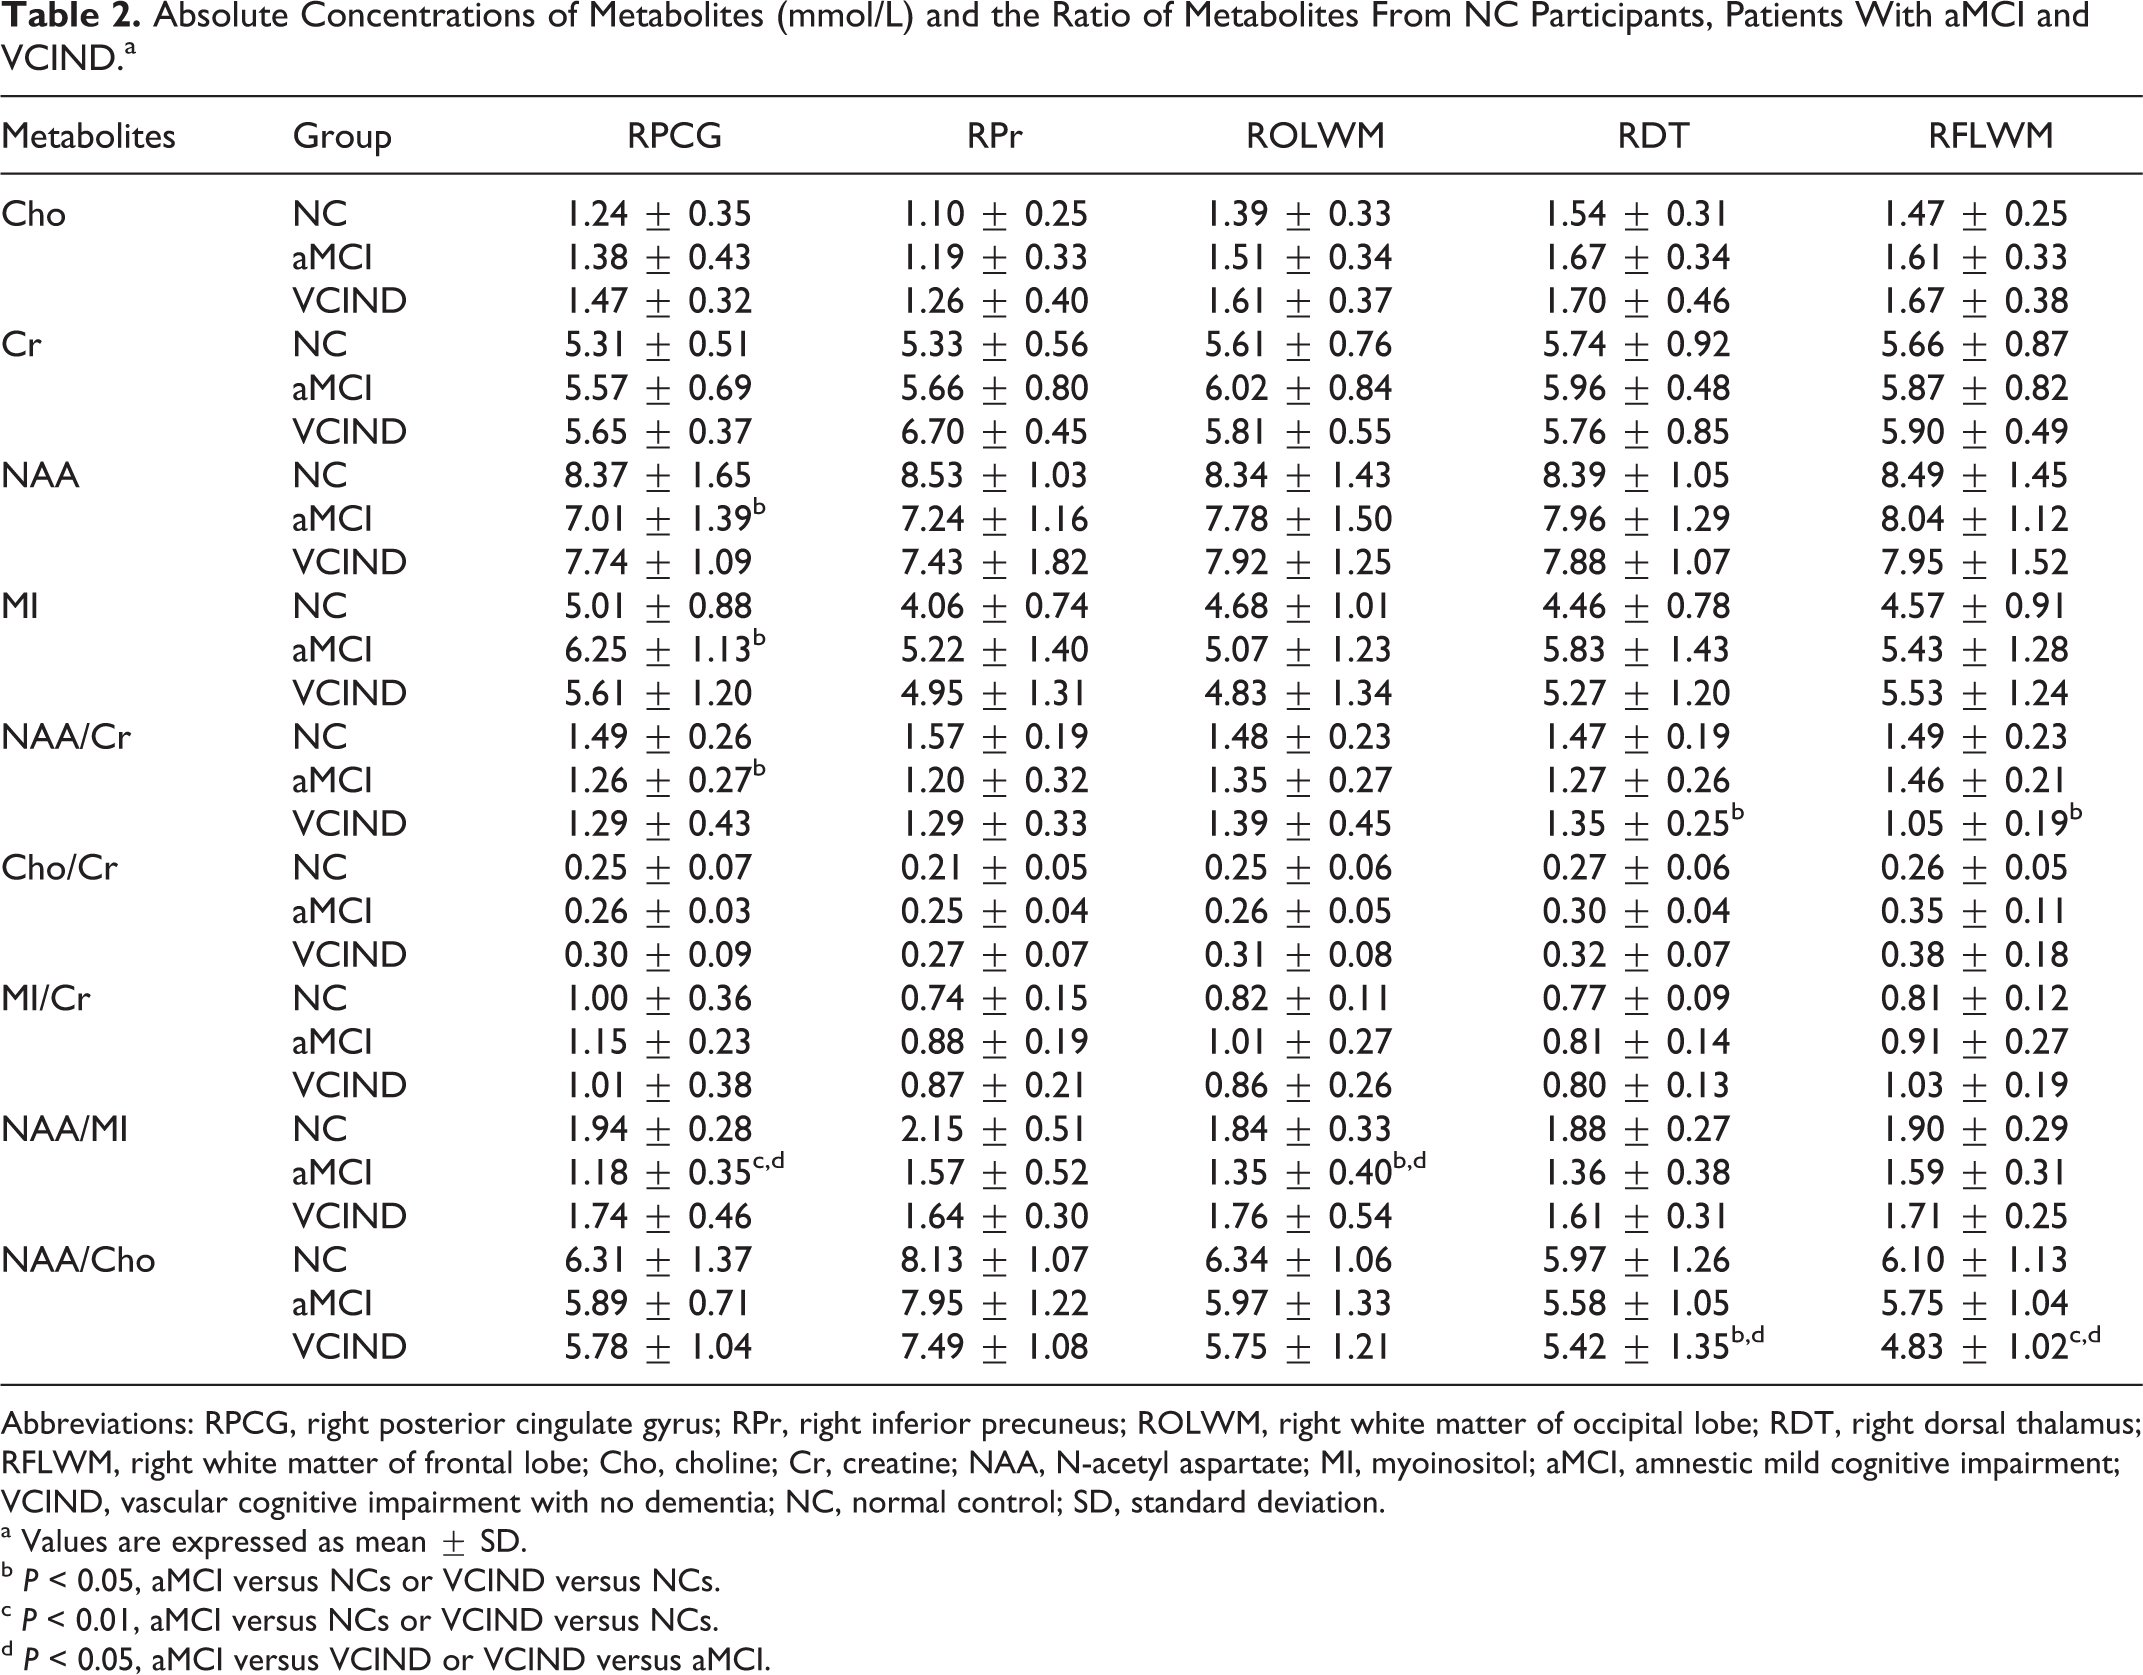
Abbreviations: RPCG, right posterior cingulate gyrus; RPr, right inferior precuneus; ROLWM, right white matter of occipital lobe; RDT, right dorsal thalamus; RFLWM, right white matter of frontal lobe; Cho, choline; Cr, creatine; NAA, N-acetyl aspartate; MI, myoinositol; aMCI, amnestic mild cognitive impairment; VCIND, vascular cognitive impairment with no dementia; NC, normal control; SD, standard deviation.
a Values are expressed as mean ± SD.
b P < 0.05, aMCI versus NCs or VCIND versus NCs.
c P < 0.01, aMCI versus NCs or VCIND versus NCs.
d P < 0.05, aMCI versus VCIND or VCIND versus aMCI.
Table 3 compares the averaged brain metabolite levels in the left of different regions in patients with aMCI and VCIND, and NC participants. In the aMCI individuals, significant decreases of NAA/MI ratio (P < .01 vs NC or P < .05 vs VCIND group) and NAA level (P < .05), and NAA/Cr ratio (P < .05) were found in the left PCG. The NAA/Cr ratio (P < .05) was found to decrease in the left Pr and DT, and the ratio of NAA/MI (P < .05) was also lower in the left OLWM than the NC participants and patients with VCIND, whereas the concentration of Cho (P < .05) was elevated in the left OLWM compared to NCs (Figure 2: 5-8). Unlike the patients with aMCI, in the patients with VCIND, elevated Cho and decreased NAA/Cho ratio were observed in the left FLWM (P < .01 vs NC) and OLWM (P < .05 vs NC). A decreased NAA/Cr ratio (P < .05) in the left DT was also observed in our study. Tables 2 and 3 indicated that patients with aMCI displayed significantly lower NAA/MI bilaterally in PCG and OLWM than NC participants or patients with VCIND, whereas patients with VCIND displayed markedly lower NAA/Cho in bilateral FLWM, left OLWM, and right DT than NC participants or patients with aMCI. These results may carry independent value for discrimination between patients with aMCI and VCIND.
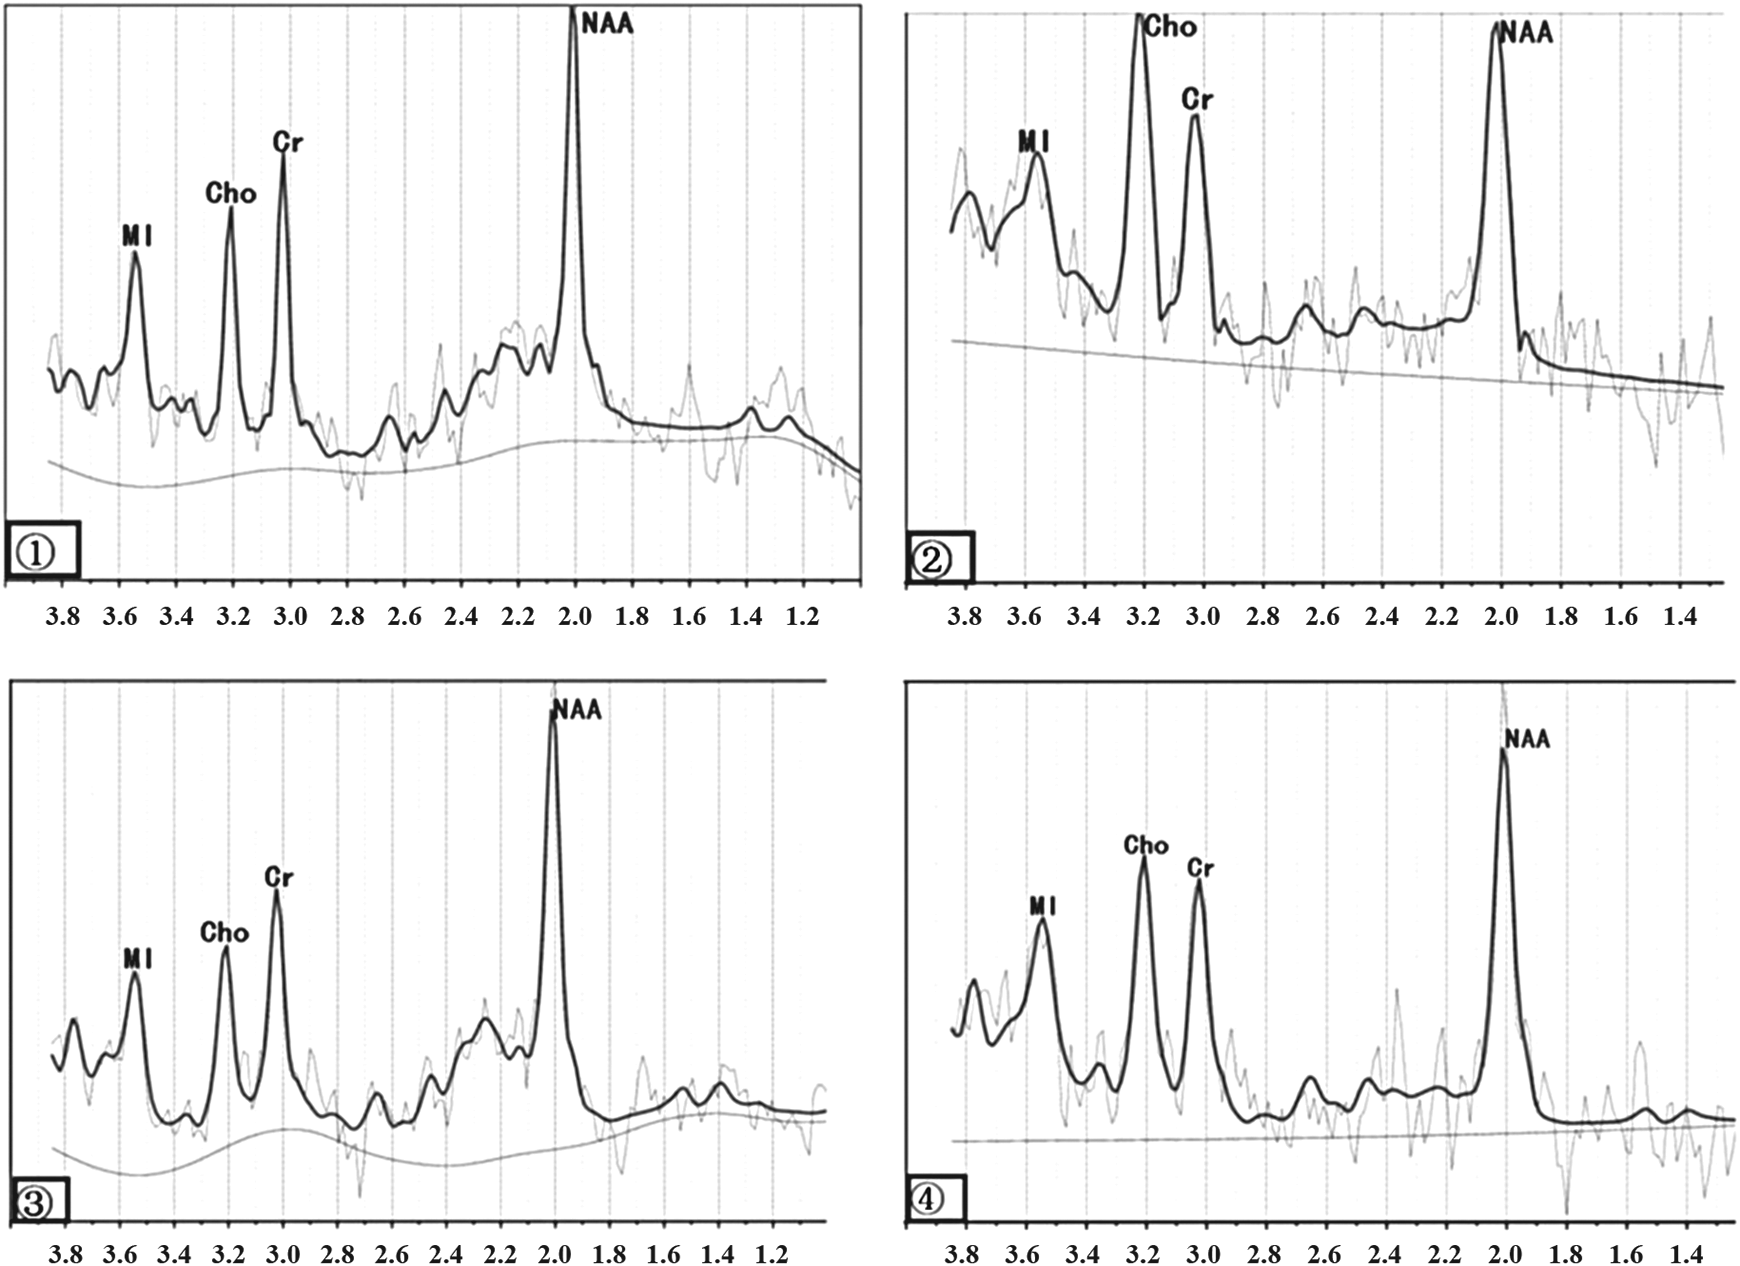
1-4 are examples of attained multivoxel spectra of the bilateral white matter of frontal lobe (FLWM) by linear combination of model evaluation of metabolite values: (1) normal control (NC) in left FLWM and (2) vascular cognitive impairment with no dementia (VCIND) in left FLWM, (3) NC in right FLWM and (4) VCIND in right FLWM. We could find choline in the left FLWM with VCIND significantly increased.
Absolute Concentrations of Metabolites (mmol/L) and the Ratio of Metabolites From NC Participants, Patients With aMCI and VCIND.
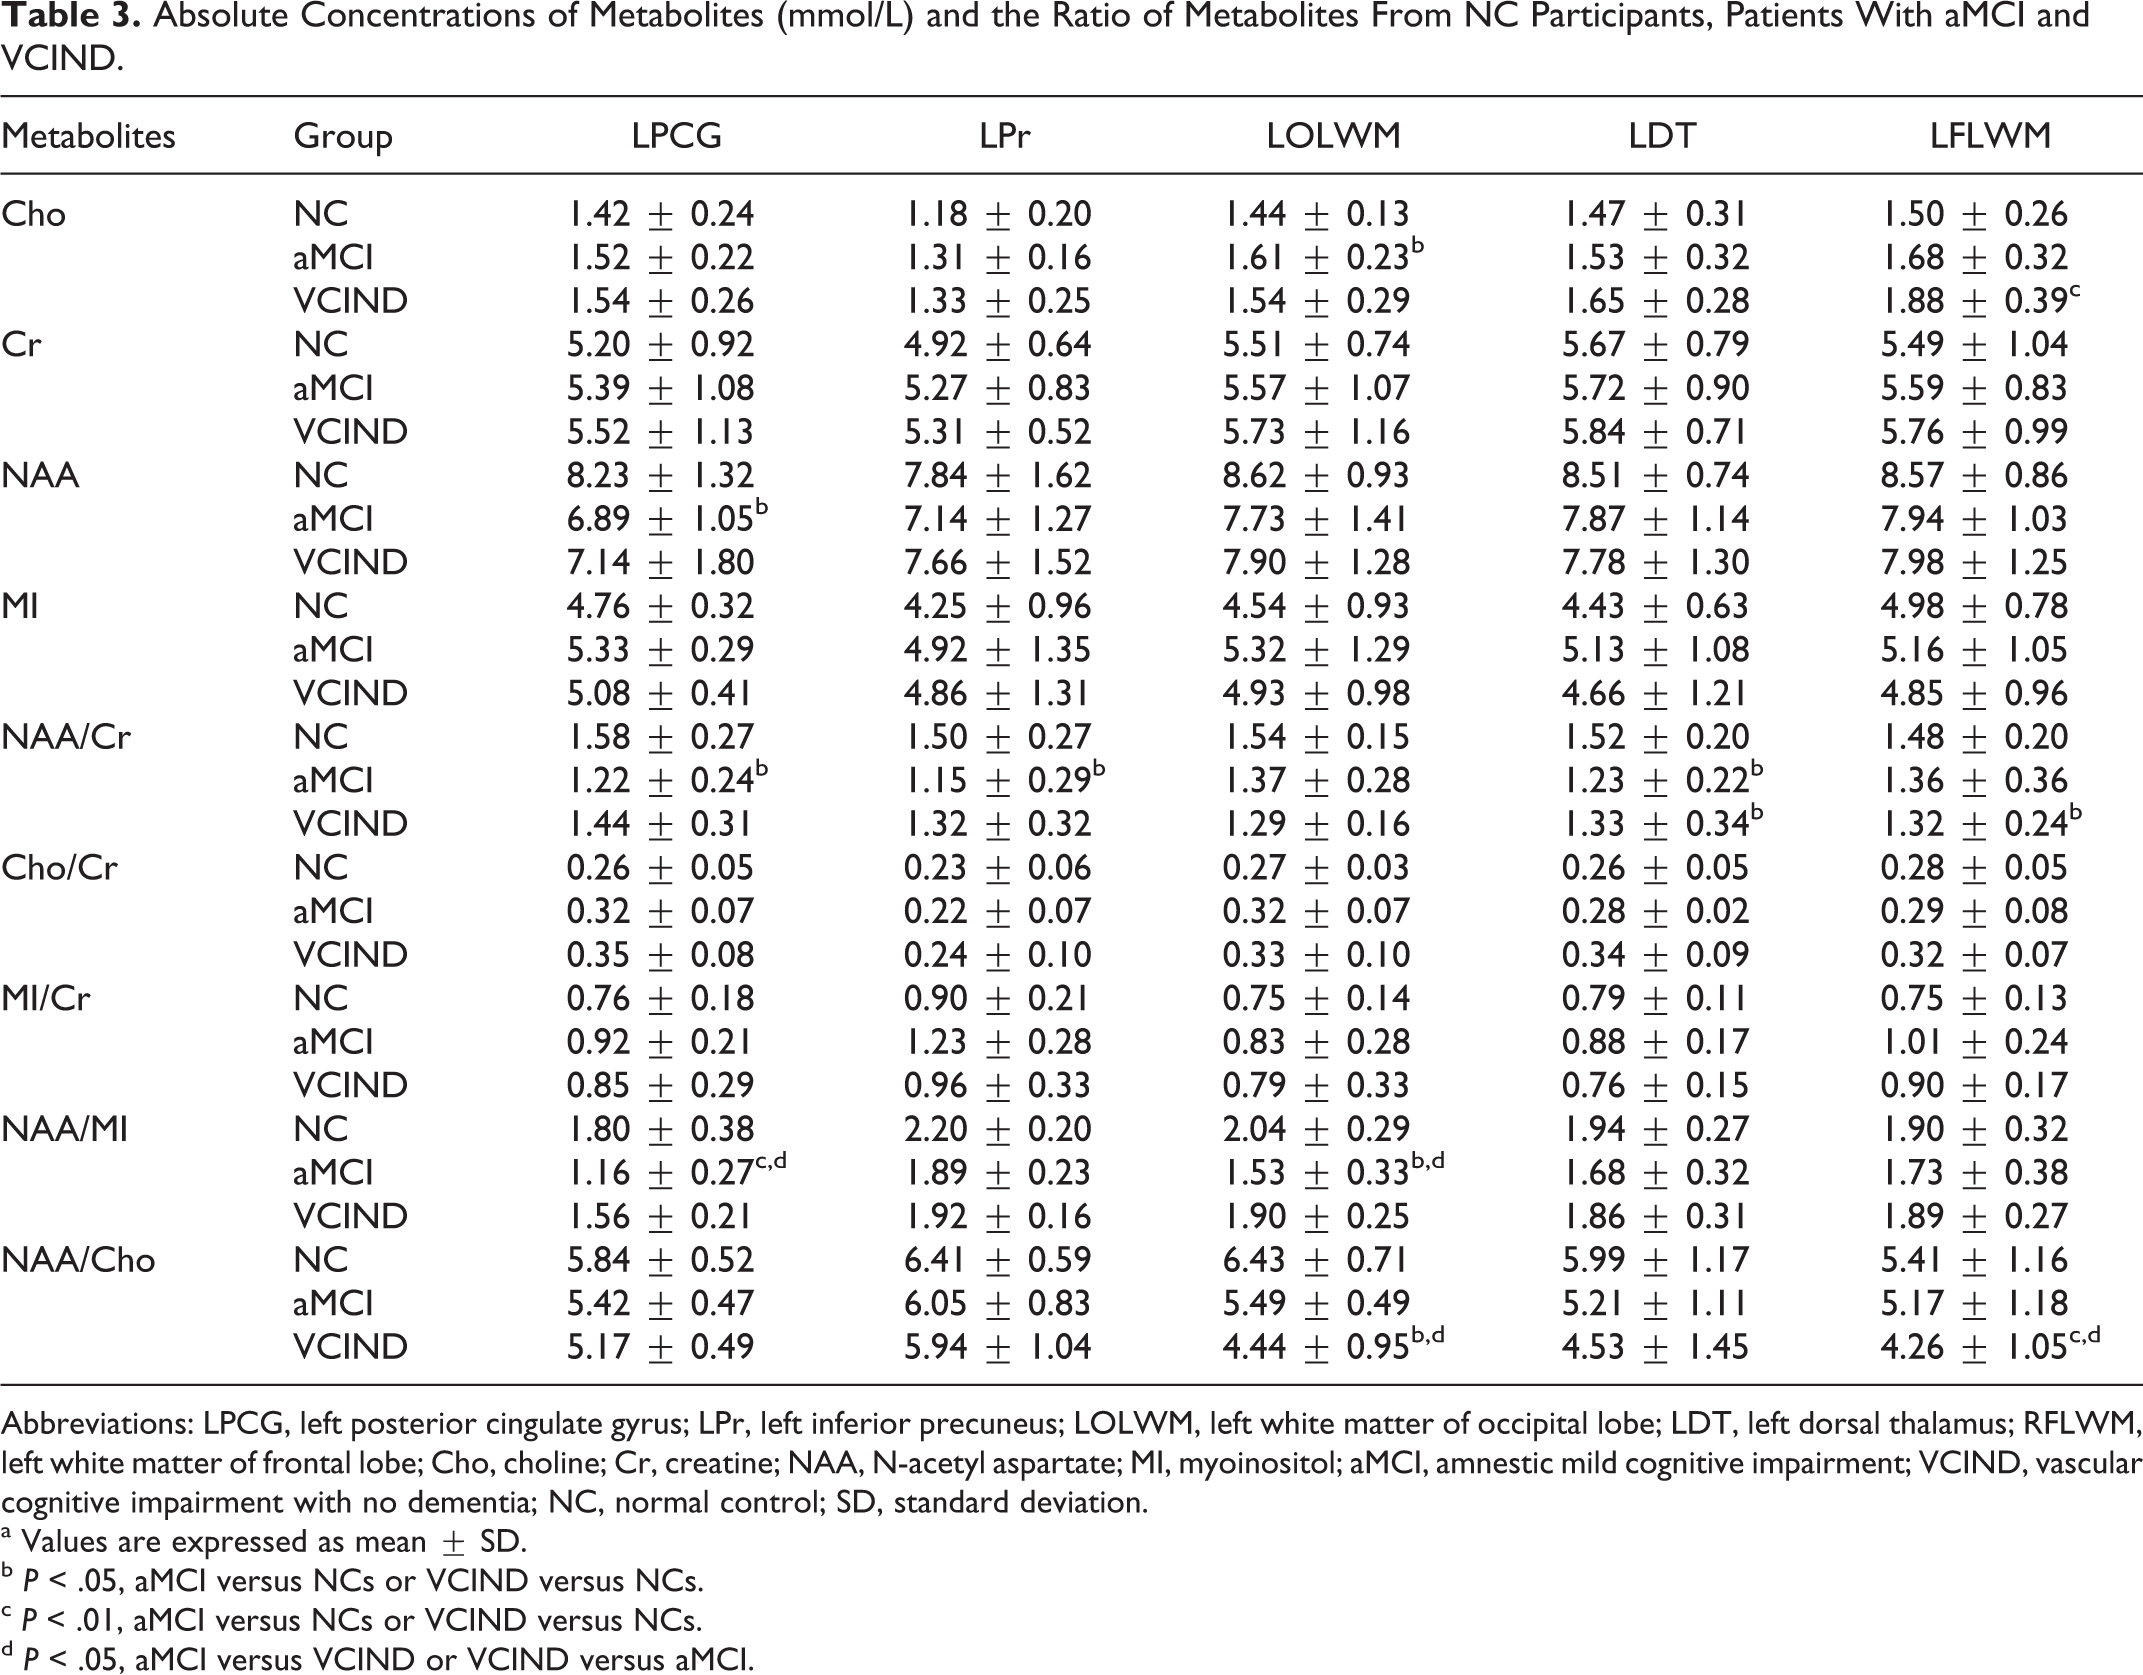
Abbreviations: LPCG, left posterior cingulate gyrus; LPr, left inferior precuneus; LOLWM, left white matter of occipital lobe; LDT, left dorsal thalamus; RFLWM, left white matter of frontal lobe; Cho, choline; Cr, creatine; NAA, N-acetyl aspartate; MI, myoinositol; aMCI, amnestic mild cognitive impairment; VCIND, vascular cognitive impairment with no dementia; NC, normal control; SD, standard deviation.
a Values are expressed as mean ± SD.
b P < .05, aMCI versus NCs or VCIND versus NCs.
c P < .01, aMCI versus NCs or VCIND versus NCs.
d P < .05, aMCI versus VCIND or VCIND versus aMCI.
Discussion
Using 2D-CSI MRS, a reduction in the NAA concentration and NAA/MI and NAA/Cr ratios was detected in the bilateral PCG and OLWM in the patients with aMCI. In the left inferior Pr and left DT of patients with aMCI, the NAA/Cr ratio is reduced whereas the NAA levels did not significantly change. However, significantly decreased NAA/Cho ratio in the bilateral FLWM, right DT, and left OLWM, along with NAA/Cr in the bilateral FLWM and DT, was observed in the VCIND group. So lower NAA/MI and NAA/Cr ratios, as well as concentration of NAA, were more pronounced in aMCI compared to the patients with VCIND. The posterior cingulate gyrus is a default network system which experiences neuronal and synaptic loss, as well as cognitive dysfunction in AD, 15 and the thalamus plays a crucial role in relaying sensation, spatial sense, and motor signals to the cerebral cortex, along with the regulation of consciousness, sleep, and alertness. People have paid attention to the role of thalamus injury in cognitive impairment gradually, and relationship between lower NAA/Cr ratio and DT has been demonstrated in several studies. 16,17 In agreement with these studies, patients with VCIND displaying thalamocortical dysfunction are associated with neuronal and axonal injury. The NAA is not only used as a measure of neuronal densities but of neuronal function, and our findings of decreased NAA levels may be related to lower brain glucose metabolism in the PCG and has been proposed as a marker of the early reflection of an impaired energetic metabolism. 18 In our study, the finding that patients with aMCI exhibit decreases in NAA/MI and NAA/Cr ratios in the bilateral PCG and OLWM was consistent with previous reports. 7,19 In the left inferior Pr, the decrease in NAA was found in patients with aMCI, which had also been measured by fluid-registered serial MRI to have the highest rates of atrophy. 20 Likewise, the reduction in NAA/Cr ratio in the left FLWM is also indicative of an energy deficit that might result from a defect in oxidative metabolism in neuronal mitochondria in patients with the VCIND group. 21 –23
Elevated MI/Cr in the PCG and OLWM of patients with MCI has been previously reported. 24 Instead of observing elevated MI/Cr, we found that the MI level was higher in the PCG and in the left OLWM in patients with aMCI when compared to the patients with VCIND and NC participants. Increased MI might indicate elevated neuroglial concentration. 25 Even though there have been some reports to suggest that the MI/Cr ratio was significant in different brain regions, 26 we did not find evidence for alterations in the MI level, or MI/Cr or NAA/MI ratios in patients with VCIND. According to Tables 2 and 3, the reduction of NAA/MI in the PCG and OLWM was more significant than other areas in the aMCI group. Our findings and previous studies might provide an effective criterion in evidence of MCI pathological progression. 27,28 It is more meaningful to find that NAA/MI ratios have a higher sensitivity than NAA/Cr ratios or NAA concentrations in the bilateral PCG and OLWM in patients with aMCI (Table 2 and Table 3). So, the decreased NAA/MI bilaterally in the PCG and OLWM might be a valuable marker to distinguish patients with aMCI from patients with VCIND or NCparticipants.
The Cho represents a constituent of cell membranes of cholinergic neurons to maintain their function and integrity, so increased Cho levels might be related to increased cell membrane phospholipid turnover. 29 The paratrigonal white matter areas, included in the OLWM and FLWM, are rich in cholinergic fibres deriving from the nucleus basalis of Meynert, which innervates large areas of the frontal and parietal neocortex, 30 and we showed increases in Cho in the left OLWM of patients with aMCI and left FLWM in the VCIND group compared to other regions. Hence, increased Cho may reflect damaged cholinergic neurons and increased membrane synthesis or phospholipid turnover in neurological diseases. 31 Thus a significant decrease in NAA/Cho in the bilateral FLWM regions in this study is suggestive of occurring a higher membrane turnover and decrease in NAA in these regions. The results showed that an increased Cho level is correlated with a decreased NAA/Cho ratio in the bilateral FLWM and left OLWM in patients with VCIND. The MRS data suggest that patients with VCIND probably have more severe damage in the FLWM and OLWM than the aMCI group and the NC group, and it also indicates that the NAA/Cho ratio (as well as the NAA/MI ratio in patients with aMCI) measured with MRS furnishes a means to quantify brain metabolic damage, allowing for the possibility of an effective criterion and a higher sensitivity than other metabolite markers. Thus, we believe that future longitudinal studies aiming to determine MR spectroscopic changes in absolute concentrations and relative concentrations will provide a more reliable and sensitive indicator of metabolic abnormalities in patients with aMCI and VCIND.
It is also worth noting that the prognostic value of VCIND as a diagnostic entity has not been fully determined. 32 In our study, we examined the neuroimaging differences of individuals with VCIND and aMCI by 2D-CSI 1 H MRS. Our study found a different distribution of metabolite changes in different brain regions between the 2 groups. To address this need, it would be of interest to perform further studies with longer follow-up of these individuals to establish the long-term rate of conversion, which includes measures with MRS and structural MRI studies. 33
In this study, although the 2D-CSI MRS technique offers the ability to provide extensive data from multiple contiguous voxels and enable us to detect the metabolic changes in different brain regions at the same time, the study is limited by the fact that the MRS technique was performed from a single slice (from the frontal to occipital regions of the brain). The hippocampus, which is not covered in the ROI in this study, is another important region that is known to be affected in patients with aMCI. We must improve the level of MRS technique, especially 3D-CSI MRS. In conclusion, the present study demonstrates MRS abnormalities in particular regions of the brain of patients with aMCI and VCIND and provides further evidence that the absolute and relative concentrations is useful for detection of the characteristic patterns of metabolic concentration in patients with dementia. Further research prospectively in evaluating the effect of new drugs proposed for the prevention and treatment of dementia is required.
Footnotes
Acknowledgments
We thank Dr Stanley Lin for helpful discussions and for checking the language.
Authors’ Note
Yan-Yan Liu and Zhong-Xian Yang contributed equally to this manuscript and should be considered as cofirst authors.
Declaration of Conflicting Interests
The authors declared no potential conflicts of interest with respect to the research, authorship, and/or publication of this article.
Funding
The authors disclosed receipt of the following financial support for the research, authorship and/or publication of this article: the National Natural Science Foundation of China (key project No. 30930027) and the National Natural Science Foundation of China (general project No. 60971075).