
Abstract
In Alzheimer’s disease (AD), placebo-controlled long-term studies of cholinesterase inhibitors (ChEIs) are not permitted for ethical reasons. Therefore, in these studies, patients’ outcomes on cognitive and functional assessment scales must be compared with mathematical models or historical data from untreated cohorts. PubMed and previously published long-term extensions of clinical trials and naturalistic studies of ChEIs were examined to identify empirical statistical models and other approaches, such as use of data from historical cohorts or extrapolated changes from extension studies, that were used to draw comparisons between ChEI-treated and untreated patients. The models and methods were described. It is essential to be aware of the limitations of comparisons made with these approaches. Prediction models based on ChEI-treated patients can be used in the studies of new treatments when those treatments are added to ChEIs. More sophisticated models that also accommodate patient-specific characteristics should be developed for comparisons in future long-term AD studies.
Keywords
Introduction
The course of Alzheimer’s disease (AD) extends over several years, so it is important to assess the potential utility of cholinesterase inhibitor (ChEI) therapy over longer time periods than are afforded by the usual 6-month randomized trials. Treatment success includes not only short-term improvement in symptoms but also a reduced decline over the long term. 1 Currently, placebo-controlled trials that are longer than 3 to 6 months are considered unethical because of the demonstrated efficacy of ChEIs. Open-label extensions of clinical trials or well-designed naturalistic AD studies can be used to investigate the longer term effects of these drugs. New therapies might be evaluated when added to standard treatment (ChEIs and/or memantine) using a randomized, controlled design. Different approaches that compensate for the lack of a placebo group have been published previously.
An adequate description of the natural history of AD is important for the analysis and prediction of the potential cognitive and functional changes caused by ChEI therapy in the longitudinal trajectory of the disease. 2 Therefore, reliable mathematical models of how both untreated and ChEI-treated cohorts of patients can be expected to deteriorate, using various assessment scales in different domains, are needed. Prediction models of decline in AD can also be used to examine the role played by associated factors (covariates) in influencing deterioration in these patients, such as the severity of the disease, age, sex, and years of education.
Since the late 1980s, several studies have been undertaken to investigate the decline associated with untreated patients with AD. Early works examined simple change in the scores of mental status tests, for example, the Blessed Information–Memory–Concentration (BIMC) test, 3 in which change is usually measured by subtracting the initial score from the final score, then dividing the result by the length of time between the first and last assessments. 4 -6 Linear regression models were subsequently introduced, including the frequently used method of least-squares regression, which calculates the slope (an estimate of the average rate of decline) that best fits all points in time since the baseline measurement. 7,8 The advantages of regression analyses over simple change scores are their abilities to model the influence of covariates on the decline pattern as well as any potential nonlinearity. In early publications, it was assumed that the decline in the Mini-Mental State Examination (MMSE) 9 and BIMC scores was nearly linear. 6,10 However, it was observed in naturalistic AD studies that the measurement of change is complicated by variable follow-up intervals and the possible nonlinear patterns of the changes. Using the Alzheimer’s Disease Assessment Scale–cognitive subscale (ADAS-cog), 11 Stern et al 12 suggested the presence of a significant quadratic effect between the baseline and the annual rate of cognitive change. Thus, there is a faster decline among untreated individuals with a moderate level of cognitive impairment than in those with milder or more severe impairment. This finding has been corroborated by other studies. 13,14 Furthermore, several AD studies have shown that disease progression is heterogeneous, depending on several factors, such as patient characteristics and clinical variables. 14 -17 The mixed-effects models 18 used in more recent studies 19 -22 have the advantage of including random effects that allow the baseline level of disease severity to be higher or lower (random difference in the intercept) and the rate of decline to be faster or slower (random difference in the slope over time).
Treatment with ChEIs might alter the natural course of AD. 23 The changes in progression rates in prediction models of expected change in ChEI-treated patients can be used in clinical research, for example, when measuring the long-term effectiveness of new disease-modifying therapies that might alter the course of the disease. For ethical reasons, randomized trials that investigate the effects of new drugs are currently being conducted in patients already receiving standard treatment (ChEI and/or memantine).
The purpose of this review is to present the available empirical statistical models and other methods for describing the longitudinal cognitive or functional rates of change in AD.
Materials and Methods
To determine the available prediction models that estimate the cognitive and functional long-term courses of patients with AD, the literature available up to August 2011 was searched, using the US National Library of Medicine’s PubMed database. Only articles that included humans and were written in English were considered. Models based on assessment scales other than cognitive tests or activities-of-daily-living (ADL) measures, or that were developed for dementia diagnoses other than AD, or formulas requiring specialized measures on specific topics (eg, behavioral or psychological symptoms, language assessments, and extrapyramidal symptoms) were excluded. Articles that presented incomplete data to calculate their formulas were also omitted. Prediction models that demanded advanced statistical computer software or specialist knowledge to perform calculations were also beyond the scope of this review, because its focus is the models and methods available for use in clinical research.
Previously known articles containing empirical statistical models were examined to determine the key words that were used for their indexing in PubMed. The search was complicated by a considerable difference in the key words used for these articles. Search algorithms were based on key words such as Alzheimer disease, longitudinal studies, follow-up studies, disease progression, cognition, activities of daily living, and statistical models. The literature search revealed several thousand articles, so an exhaustive review of every model and method developed for this kind of AD research was not feasible.
Therefore, published long-term studies of ChEI treatment (ie, with a duration of at least 1 year), both open-label extensions from randomized clinical trials and naturalistic studies, were thoroughly examined to identify any prediction models of untreated patients with AD or other approaches that were used to draw comparisons between treated and untreated patients. This article focuses primarily on empirical models and methods used in previous longitudinal studies. Reference lists of articles relevant to this review were also hand searched to identify other articles of interest.
A brief description of the statistical analysis that was used, the method used to develop the empirical model, and the degree of explanation of the variance (if reported) are presented for each model. The AD cohorts used to derive the prediction models are described, if they were defined in the original article, for example, the number of individuals, the follow-up interval, and the cognitive and ADL abilities at baseline. The strengths and weaknesses of the different empirical models and of the other methods used to compare treated and untreated patients are also discussed, together with statistical modeling approaches and methodologies that are relevant to the prediction models and methods described in this review.
Results
Empirical Statistical Models
Table 1 shows an overview of the prediction models presented in this review.
An Overview of the Prediction Models Presented in this Review.
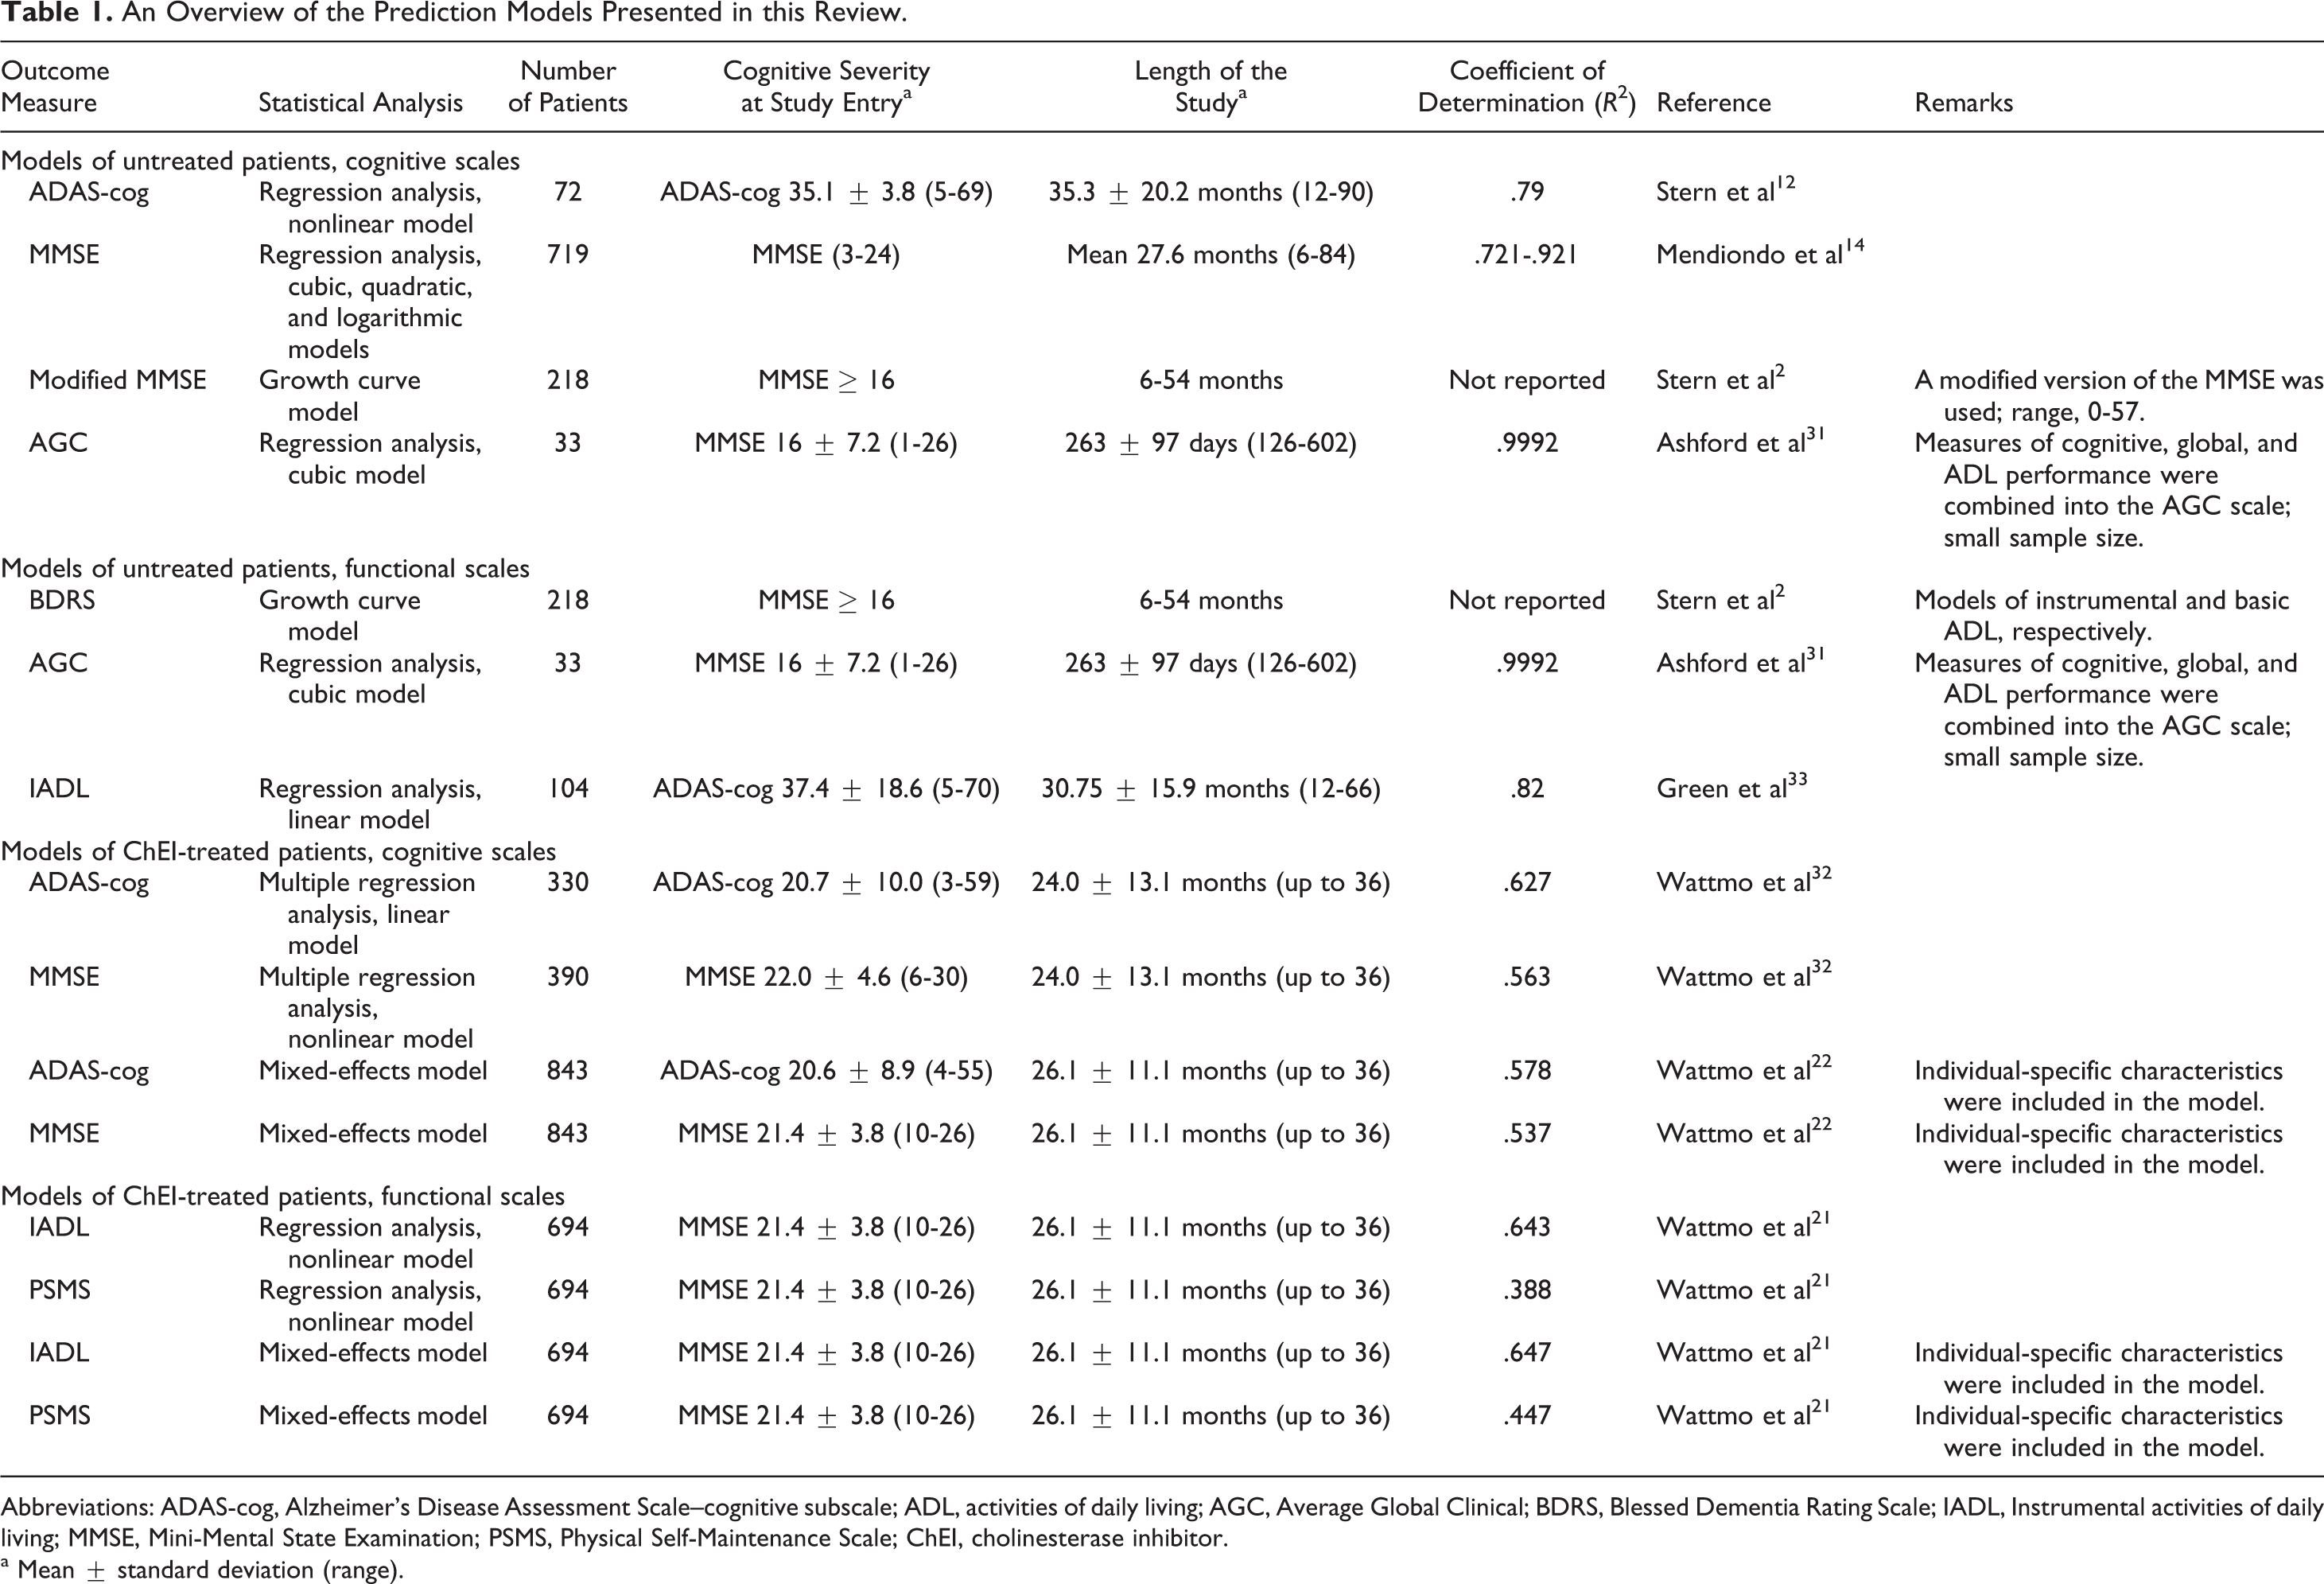
Abbreviations: ADAS-cog, Alzheimer’s Disease Assessment Scale–cognitive subscale; ADL, activities of daily living; AGC, Average Global Clinical; BDRS, Blessed Dementia Rating Scale; IADL, Instrumental activities of daily living; MMSE, Mini-Mental State Examination; PSMS, Physical Self-Maintenance Scale; ChEI, cholinesterase inhibitor.
a Mean ± standard deviation (range).
Prediction of Cognitive Outcomes in Untreated Patients With AD
A commonly used method in long-term open-label extensions and naturalistic studies 24 -27 is the Stern equation. Stern et al 12 used a stepwise regression analysis to develop a nonlinear model to predict the subsequent rate of cognitive change in untreated patients with AD on the basis of their ADAS-cog scores at study entry. The outcomes from the empirical model corresponded well to the decline in a real placebo-treated group. 24,26 The Stern equation was based on 72 patients who were followed for 12 to 90 months (mean ± standard deviation [SD], 35.3 ± 20.2 months), with a reported mean baseline ADAS-cog score of 35.1 ± 3.8 points (range, 5-69). The degree of explanation of the variance in the prediction model was high (R 2 = .79, F 5,218 = 161.0, P < .0001). The observed change in a treated cohort can be compared with the predicted change using the following formula.
The Stern model: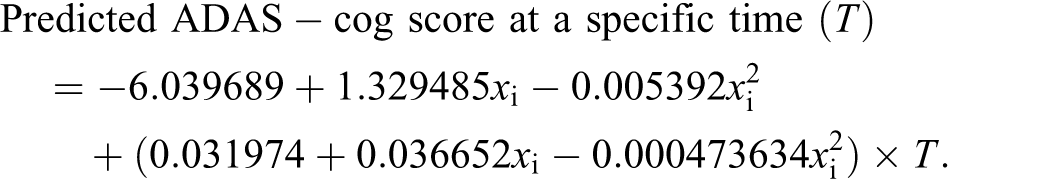
In this equation, T is the time from baseline in months and x i is the baseline ADAS-cog score for an individual.
Mendiondo et al 14 showed that AD progression over time could be modeled using a quadratic, cubic, or logarithmic function of the MMSE score. For each pair of MMSE scores, they calculated the rate of change in points per year. The mean rate of change for each MMSE point (3-24) was then inverted to obtain an estimate (in years per point) of the time required for the MMSE score to decrease by 1 point as a function of the average MMSE score. These equations were based on 719 untreated patients who were followed from 6 to 84 months (mean, 27.6). The quadratic prediction model was used in a 5-year study of rivastigmine. 28
The Mendiondo models:
Another equation derived from the same data set has also been described
29
:
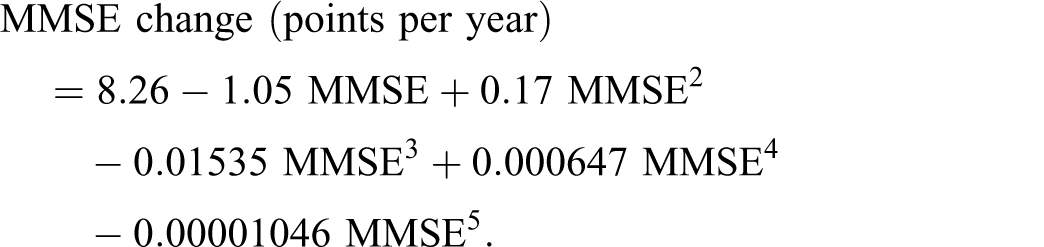

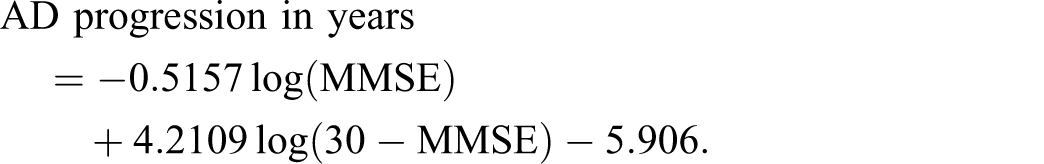
In these equations, MMSE is the MMSE score at baseline (3 ≤ MMSE ≤ 24).
Stern et al 2 applied a growth curve model to prospective data and described the progression of untreated patients with AD over time. They used a modified MMSE test and the functional Blessed Dementia Rating Scale (BDRS). 3 The model was based on 218 patients who had at least 16 MMSE points at study entry and were followed from 6 to 54 months. The changes in the test scores between all 6-monthly visits were calculated for each patient. In the next step, the average change in a score was computed, that is, the growth rate as a function of the present score. In the growth model, the starting score generates a prediction of the score at the next time interval, and the procedure is repeated until the score reaches its limit. The values of the model parameters determine the shape of the model and the point of maximal change. The authors also presented an extended empirical model that included the age at onset, as an initial step toward a specific predictor profile. 30
The Stern models:
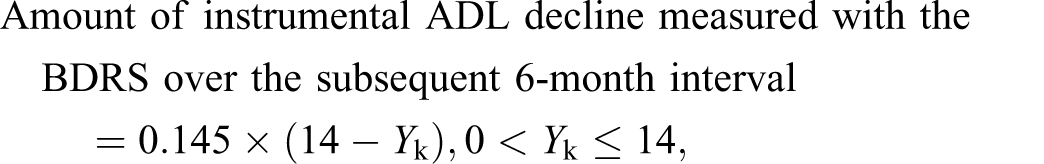

in which Y k is the current score in each of the above-mentioned tests.
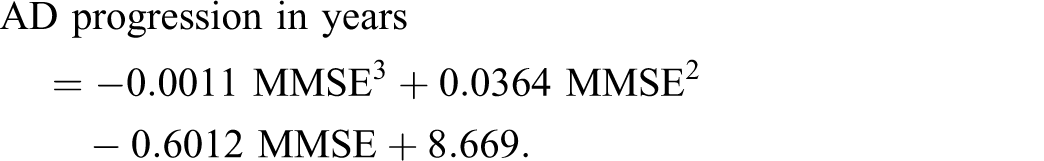
Ashford et al 31 described a “time index” model, using measures of cognitive, global, and ADL performance combined into an Average Global Clinical (AGC) scale, in which “days of illness” was estimated from the severity score. The 3 different domains, each consisting of a 50-point scale, should yield comparable results. The rate of change (points/day) was calculated by dividing the AGC difference by the number of days between the assessments. For each possible AGC severity score, the average rate of change was calculated using all pairs of severity values with midpoint scores within 5 points of the severity score, that is, a sliding average. The results were then inverted to obtain days per point. The prediction model was based on 33 untreated patients with AD (27 females) who were evaluated on at least 2 separate occasions (mean ± SD interval, 263 ± 97 days; range, 126-602 days) and had a reported mean baseline age of 75 ± 7.7 years (55-85 years) and an MMSE score of 16 ± 7.2 points (1-26). Using least-squares regression, which explained 99.92% of the variance, the fitted cubic equation was:
The Ashford model:
where X is the AGC score, scored on a 50-point scale.
A calculation may be performed to estimate time from the MMSE score (R
2
= .90):
Prediction of Cognitive Outcome in ChEI-Treated Patients With AD
Wattmo et al 32 used a multiple regression analysis to develop empirical models to predict the subsequent rate of cognitive change in donepezil-treated patients with AD on the basis of their ADAS-cog or MMSE scores at the start of ChEI therapy. These equations were based on 330 (ADAS-cog) and 390 (MMSE) patients, respectively, who were followed for up to 36 months (mean ± SD, 24.0 ± 13.1 months), with a reported baseline ADAS-cog score of 20.7 ± 10.0 points (range, 3-59), and an MMSE score of 22.0 ± 4.6 points (6-30). The regression analyses showed a good fit of the models, ADAS-cog (R 2 = .627, R = .792, P < .001) and MMSE (R 2 = .563, R = .750, P < .001).
The Wattmo models (ChEI-treated patients):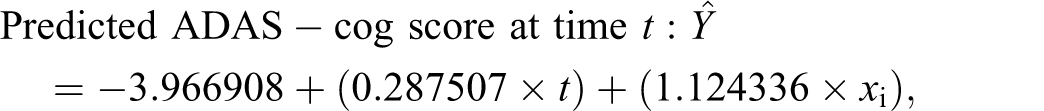
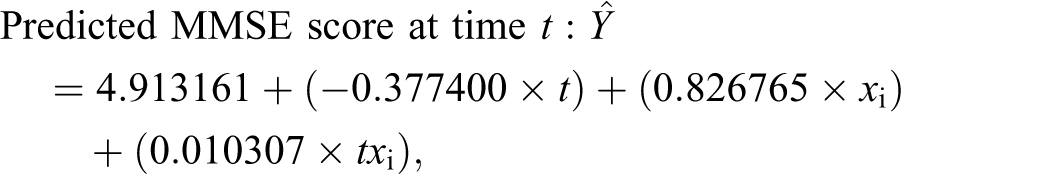
where t is the time in months between the start of treatment (baseline) and the actual visit and x i is the baseline cognitive score for patient i.
Using mixed-effect models, the authors also presented more individual-specific ADAS-cog and MMSE prediction models based on 843 ChEI-treated patients with AD. The percentages of variance accounted for in the dependent variable, regarding all fixed predictors, were 57.8% for ADAS-cog and 53.7% for MMSE, which implies a good fit of the models (P < .001).
22
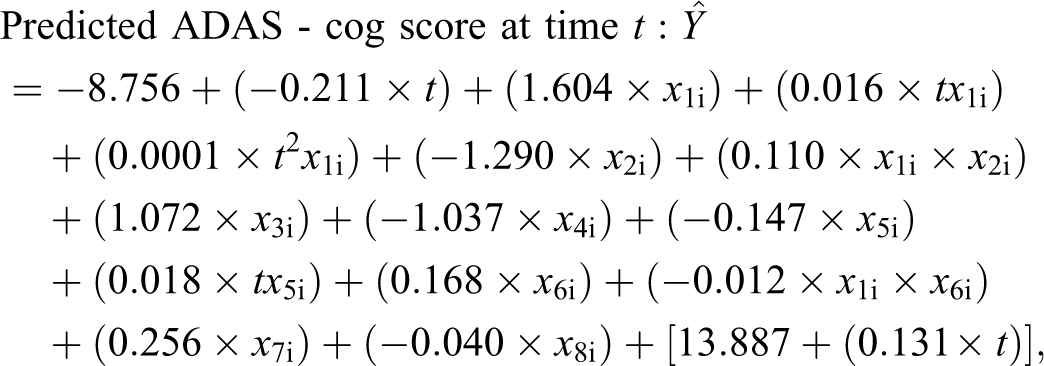
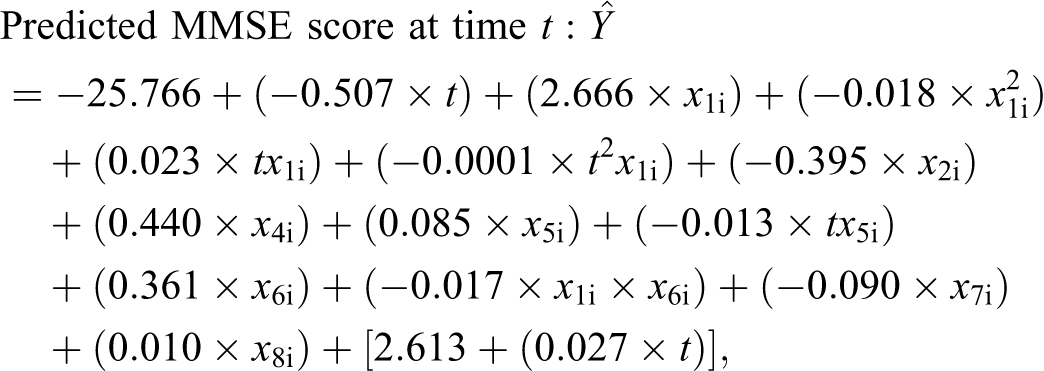
where the fixed effects are t is the time in months between the start of ChEI treatment (baseline) and the actual visit; x 1i is the baseline cognitive score for patient i; x 2i is the gender (male = 0, female = 1); x 3i is the apolipoprotein E (APOE) ∊4 carrier (no = 0, yes = 1); x 4i is the nonsteroidal anti-inflammatory drugs/acetylsalicylic acid (no = 0, yes = 1); x 5i is the education in years; x 6i is the age at first assessment in years; x 7i is the IADL score at baseline; x 8i is the mean percentage of the maximum recommended ChEI dose, that is, 10 mg donepezil, 12 mg rivastigmine, and 24 mg galantamine; [random intercept and random time coefficient].
Prediction of Functional Outcomes in Untreated Patients With AD
Green et al 33 developed a simple linear regression equation to describe the expected annual rate of functional change in untreated patients with AD on the basis of the Instrumental Activities of Daily Living (IADL) scale 34 scores at study entry. Green’s model was based on 104 patients who were followed for 12 to 66 months (mean ± SD, 30.75 ± 15.9 months), with a mean observed baseline ADAS-cog score of 37.4 ± 18.6 points (range, 5-70) and an IADL score of 22.3 ± 6.4 points (range, 9-30). The degree of explanation of the variance in the prediction model was high (R 2 = .82, F 1,20 = 166.04, P < .0001). This baseline-dependent linear equation has been used to calculate historical controls in previous studies. 21,35
The Green model:
in which ▵IADL is the annual rate of decline in the IADL score and IADLBas is the IADL score at baseline.
Prediction of Functional Outcomes in ChEI-Treated Patients With AD
Wattmo et al 21 developed simple nonlinear regression models to describe the expected annual rate of functional change in ChEI-treated patients with AD on the basis of the IADL or Physical Self-Maintenance Scale (PSMS) 34 scores at the start of ChEI therapy. These models were based on 694 patients who were followed for up to 36 months (mean ± SD, 26.1 ± 11.1 months), with a mean observed baseline MMSE score of 21.4 ± 3.8 points (range, 10-26), an IADL score of 16.0 ± 5.5 points (range, 8-29), and a PSMS score of 7.5 ± 2.1 points (range, 6-21). The prediction models explained a substantial degree of the variance in the data set, IADL (R 2 = .643, R = .802, P < .001), and PSMS (R 2 = .388, R = .623, P < .001).
The Wattmo ADLs models (ChEI-treated patients):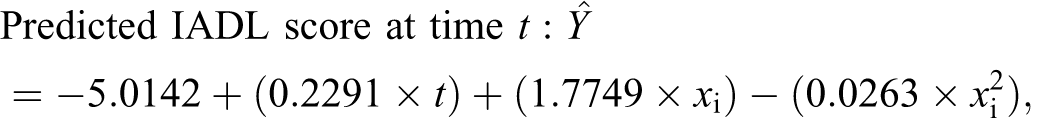
where t is the time in months between the start of treatment (baseline) score and the actual visit and x i is the baseline IADL or PSMS score.
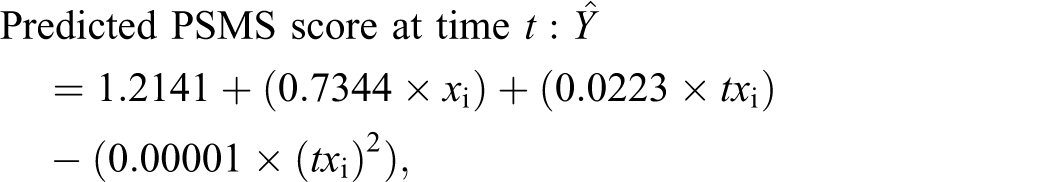
Extended IADL and PSMS empirical models derived with the statistical approach mixed-effect models were also reported. The percentages of variance accounted for the dependent variable, including all fixed predictors, were 64.7% for IADL and 44.7% for PSMS (P < .001), which shows a good fit of the models.
21
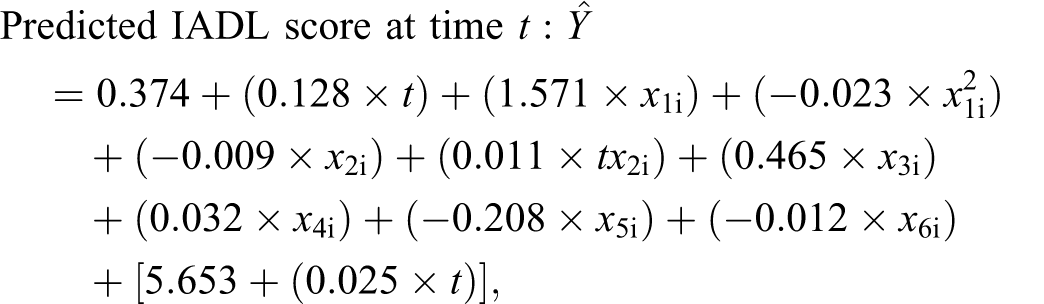
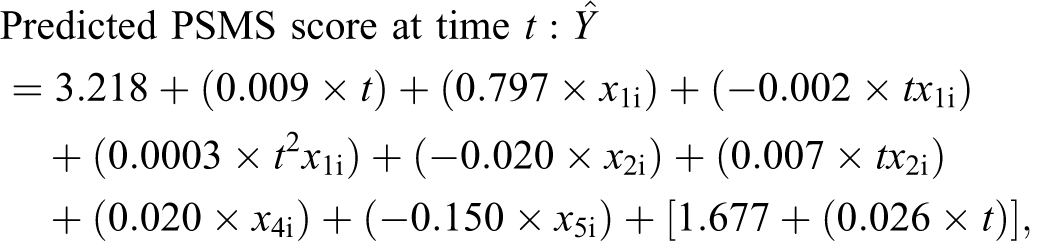
where the fixed effects are t is the time in months between the start of ChEI treatment (baseline) and the actual visit; x 1i is the baseline IADL or PSMS score for patient i; x 2i is the education in years; x 3i is the solitary living at baseline (no = 0, yes = 1); x 4i is the age at first assessment in years; x 5i is the MMSE score at baseline; x 6i is the mean percentage of the maximum recommended ChEI dose, that is, 10 mg donepezil, 12 mg rivastigmine, and 24 mg galantamine; [random intercept and random time coefficient].
Other Methods of Evaluating Long-Term AD Therapy
Historical Cohorts of Untreated Patients With AD
Another approach compares the change in the treatment group with that in historical controls using earlier reported mean points of decline per year. The annual reduction in the MMSE score in untreated patients is estimated to be, on average, 2 to 4 points/year, 6,13,36 and the mean rate of deterioration using the ADAS-cog scale is 5 to 8 points/year, 12,37,38 although it may be 9 to 11 points/year in the moderate stage of AD. 12 The BIMC score was observed to increase, on average, approximately 3 to 4 points annually in untreated patients. 6,39,40 Longitudinal studies in moderate to severe AD using the Severe Impairment Battery (SIB) 41 have shown a mean annual rate of decline of 17.1 points (MMSE, 0-17) but 17.6 (MMSE, 0-4) to 18.8 points (MMSE, 0-11) per year in more advanced stages. 42,43 The reported mean rate of decline in ADL, measured with the total Disability Assessment for Dementia 44 score is 10.8 points after 12 months, 45 and the estimated mean annual deterioration is 2.06 points on the IADL scale and 2.44 points on the PSMS. 33 Several longitudinal studies of ChEI therapy in AD have compared their results with previously reported amounts of decline. 21,25,28,46,47
Open-Label Extension Studies
In open-label extension studies, it is possible to compare the placebo-treated group’s mean rate of change in the double-blinded period with the mean rate of later change in the extension period. 48 Figures that illustrated the mean changes in scores between baseline in the original randomized trial and time points during the extension study for the placebo and treatment groups have also been presented. 49 -51 Using a mixed regression model, the assessment of the long-term treatment benefit in the extension can also be compared between the continuous and delayed treatment (placebo) groups from the original randomized trial. 52 Another approach is to compare changes in patients in an open-label extension to the projected change in the placebo-treated group by using extrapolation, as if the placebo treatment had been continued throughout the extension study. 53
Discussion
In this review, we have presented several empirical statistical models for estimating the longitudinal cognitive and functional outcomes in cohorts of both untreated and ChEI-treated patients with AD. An advantage of these prediction models is that the patients’ baseline scores are considered when calculating the expected outcome for a cohort over time. Identical disease severity at baseline is assumed, for example, between the actual ChEI-treated cohort and the calculated untreated cohort. The severity of AD has been described as an important predictor of the rate of cognitive and functional decline. 13,33
Nevertheless, heterogeneity of the course of the disease occurs among patients with AD. A variety of symptoms and other factors might influence the assessment of cognition and function. The variation observed in the measurement of AD severity in individual patients can be related to somatic disorders and concomitant medications, behavioral and psychiatric symptoms, daily fluctuations in performance, and various disease-associated changes over time. Longer time intervals between the assessments performed for an individual yield more reliable measures of changes. 29 Assuming that the population is normally distributed, the course of the disease in 95% of AD cohorts will fall within 2 SD from the mean, that is, the 95% confidence interval of the presented models.
Prediction models might also be used in sample-size calculation and study planning. Sample-size calculation includes an estimation of the variance obtained from a previous similar study, for example. Using the outcome from a prediction model based only on the individual’s cognitive score at study entry might imply that the variance becomes smaller than it would be in an actual patient population, because all the patients with identical baseline scores also obtain the same scores over time. This limitation of the baseline-dependent models can lead to an underestimation of the sample size. A study with a sample size that is too small is likely to miss effects that are of scientific importance because of a lack of power (ability to reject a false null hypothesis correctly). 54 Prediction models that include demographic and clinical factors that have been suggested to alter disease progression in AD can be used in clinical trial design, for example, to simulate the outcome of studies including different cohorts. The composition of the cohort under study might be one of the explanations for the heterogeneity of results observed between different studies. New studies are warranted to evaluate differences in short-term response to AD therapies and long-term outcome based on various patient characteristics. Moreover, the outcome of the prediction models might be validated using the outcomes of future studies including different AD cohorts.
The fact that placebo-controlled designs including untreated patients with AD are not allowed because of ethical concerns is a limitation of ChEI therapy studies that are longer than 6 months. Therefore, it is necessary to use extensions of randomized clinical trials or naturalistic cohort studies to investigate the longer term effects of these drugs. 55 Currently, new pharmacological treatments, such as vaccines, are evaluated in clinical trials in addition to standard therapy (ChEI and/or memantine). However, placebo-controlled trials and the subsequent open-label extensions are limited by the highly preselected clinical populations of patients with AD. Individuals participating in clinical trials tend to be younger, with a higher level of education and a better financial situation, than patients not included in the trials. 56,57 These individuals might deteriorate differently over the longer term and have lower mortality rates than the nonparticipants. A naturalistic study enrolls ordinary patients from a routine clinical setting using wide inclusion criteria, for example, acceptance of coexisting illnesses and concomitant medications. Therefore, empirical statistical models derived from patients with AD included in such data sets may reflect more closely the effectiveness of ChEIs under the conditions of usual clinical care.
Extension studies of placebo-controlled trials have shown that the effect of ChEI may last up to 5 years, 25,26,28,46,50,52 and a few long-term AD studies in routine clinical settings have also described the benefits of ChEI on cognition 27,47,58 and function. 59 The absence of placebo groups in the above-mentioned studies made it necessary to evaluate the treatment responses by comparing them with the anticipated changes obtained from various historical cohorts of untreated patients with AD or by comparing them with mathematical models of the rate of deterioration. 60 Using more than 1 approach to estimate the outcome in untreated patients may contribute to a higher level of certainty in the comparison.
A shortcoming in the use of historical cohorts concerns the potential differences in the clinical characteristics of the treated and historical groups at baseline. Cohort effects, such as life conditions, the patients’ states of health, and different concomitantly used medications, might influence the outcomes. 61 Another concern is that untreated patients with AD in the placebo groups in recent trials have shown less decline over time than those in older trials. 62 Therefore, the use of previous cohorts and the empirical statistical models derived from them may overestimate the treatment effect by overestimating the drug–placebo difference. In contrast, using the changes in the placebo groups of randomized trials as if the placebo treatment had also been continued throughout the extension study could slightly underestimate the effects of therapy. This is because somewhat more deterioration might be expected in the later part of a longer trial (when the patients reach the moderate stage of AD) than in the first months in untreated patients with AD. 63
When modeling a follow-up study, patients in the very early stage of the disease, as well as those in the intermediate to late stages, should be included to ensure that the observed measures from all the participants collectively reflect the entire course of AD. The change in the performance score on a certain test is expected to be larger at the level of function, at which the test measures the patient’s abilities most accurately. The prediction models described in this review were based on the assessment scales that are often used in the mild to moderate stages of AD, such as ADAS-cog and MMSE. These test instruments are less sensitive in the detection of the individuals’ actual cognitive changes during the very mild stage (ceiling effect) or the late stage of dementia. The slower progression observed in patients at the severe end of the scale might partly depend on the inability of the existing scales to assess severely impaired individuals adequately (floor effect). 30 Cognitive scales exist that are particularly adapted for evaluating patients with moderate to severe AD, for example, SIB, which has been used in studies of ChEI treatment. 64,65 The selected test instrument can also affect the profile and the rate of deterioration. 13 Modifications and various combinations of well-known assessment scales 2,31 and prediction models that include measures of specific topics, such as sleep disturbances and aggressive behavior, 10 might complicate comparisons with other studies and limit the applicability of the reported models.
There might be a point during the longitudinal course of AD, termed a change point, at which the rate of deterioration changes. Each individual patient can be expected to change at a different point or have more than 1 change point. The Bayesian method has the advantage of not requiring all patients to have the same change point. Moreover, statistical models that analyze a change point can be extended by adding random effects to account for variability among the individuals with AD. 66,67 One study of healthy elderly persons who developed dementia reported that individual change points were not needed to model heterogeneity. 66 A Bayesian approach has been described to model the trajectory and determine an estimate of the change point in a data set of patients with AD. 67
Previous studies have suggested that 3 or more measurements per individual and an average follow-up period of at least 2 years are preferable when estimating regression slopes. 10,12 The size of the cohort is another important factor; more than 100 patients are required to ensure a reliable pattern of change. 17 Furthermore, some studies of the rate of decline in AD have reported that nonlinear empirical models fitted the data better than linear models. 68,69 Findings from univariate analyses should be extended to more advanced multivariate statistical models to identify confounding factors and to examine possible interaction effects among the predictors. 17
A large dropout rate among patients with AD is commonly reported in longer term studies, 25,28,58 which could cause the outcome to be overestimated if less impaired individuals are predominantly retained in the study–survivorship bias. In open-label extensions, a substantial dropout often occurs between the randomized clinical trial and the subsequent extension. Of the original trial participants, 55% to 76% have elected to continue ChEI treatment in the open-label phase. 26,52,53 A selection bias in favor of individuals who could tolerate ChEI or those with less cognitive decline has been described for patients with AD continuing an open-label extension study 53 and for those who completed a long-term naturalistic study. 22 Using the last observation carried forward approach to compensate for dropout in analyses that involve progressive disorder or when the missing data are nonrandom can exaggerate and bias the results. 70
Well-known inter- and intrapatient variability has led some authors 16,19 -22 to apply the linear mixed-effects models of Laird and Ware, 18 with a random intercept, which allows a varying baseline level of disease severity. 71 However, some of the above-mentioned articles did not report the unstandardized β coefficients of the significant predictors in the mixed-effects models 19 ,20 or included several neuropsychological tests as independent variables. 16 This means that it is not possible to use these models to calculate the estimated longitudinal outcomes in other patient cohorts. The advantages of the mixed-effects models are their ability to analyze the effects of covariates and possible interactions on the outcome over time. Moreover, to take into account the correlation within patients, differences in the participants’ number of follow-up assessments and variations in the actual time intervals between the data collection points should be considered. 72,73 Using less sophisticated analytical methods in longitudinal research may hinder the detection of important effects and can lead to inaccurate results and incorrect conclusions. 74
Recently and outside the time frame of this review, a β regression drug disease trial model based on ADAS-cog scores from both individual patients and summary-level data from literature references (on the whole representing 17 235 patients with AD) was published. The treatment effects of the ChEIs available currently, the longitudinal changes in cognitive severity, the dropout rate, the placebo effect, and the factors affecting these parameters were estimated in this complex prediction model; however, no single trial included all these variables. The factors time, APOE genotype, age, and sex were found to influence disease progression. 75
In conclusion, empirical statistical models and some other methods for predicting the longitudinal cognitive and functional outcomes for both untreated and ChEI-treated patients have been presented in this review, as a guide for clinical AD researchers. Investigators and clinicians must be aware of the strengths and limitations of the available analytical approaches in the interpretation of the data presented. Prediction models of ChEI-treated patients might be clinically valuable, for instance, when evaluating the efficacy of new AD therapies that are to be added to ChEI treatment.
However, patients are not homogeneous and may have different genetic, sociodemographic, or clinical characteristics, which can affect disease progression. It is challenging but important to develop more advanced empirical models of AD progression that allow the prediction of variations in the disease course and to determine the sources of these variations as completely as possible. Prediction models that reflect better an individual patient’s specific pattern of cognitive and functional decline are more useful for counseling clinicians and caregivers about the disease prognosis and for application in long-term studies that assess future treatments for AD. Therefore, further studies of the patient-specific patterns of decline and empirical statistical models derived from them are warranted.
Footnotes
Declaration of Conflicting Interests
The author declared the following potential conflicts of interest with respect to the research, authorship, and/or publication of this article: Dr Carina Wattmo has received speaker honoraria from Novartis.
Funding
The authors disclosed receipt of the following financial support for the research, authorship, and/or publication of this article: Dr Carina Wattmo received funding from Skåne County Council's Research and Development Foundation, Sweden.