
Abstract
Background/Rationale: To determine how many 85-year-old community-dwelling patients with good cognitive performance at baseline maintain this level at 2-year follow-up. Methods: We realized a longitudinal community-based study including 169 inhabitants. Patients who maintained scores >23 on the Spanish version of the Mini-Mental State Examination (MEC) were compared with the rest. Results: A total of 144 individuals (85.2%) were found maintaining a MEC score >23. Under the combined criteria 110 (65%) presented no new cognitive decline. Multiple logistic regression analysis showed that maintaining a MEC score >23 was significantly associated with having a higher MEC score at baseline (P < .001, odds ratio 1.280, 95% confidence interval 1.104-1.484). Conclusion: Most oldest-old patients with good cognitive function at baseline maintain this level at 2-year follow-up.
Introduction
The oldest-old patients comprise the fastest growing segment of the population. As the elderly population continues to grow, one of the most important health care issues they face is cognitive impairment and its implications, 1 since cognitive decline is associated with an increased risk of disability, dementia, and death.
There is clear evidence that the risk of cognitive impairment is greater in older adults. 2 Indeed, the average trajectory of cognitive status over the final decades of life is clearly downward, although there is a strong individual component. 3 Thus, although the oldest-old patients are a high-risk group for developing cognitive decline, many of them will not progress to dementia in the next 2 to 3 years or even beyond. 4 It is therefore important to understand better the factors associated with cognitive impairment in the oldest-old patients, especially in those who retain a good cognitive level.5-8 In this context, the identification of risk factors for cognitive decline should serve to start prevention.
The present study concerns a cohort of community-dwelling patients from a Mediterranean area who were aged 85 years at baseline. The aim was to assess how many of those who were classified as without cognitive impairment at baseline maintained a good cognitive status and were still living in the community after a follow-up period of 24 months. We also sought to identity the predictors of this persistently good cognitive status.
Participants and Methods
The Octabaix study is a prospective cohort study involving 328 community-dwelling inhabitants born in 1924 (85 years at the time of inclusion) and assigned to 7 primary care teams in the geographical area of Baix Llobregat, Barcelona, Spain. The sample has been described in more detail elsewhere.9,10 Briefly, each elderly inhabitant was interviewed by a geriatric-trained research team at his or her home or corresponding health center. The interview included a geriatric assessment and the gathering of sociodemographic data (gender, marital status, place of residence, education, and living status, ie, alone or accompanied). The institutional ethics committee approved the study. All patients, or their caregivers in the case of cognitively impaired patients, gave written informed consent before enrolment. All participants were assessed without any exclusion criteria based on health or cognitive status. Functional, cognitive, and nutritional status as well as social risk and quality of life were assessed by instruments currently used in geriatric practice.
The Mini-Mental State Examination (MMSE) has become the most widely used screening test for cognitive impairment. The version of MMSE that has been adapted and validated for use in Spain is known as the MEC 11 and it takes particular account of the very low educational level of the elderly Spanish population. The MEC assesses orientation, memory, concentration, language, and praxis, and it provides a score of up to 35 (a score of 23 or below indicates cognitive impairment). When MEC was used to assess cognitive status in the present study, one criterion was that when a question was not asked or was not applicable due to sensory or physical impairment the item was scored as zero and was included in the final score calculation. Functional status was measured using the Barthel Index (BI) 12 for basic activities of daily living (ADLs). The total score of the BI ranges from 0 to 100 points (from help needed to independent in all activities). Nutritional status was assessed using the Mini Nutritional Assessment (MNA). 13 The MNA score is based on 18 items covering 4 component subscores. The score obtained (maximum 30) enables respondents to be classified into 3 categories, 24 to 30, well nourished; 17 to 23.5, at risk of malnutrition; and <17, malnourished. Elderly patients and/or caregivers were also asked about any falls in the last year, with a fall being defined as any incident in which the elderly person ends up on the ground or at a lower level against his or her will (and not due to an intentional movement). 14 Social assessment was based on the Gijon scale 15 that has a maximum score of 24; scores between 10 and 14 are considered to be indicative of social risk, while those >15 indicate social problems. Quality of life was assessed using the EuroQol-5D in conjunction with a visual analogue scale (EQ-VAS) of perceived health, thereby yielding a score between 0 and 100 (where 0 was the worst state of health that could be imagined and 100 the best). 16
Overall comorbidity was measured by means of the Charlson score 17 that ranges from 0 to a theoretical maximum of 33, depending on the presence of certain diseases with assigned values. Data regarding a number of cardiovascular risk factors (hypertension, diabetes mellitus, and dyslipidemia) were also collected, as was the prevalence of ischemic cardiomyopathy, heart failure, stroke, and atrial fibrillation. Anemia was defined as hemoglobin level less than 13 g/dL in men and less than 12 g/dL in women, in accordance with World Health Organization criteria. 18 Chronic drug prescription was also recorded.
Laboratory Analyses
Laboratory parameters that have been correlated with cognitive status were assessed. In order to measure 25-hydroxy vitamin D (25(OH)D) levels during the first trimester of 2009, a morning blood sample was obtained from each patient. The detection limit of serum 25(OH)D was 5 nmol/L, the intraassay coefficient of variation was 5.6%, and the interassay coefficient was 9.2%. Serum levels of 25(OH)D (Radioimmunoanalyses, DiaSorin, Minnesota) were considered normal between 25 and 95 ng/mL. Total cholesterol was measured by an enzymatic colorimetric method, using a modular system analyzer (CHOD-PAP, Roche Diagnostics, Basel, Switzerland).The reference range was 120 to 200 mg/dL. Thyrotropin was analyzed by electrochemiluminescence immunoassay based on the sandwich principle with monoclonal antibodies (Roche Diagnostics). The reference range was 0.25 to 5 mU/L. Vitamin B12 (usual range 145-637 pmol/L) and folic acid (usual range 5.7-32.0 nmol/L) were analyzed by means of competitive chemoluminescent immunoanalysis (Modular E4 Roche Diagnostics, Mannheim, Germany).
Procedure: 2-Year Follow-Up
Patients without cognitive decline at baseline were defined as those with MEC scores of 24 or higher. Application of this criterion meant that 239 (73%) of the 328 participants had a correct cognitive status at baseline. 9 At 2-year follow-up new data were available regarding the cognitive status of 169 (71%) of these 239 individuals. There were no differences at baseline as regards the gender or BI score of participants and nonparticipants in the follow-up (ie, those who died were newly institutionalized or refused to take part). For the present study, we first compared those patients who maintained a good cognitive status (scores of 24 or higher on the MEC) with the rest. We then performed a second evaluation in which patients with a MEC score below 24 were grouped with those who scored 24 or above but who had lost more than 4 points over the last 2 years; this combined group was compared to the rest.
Data Analysis
Normally distributed continuous variables are reported as mean ± standard deviation. Categorical variables are reported as proportions. Normal or nonnormal distributions of continuous variables were assessed using the Kolmogorov-Smirnov test. The Student t test was used to compare continuous variables, with a previous Levene test for equality of variances, while either the chi-square statistic or Fisher exact test was used for the comparison of categorical or dichotomous variables. A logistic regression analysis was performed to determine the variables associated with cognitive decline. For the 2 regression analyses we use the same model in which, in addition to gender, we included all those variables that had been significant, albeit in only one, of the bivariate analyses (level of education, BI, MEC, MNA, number of falls, previous diagnosis of diabetes, and number of chronic drug prescriptions). An adjusted odds ratio (OR) with a 95% confidence interval (CI) was used. The results were considered significant when P < .05. All analyses were performed using SPSS 15.0 statistical software (SPSS Inc, Chicago, Illinois).
Results
The final sample comprised 169 patients aged 87 at the time of follow-up assessment. There were 105 (62.1%) women and 64 men. At baseline, 54 (32%) patients lived alone. With respect to marital status 78 (46.2%) were married, 82 (48.5%) were widowed, and 9 (5.3%) were unmarried. In all, 39 (23.1%) had a university degree or had completed secondary education, while the remaining 130 (76.9%) had only primary studies or no schooling at all.
Geriatric Assessment
The mean scores for the geriatric assessment at baseline were as follows: MEC 30.3 ± 3 (cognitive status); BI 92.9 ± 13 (basic ADL); MNA 25.7 ± 3 (nutritional status); Gijonscale 9.2 ± 2.4 (social risk); and EuroQol-5D/EQ-VAS 65.1 ± 3 (quality of life).
Comorbidity Assessment
The mean Charlson score was 1.09 ± 1.2. As regards the assessment of major cardiovascular risk, hypertension was found in 131 (77.5%) patients, diabetes in 26 (15.4%), and dyslipidemia in 87 (51.5%). Nine (5.3%) patients had a previous clinical history of ischemic cardiomyopathy, 17 (10.1%) of heart failure, 16 (9.5%) of atrial fibrillation, 24 (14.2%) of anemia, and 22 (13%) of stroke. The patients were taking an average of 5.6 ± 3 chronic drugs, with 126 (74.5%) of them being on treatment with 3 or more drugs. The mean number of falls during the previous year was 0.43 ± 1 falls per patient.
Laboratory Results
The mean level of serum 25(OH)D at baseline was 25.8 ± 13 ng/mL, while total cholesterol was 195.9 ± 35 mg/dL and thyrotropin was 2.7 ± 3 mU/L. The mean values for vitamin B12 and folic acid were 330 ± 199 pmol/L and 22.7 ± 9 nmol/L, respectively.
Cognitive Status at 2-Year Follow-Up
The mean MEC score at the end of the follow-up period was 28.7 ± 5.2, with 144 (85.2%) individuals continuing to score higher than 23. The MEC score fell by a mean of 1.6 points over the 2-year period. Under the combined criteria, 110 (65%) individuals showed no cognitive decline.
Table 1 shows differences in baseline characteristics between the group without cognitive impairment at follow-up (MEC score of 24 or higher) and the rest. The group with new cognitive decline was characterized by having poorer MEC scores at baseline, lower scores on the BI and MNA, a higher number of falls during the previous year, and more chronic drug prescriptions.
Differences in Baseline Characteristics Between the Group With No Cognitive Impairment at Follow-Up and the Group Which Showed Cognitive Decline (MEC Score Lower Than 24).
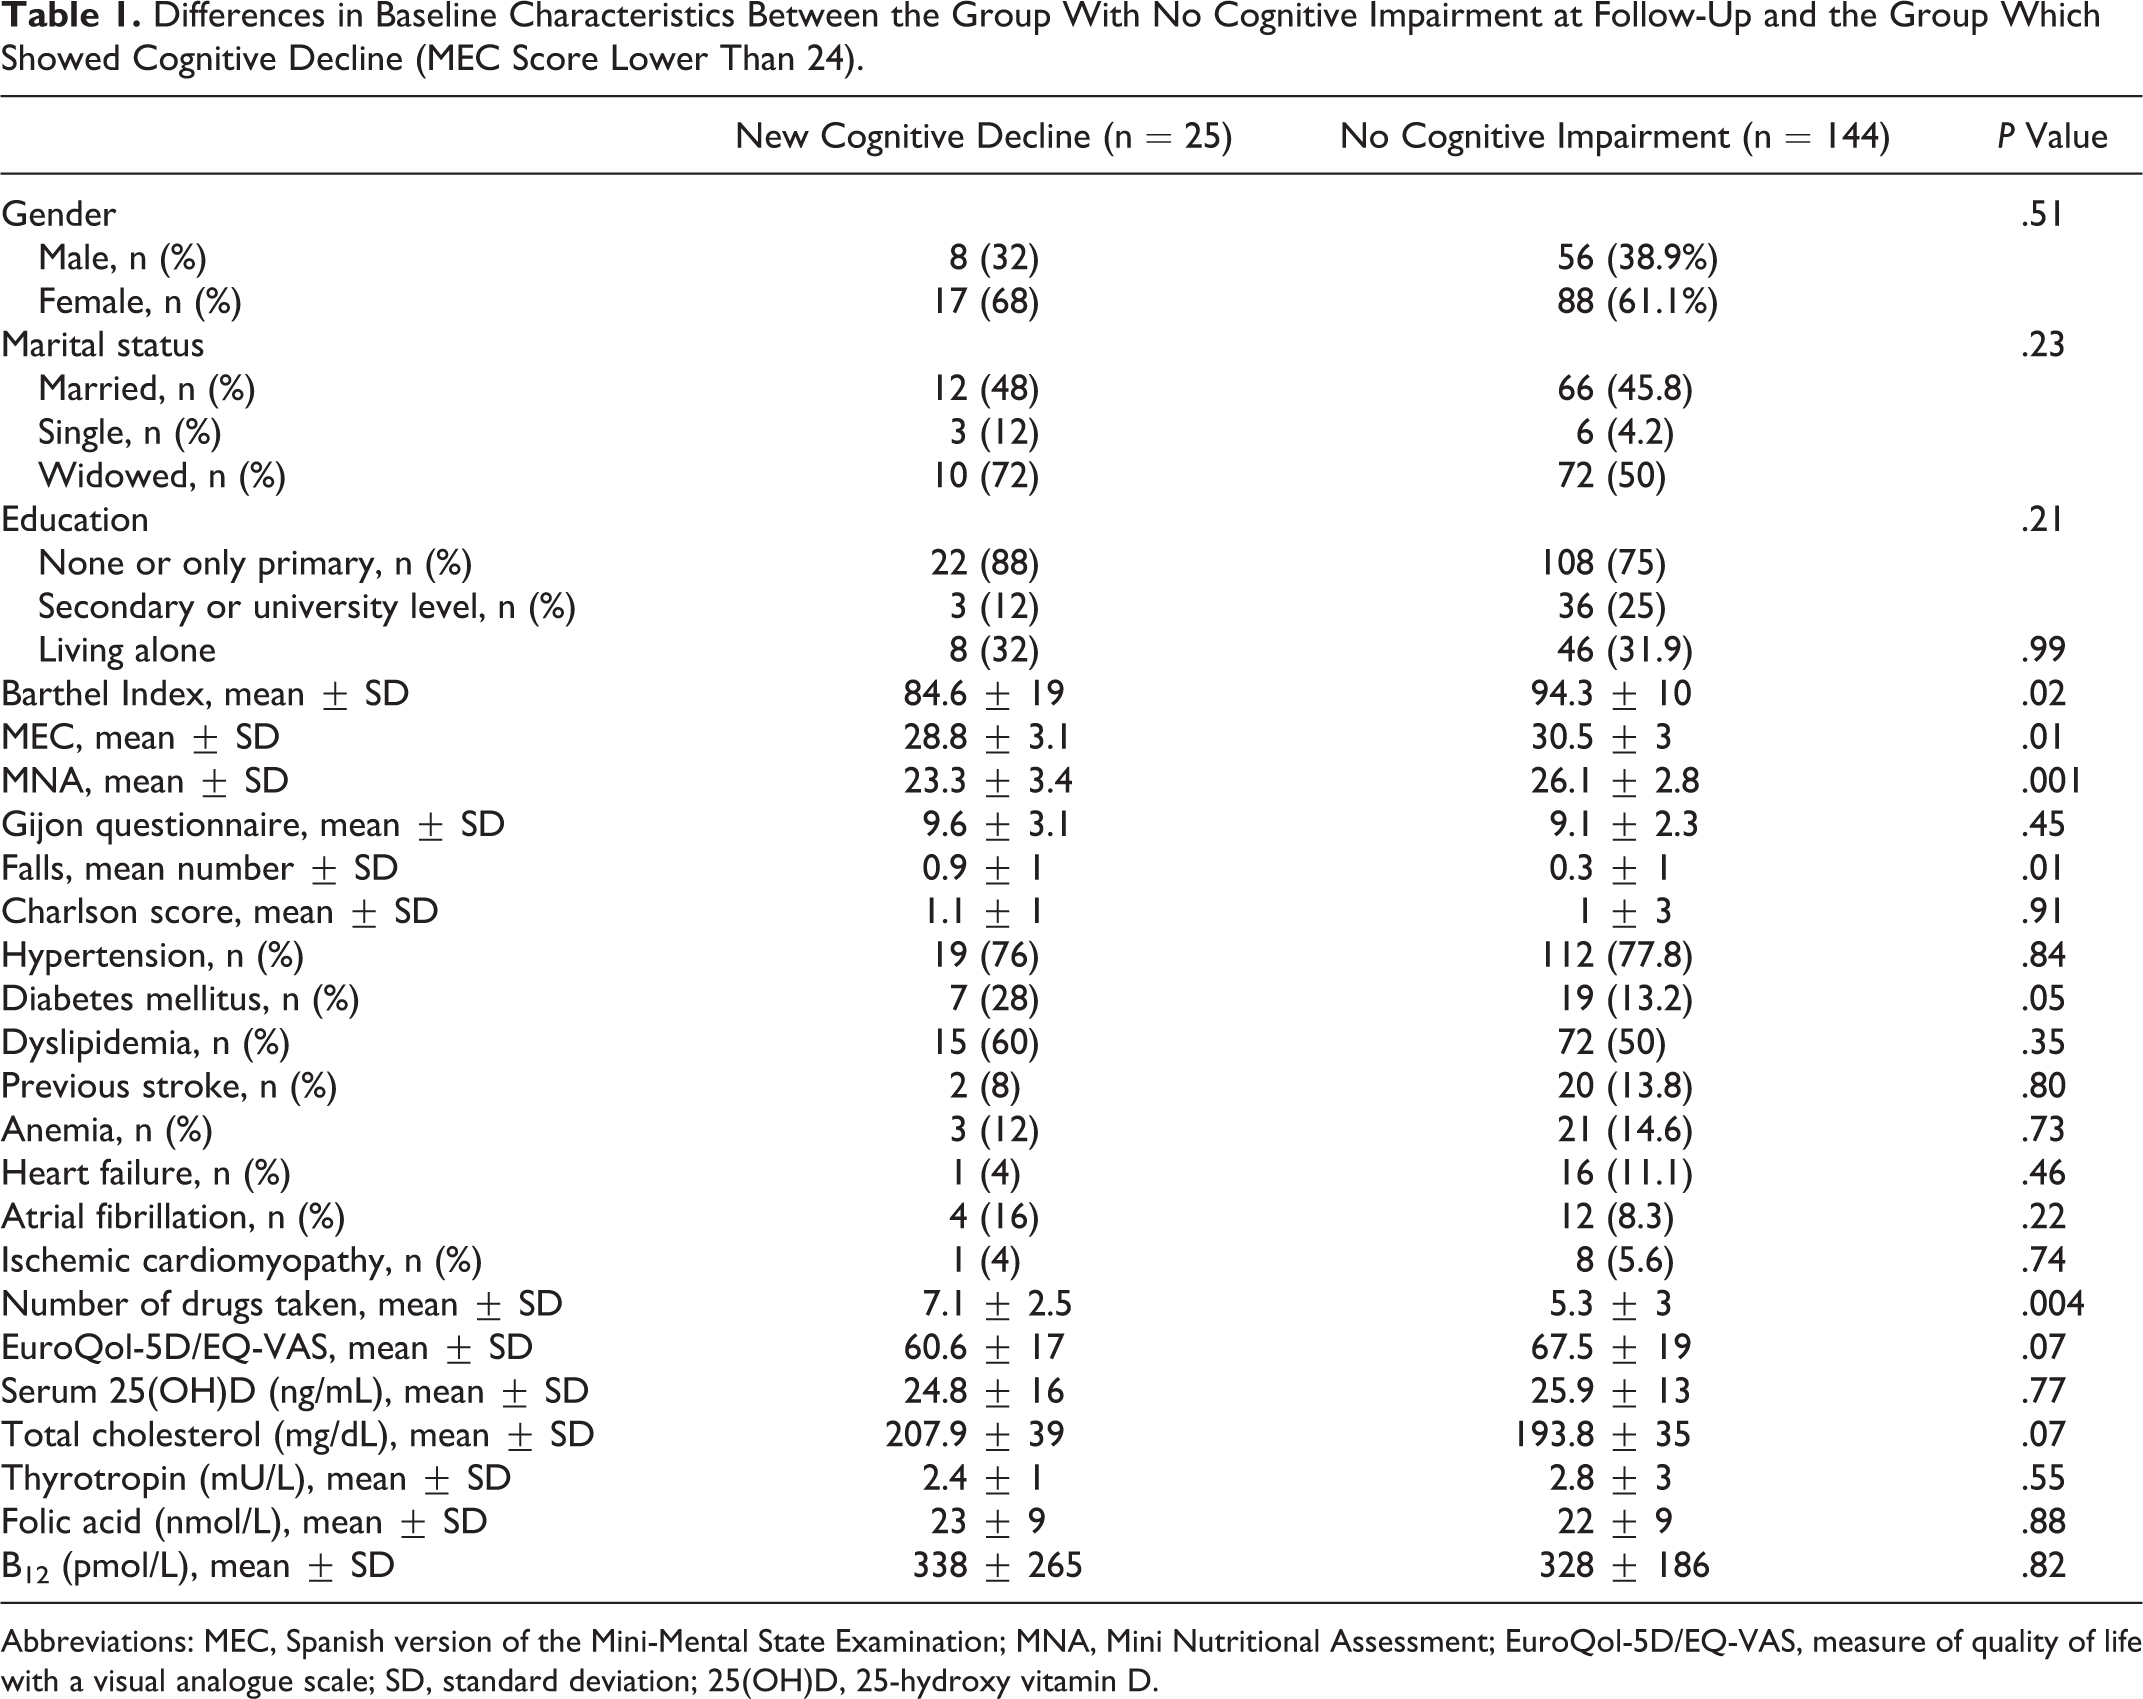
Abbreviations: MEC, Spanish version of the Mini-Mental State Examination; MNA, Mini Nutritional Assessment; EuroQol-5D/EQ-VAS, measure of quality of life with a visual analogue scale; SD, standard deviation; 25(OH)D, 25-hydroxy vitamin D.
Multiple logistic regression analysis showed that maintaining a MEC score above 23 was significantly associated with having a higher MEC score at baseline (P < .001, OR 1.280, 95% CI 1.104-1.484).
Table 2 shows the differences in baseline characteristics between the combined criteria group (MEC score lower than 24 at follow-up or a drop of more than 4 points over the follow-up period) and the rest. The group with cognitive decline was characterized as having a lower educational level, poor baseline scores on both the MEC and the BI, a higher number of falls during the previous year, and a greater likelihood of a previous diagnosis of diabetes.
Differences in Baseline Characteristics Between the Combined Criteria Group (MEC <24 or a Drop of More Than 4 Points in MEC Score Over the Follow-Up Period) and the Group With No Cognitive Impairment at Follow-Up.
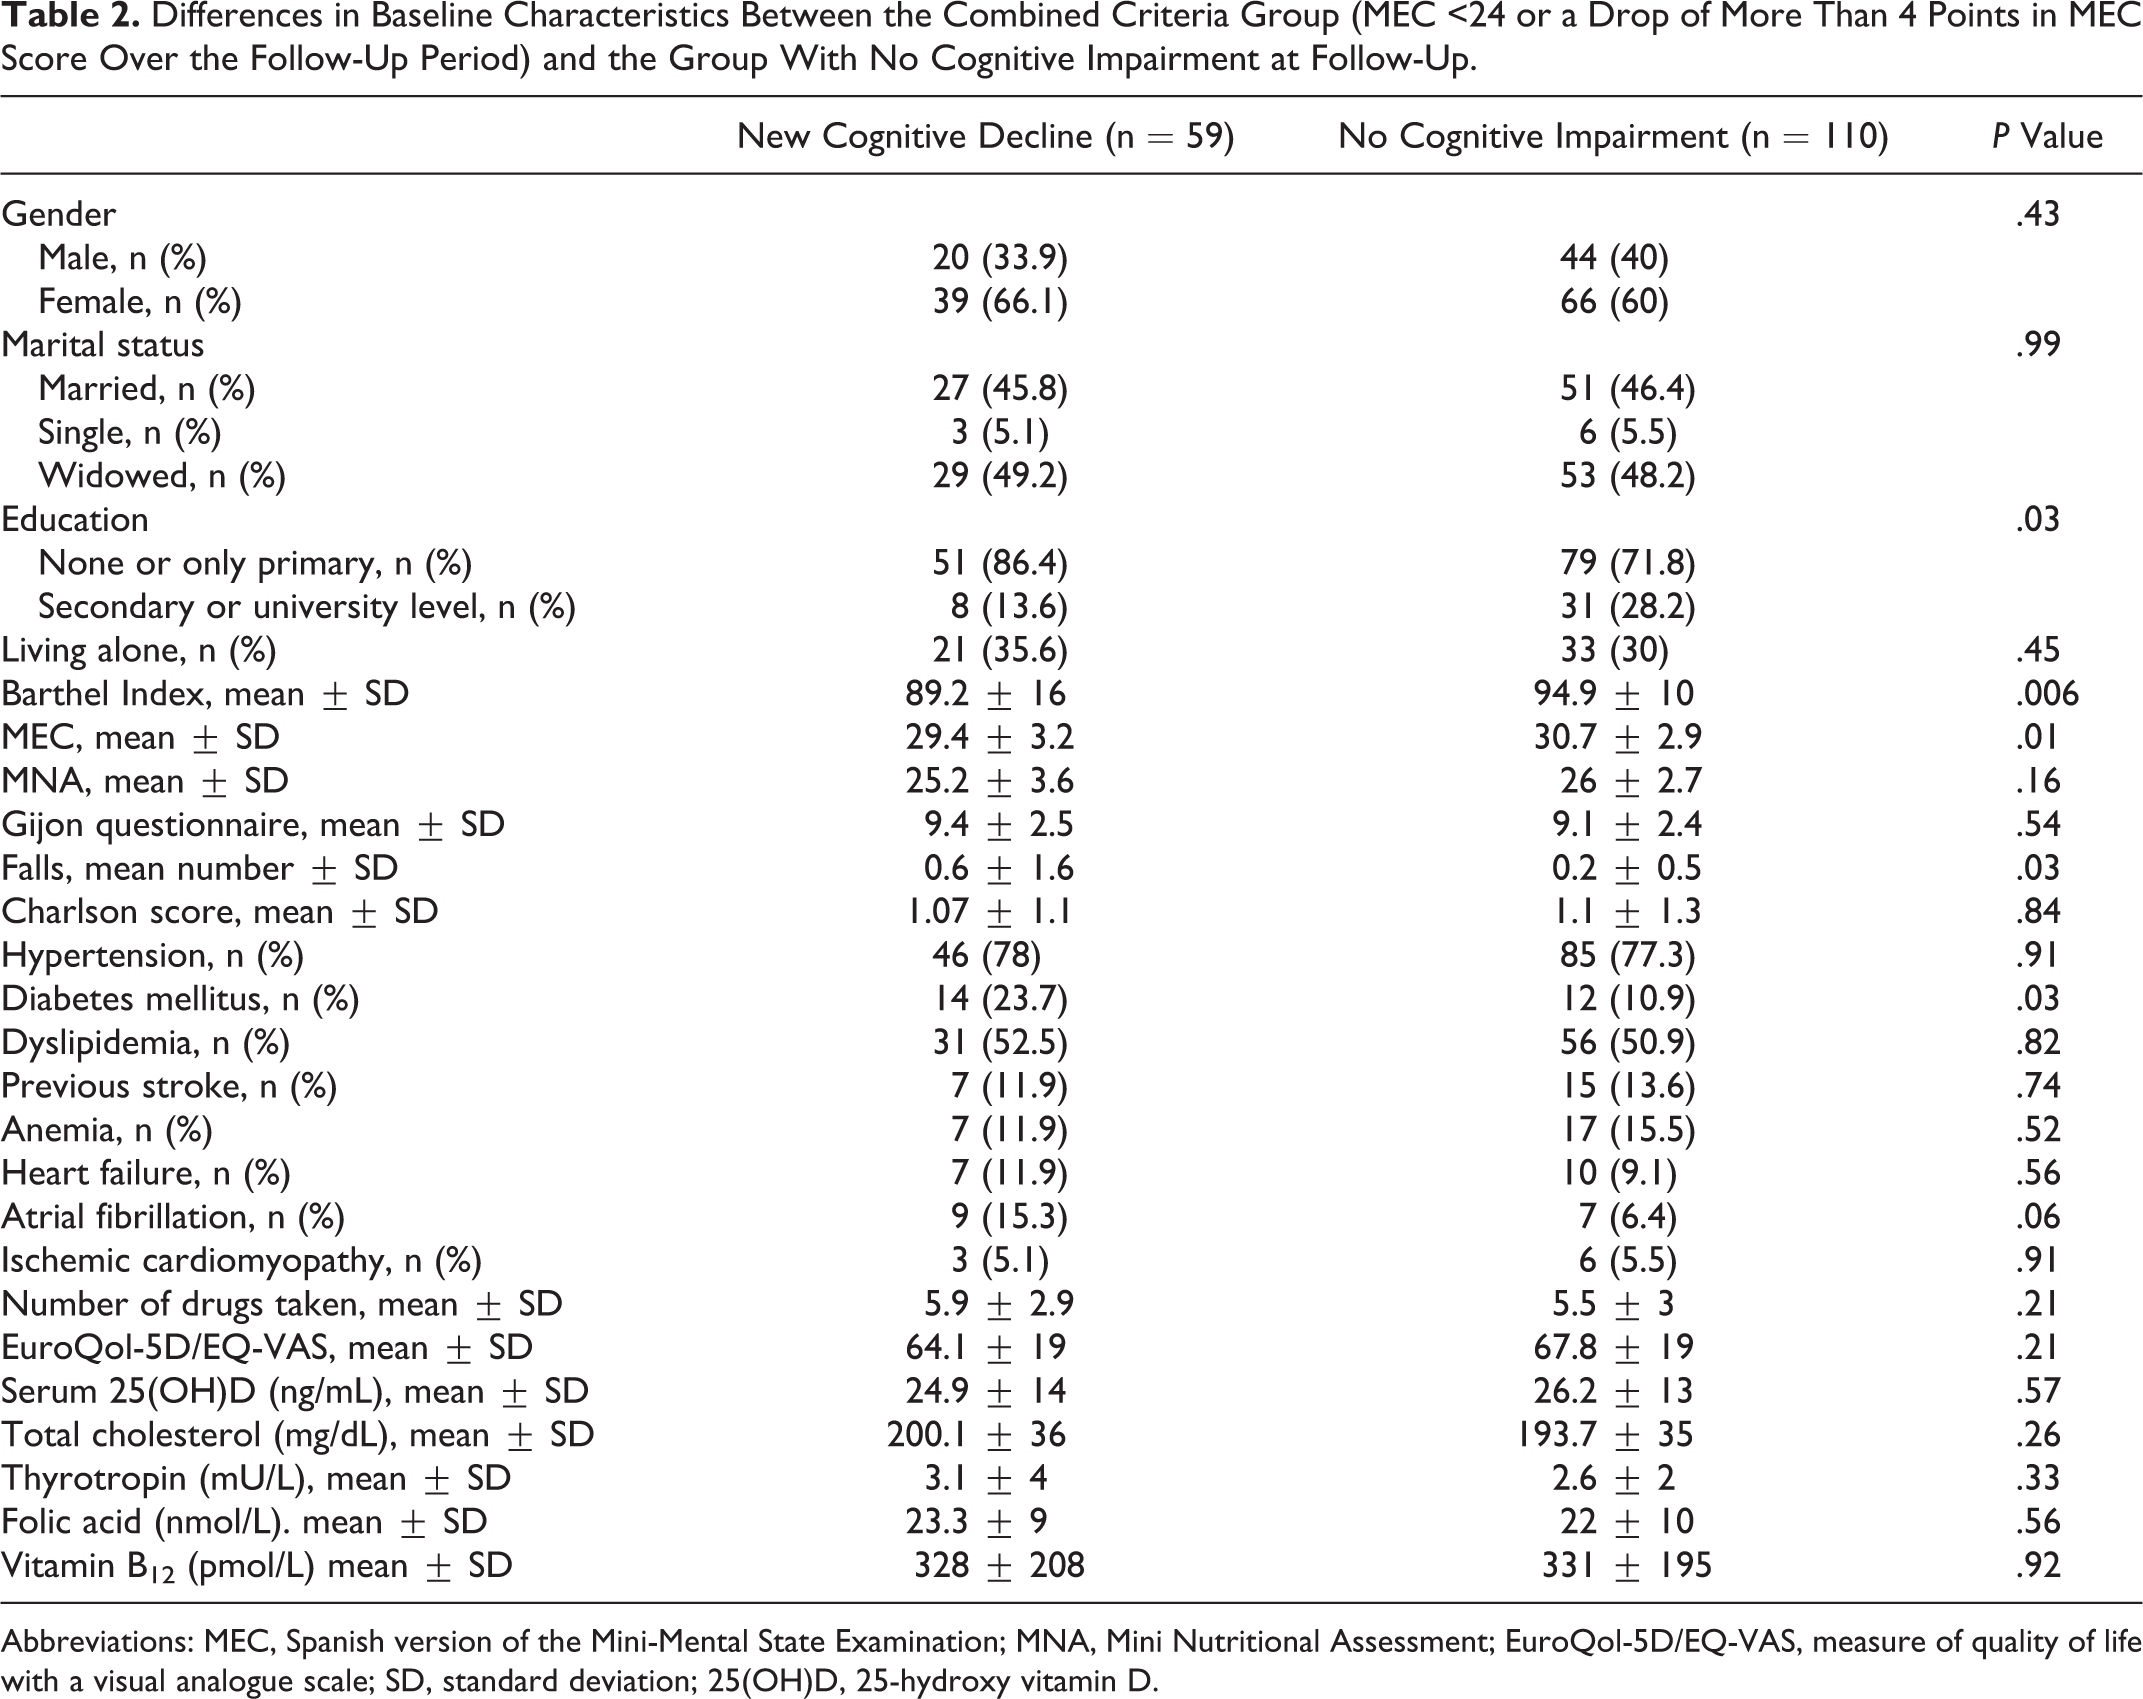
Abbreviations: MEC, Spanish version of the Mini-Mental State Examination; MNA, Mini Nutritional Assessment; EuroQol-5D/EQ-VAS, measure of quality of life with a visual analogue scale; SD, standard deviation; 25(OH)D, 25-hydroxy vitamin D.
Multiple logistic regression analysis showed that maintaining a MEC score above 23 and not experiencing a drop of more than 4 points over the follow-up period were significantly associated with higher scores on the BI (P < .009, OR 1.036, 95% CI 1.009-1.064) and with not having a previous diagnosis of diabetes (P < .02, OR 2.70, 95% CI 1.146-6.387).
Discussion
The results of this longitudinal study in a sample of community-dwelling Mediterranean oldest-old patients show that the majority (85.2%) of the patients who had a good cognitive status at baseline (MEC score >23) maintained this status at 2-year follow-up. Furthermore, when applying the broader criteria of a MEC score above 23 and no drop in MEC score of more than 4 points over the follow-up period, more than half (65%) of the sample continued to show no new cognitive decline of any significance. The reason for analyzing patients who maintained a good MEC score but who experienced a significant drop in status (more than 4 points over 2 years) was that the quantification of such changes can be useful to detect people who will develop real cognitive problems. 19 With respect to the instruments used to detect cognitive impairment, it is important to note that age in itself has not been shown to be a major limitation when using the MMSE, and the questionnaire is widely used to screen cognitive status in very elderly people. 20 As regards the follow-up period, although it is relatively short an assessment of the determinants of 2-year decline in very old individuals with high rates of morbidity and mortality is nevertheless of relevant interest.
It should be noted that in the multivariate analysis the factors associated with new cognitive decline were worse baseline scores on the MEC and the BI (basic ADL) as well as a previous diagnosis of diabetes (for the combined end point).
With respect to the MEC, and even considering the possibility of large individual heterogeneity, one would expect that those with higher scores on the baseline screening test would, in the context of a relatively similar drop in score, take longer to reach the risk threshold.8,21 The present results confirm this finding even in the oldest-old patients, although it is acknowledged that their cognitive status in earlier life was not known. Some of the domains of the MMSE have proven to be more effective in detecting losses. Specifically, poor performance on the MMSE orientation for time domain is associated with a faster rate of decline in total MMSE scores over time, while good performance on the delayed recall domain, in addition to good performance on another domain, is associated with a slower rate of decline. 22
There is increasing evidence regarding the positive effect of physical activity in terms of maintaining cognitive function, 23 and the 2 processes seem to be intrinsically linked to one another. Thus, with respect to ADLs, functional disability can be due to physical impairment, cognitive impairment, or both. 24 Although the average BI score is high in both our study groups, the results nonetheless support the notion that patients with a better physical status experienced less cognitive decline.
Compelling evidence from cross-sectional and longitudinal studies supports the view that individuals with diabetes are at increased risk of developing cognitive impairment.2,25–27 Although several explanations have been proposed the precise mechanism is yet to be elucidated. Among patients in the Leiden study, who were also aged 85, diabetes was associated with a lower level of cognitive functioning but was not associated with accelerated cognitive decline during follow-up. 27 Our results confirm that the diagnosis of diabetes is associated with cognitive decline.
The role of other cardiovascular risk factors in the pathogenesis of cognitive impairment and dementia remains unclear. 25 In relation to dementia, having hypertension 7 or elevated cholesterol levels is probably more important if these conditions appear in middle rather than old age. The design of our study does not, however, allow this aspect to be evaluated.
It is widely recognized that the possible presence of low levels of vitamin B12, folic acid, and thyrotropin should be considered when conducting any assessment of cognitive impairment. Two longitudinal substudies conducted with the Leiden cohort have failed to find significant cognitive effects of subclinical hypothyroidism, 28 vitamin B12, and folic acid, 6 the reported rate of cognitive decline being similar to that found here. Low levels of vitamin D have been associated with cognitive decline in the elderly population. 29 However, studies report both the existence and the absence of a correlation between vitamin D and MMSE scores, although overall it appears that cognitive function, as assessed by the MMSE, is not associated with vitamin D levels.30,31 In the present study, mean levels of vitamin D were not useful for detecting cognitive impairment.
We observed several associations in the bivariate analysis that lost their significance in the multivariate analysis. Specifically, worse scores on the malnutrition risk scale (MNA), a higher number of falls during the previous year, a higher number of chronic drug prescriptions, and a lower educational level were all associated with new cognitive decline in the bivariate analysis. The question of educational level merits further comment. Although there is consensus that more educated individuals achieve higher levels of cognitive performance, the results from a considerable body of research on the effect of education have been inconsistent. In this regard, a recent study of people aged 75 or above found that education was not related to the rate of cognitive decline or a change in this rate, as measured by the MMSE. 32
A recurring theme when assessing cognitive status is the possible existence of gender differences. In our octogenarians, there were no gender differences among those who showed a new loss in cognitive function. Although dementia is more prevalent among women, presumably due to greater longevity, a study of older patients (aged 90-108 years) found that the risk of developing dementia was similar for both the sexes, 33 although it should be noted that some authors have suggested an increased risk for women (old Chinese women). 34
The strength of the present longitudinal study is not only that it is based on a community-dwelling sample of individuals who were of the same age, but also that it provides a representative range of the socioeconomic characteristics of older residents in our area, all of whom were carefully assessed using a number of measures. We acknowledge, however, that this strength might also constitute a weakness by limiting the generalizability of the health survey findings to other populations. The study has several other limitations. First, although the original sample size was reasonable, the subgroup with MEC scores below 24 was small. Furthermore, the possible presence of depression was not assessed. Depression and cognitive impairment often occur together in old age, although an interesting study in a similar age group reported that depressive symptoms at baseline were not correlated with accelerated cognitive decline. 35 Another limitation of our study is that a subanalysis of MEC items was not performed to detect possible differences according to the areas of cognitive function (eg, orientation, attention, calculation). Neither was the apolipoprotein E genotype assessed. Finally, dementia was not formally assessed with a more detailed test battery.
In conclusion, in this sample of community-dwelling oldest octogenarians lower cognitive and functional test scores at baseline and a previous diagnosis of diabetes were associated with cognitive decline at 2-year follow-up.
Footnotes
Authors’ Note
Members of the Octabaix Study: J. Almeda (Unitat de Suport a la Recerca de Costa de Ponent, IDIAP J Gol), T. Badia (ABS Martorell Urbano), A. Lobato (ABS Sant Andreu de la Barca), C. Fernández (CAP Rambla), A. Ferrer (CAP El Pla), F. Formiga (UFISS de Geriatría, Servicio de Medicina Interna, Hospital Universitari de Bellvitge), A. Gil (ABS Sant Andreu de la Barca), M.J. Megido (ABS Just Oliveras), G. Padrós (Laboratori Clínic L’Hospitalet-Cornellà), M. Sarró (CAP Florida Nord), and A. Tobella (ABS Martorell Rural).
Declaration of Conflicting Interests
The authors declared no potential conflicts of interest with respect to the research, authorship, and/or publication of this article.
Funding
The authors received no financial support for the research, authorship, and/or publication of this article.