
Abstract
Background:
This article describes the testing of a new nursing home food delivery system that empowers elders to choose the foods they want to eat and gives them an active voice in menu development.
Methods:
Using a 2-group, repeated measures design, 61 elderly residents from 2 eastern Washington nursing homes were recruited to participate in a 6-month study. Outcome measures included food and meal service satisfaction, body weight, serum prealbumin, and food intake.
Results:
Serum prealbumin levels and body weight increased post intervention for treatment group residents. Mini-Mental Status Examination (MMSE) scores were not associated with the changes in serum prealbumin, body weight, or food intake.
Discussion:
The MMSE scores did not influence the resident’s ability to actively participate in the rate the food process or choose the foods they liked and preferred to eat. Cognitive impaired older adults experienced weight gain similarly to higher functioning elderly individuals.
Introduction
Prevention of involuntary weight loss and low body weight is important because they are predictors of morbidity, mortality, 1 and poor quality of life in the elderly persons. 2 The origins of weight loss in elderly persons have yet to be definitively established but undoubtedly a decline in food intake is a critical factor. 3
Several long-term care studies have shown that residents with cognitive impairment or probable Alzheimer’s disease (AD) are more prone to weight loss and malnutrition than healthy elderly individuals. 4 Because up to 80% of nursing home residents are cognitively impaired or have a diagnosis of AD, mental status should be considered when examining the effects of interventions aimed at maintaining or increasing food intake, reducing weight loss, and increasing food satisfaction. 5 The purpose of this article is to describe the impact of mental status on the utility of the Eat Right (EatR) food delivery system and subsequently on residents’ food satisfaction, food intake, and nutritional status.
Although there are many reasons for a decline in food intake, food choice and satisfaction have not been studied adequately in controlled empirical investigations. Unlike those in acute care, nursing home residents are seldom given a choice of food at mealtime, although State and Federal regulators require that an alternate food item be available. Facility or corporate dietitians develop menus, providing little opportunity for resident input. In a preliminary qualitative study, nursing home residents (N = 20) reported that they wanted to choose the foods they ate and wanted a voice in menu development. 6 The EatR food delivery system described in this article addresses these concerns.
Eat Right is a multilevel, 2-component delivery system. Component 1 is designed to systematically change and update menus to include foods residents like to eat; while component 2 supports resident food choice using a select menu and a buffet-style dining program in the dining room. Cognitively impaired residents can make simple choices and are likely to choose and eat foods they are familiar with or that they like, leading to improved food intake. 7 Although many nursing homes have tried practical approaches to meal service (meal carts, spoken menus, and “fresh” menus), none have tested these approaches in controlled empirical investigations. Most importantly, none have tested the feasibility of a select menu or buffet-style dining program with cognitively impaired elderly individuals. 8
Methods
Setting and Design
Using a 2-group, repeated-measures design, 2 eastern Washington nursing homes were recruited to participate in a 6-month study to test the effects of the EatR food delivery system. Nursing homes were chosen based on similar case mix, number of beds, number of personnel, and management’s willingness to participate in the study. Nursing home A was chosen as the intervention site using a random process (flipped a coin). Nursing home B acted as a comparison site.
At baseline, nursing home A utilized an institutionalized model of meal service. Specifically, meal trays were filled in the kitchen and then delivered to the dining room or resident room via a covered cart.
Unbeknown to the principal investigator (PI), and prior to the beginning of the study, the comparison site, nursing home B, began serving food from a steam table in their dining room. They continued an institutionalized model of meal service utilizing trays filled in the kitchen and then delivered to the resident’s room via a covered cart. Rather than search for another comparable nursing home, it was determined that the intervention was the Rate the Food 9 process itself and resulting food choice, not simply the use of a steam table in the dining room.
Participants
All residents that met inclusion and exclusion criteria were invited to participate in the study. Inclusion criteria are
age 65 years or older;
Mini-Mental State Examination (MMSE) score >11;
residents that consume all meals in the dining room; and
residents that feed themselves or require minimal cueing to eat.
Exclusion criteria are
residents “actively” dying—receiving palliative/hospice care;
residents on a planned weight reduction diet (rare);
short-stay residents (expected stay <6-9 months);
residents receiving tube feedings as their primary source of nourishment; or
high nutrition risk, very low functioning residents (MMSE <11 that must be fed by staff) will be excluded to control for confounding causes of low food intake and poor nutrition status.
A total of 61 residents (nursing home A = 33, nursing home B = 28) were recruited to participate in this study. Of those, 51 (82%) were female (nursing home A = 30, nursing home B = 21). Residents from nursing home A were 84.7 ± 9.6 years of age, similar to residents from nursing home B (85.6 ± 7.6 years of age). Each group had similar MMSE scores (nursing home A = 21 ± 5, range 12-30; nursing home B = 20 ± 5, range 12-30). Specifically, 34.4% of participants (21 of 61) had an MMSE score of
A power analysis completed based on an N of 60 with an α of .05 and a 2-tailed test determined that we would have a greater than 80% chance to detect a small-to-medium effect size (f) of .30 for both main effects and the group by time interaction. The Washington State University institutional review board approved the study procedures.
Eat Right Food Delivery System
Eat Right is a multilevel, 2-component delivery system. Component 1 is designed to systematically change and update menus to include foods residents like to eat, while component 2 supports resident food choice using a select menu and a buffet-style dining program in the dining room.
Component 1:
“Rate the Food” and update facility menus
Step 1. Administer Rate the Food pictorial tool (treatment and comparison sites).
A research associate helped participants to mark the “face” that most closely matches their own opinion of each food item (main entree, vegetable, starch, and dessert). Breakfast items—week 1, lunch items—week 2, and dinner items—week 3. To fully refine menu selections for treatment group participants, food items will be rated again at midpoint and post intervention (choosing weeks/menu items not previously rated).
Step 2. Update nursing home menu (treatment site only)
Menu items with a median score of 3.5 or higher remain on the menu.
Deleted items are replaced with favorite items gathered from resident council (resident council is comprised of elected residents that meet monthly to discuss issues specific to facility life and resident concerns.) and study participants.
Component 2:
menu selection process and steam table usage (treatment site only)
Step 3. Menu selection process
A research associate coordinated printing of nursing home menus.
Resident made food choice by marking menu (prior day).
A research associate gave food selections to dietary staff (so can prepare correct amount of food).
Step 4. Steam table usage
Steam table was placed immediately inside the dining room.
Residents were brought by filled steam table to view food (by staff).
Staff asked the residents whether their prior choice had changed.
Step 5. Meal service
Dietary staff served the food from the steam table (food serving is moved from kitchen to dining room. By regulation, only dietary staff can serve food).
Staff delivered individual plates to tables (delivered to resident room during periods of illness).
Dessert was offered via a traveling cart after the main meal.
Measurements
Study measures included baseline cognitive function using the MMSE. Meal service satisfaction using the FoodEx-LTC and food intake, body weight, and serum prealbumin were measured at baseline and following the intervention period. Research assistants (RAs) were student workers hired specifically for data gathering tasks; none were involved in the specific steps within the intervention (ie, rate the food or menu selection processes).
The MMSE, a valid and reliable 11-item measure is the gold standard for measuring 5 areas of cognitive function in diverse populations. 10 The MMSE scores were recoded into 3 categories for purposes of analysis. Scores of 12 to 18 indicate moderate impairment, 19 to 23 indicate mild impairment, and 24 to 30 indicate normal cognition. Multiple studies reveal that residents with mild-moderate cognitive impairment remain capable of reporting satisfaction and preferences in care. 11 The PI administered the MMSE after obtaining informed consent. Residents that scored >11 were enrolled in the study.
The FoodEx-LTC is a research-based, 28-item, 4-domain instrument developed and pilot tested by the PI (and others) to measure resident satisfaction with food and meal service. 12 –14 The instrument was originally developed for and pilot tested with institutionalized older adults with an MMSE >11. The 4 domains include enjoying food and food service (8 items); exercising choice (6 items); cooking good food (5 items); and providing food service (9 items). Responses are scored on a 4-point Likert-type scale (1 = true, 2 = somewhat true, 3 = somewhat false, and 4 = false). During development and pilot testing, 14 internal consistency reliability (Cronbach α) estimates ranged from .65 “exercising choice” to .82 “providing food service.” All α coefficients were above the .50 criterion suggested by Nunnally and Bernstein 15 for a new scale and 3 of 4 scales met the more stringent criterion of .70. Two-week test–retest coefficients ranged from .79 “enjoying food and food service” to .88 “providing food service” and “exercising choice.” None fell below .70.
An RA administered and scored the FoodEx-LTC at baseline and post intervention. Accuracy of administration was assured by a second RA independently administering the instrument to 10% of participating residents at baseline and post intervention. A 99% comparable rate was viewed as acceptable. Disparities resulted in retraining of the RA by the PI.
Food intake was determined using a validated plate waste protocol. This accurate procedure uses a gram food scale to weigh and compare weights of original food servings to weights of the same foods left “on the plate” after meals. 16 Plate waste was assessed at baseline, midpoint, and post intervention (a 3-week process—1 week each for breakfast, lunch, and dinner). Research assistants weighed filled food plates as they were served (by dietary staff) and then reweighed the plates after residents finished eating. Accuracy of weights was assured by the PI independently weighing 10% of plates (before and after resident consumed a lunch meal) on day 1 of the food wastage procedure at baseline, midpoint and post intervention; a 99% comparable rate was viewed as acceptable. Disparities resulted in retraining of the RA by the PI.
Body weight was measured using a calibrated scale. The RAs weighed each participant at the same time of day, at baseline, monthly, and then post intervention, wearing approximately the same amount of clothing each time. Accuracy of weights was assured by a second RA independently weighing 10% of participating resident (same time of day/same procedure) every 3 months; a 99% comparable rate was viewed as acceptable. Disparities resulted in retraining of the RA by the PI.
A local laboratory company collected, transported, and then analyzed the blood samples from participating elderly individuals to determine prealbumin levels at baseline and post intervention. Serum prealbumin is an indicator of poor nutrition status and changes rapidly because of its short half-life (2-3 days). 17 Normal values for prealbumin are 16 to 35 mg/dL.
Statistical tests of main effects and interactions for each outcome variable were completed using generalized estimating equations using the hierarchy of person–time. The complete model equations included factors for time, facility, sex, age, mental status, the facility by time interaction, and the time by mental status interaction. The analyses were repeated for reach facility using time, sex, age, mental status, and the time by mental status interaction. Tabularized means and standard deviations were calculated from the raw data and do not represent estimated marginal means. Type 1 error occurrence was controlled at P = .05.
Results
Within-Group Findings
Table 1 reports mean prealbumin, body weight, and food intake from baseline to post intervention for each treatment group. Serum prealbumin levels and body weight significantly increased post intervention for treatment group residents (prealbumin, P = .001; body weight, P = .029) but not so for comparison group residents (prealbumin, P = .288; body weight, P = .053). Treatment groups consumed similar amounts of food post intervention when compared to baseline (intervention, P = .855; comparison, P = .584). The MMSE scores were not associated with changes in reported serum prealbumin, body weight, or food intake.
Mean Outcome Measures for Baseline and Post intervention.a
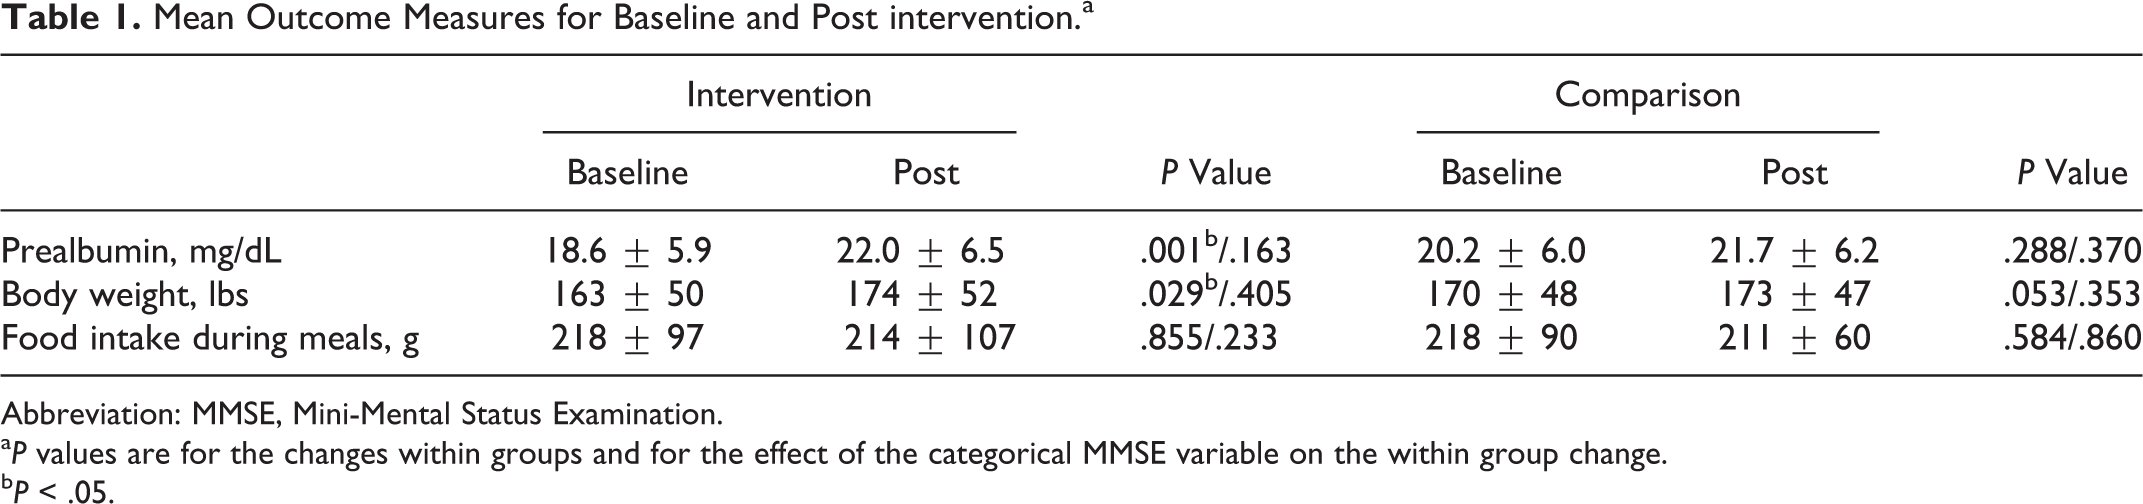
Abbreviation: MMSE, Mini-Mental Status Examination.
a P values are for the changes within groups and for the effect of the categorical MMSE variable on the within group change.
b P < .05.
Table 2 reports the mean in meal service satisfaction from baseline to post intervention using the FoodEx-LTC. Overall, intervention group residents reported significant improvements in 2 of the 4 domains (enjoying food and food service, P = .027; providing food service, P = .014) in comparison to control group residents who improved in only 1 domain, cooking good food (P = .018). Of the 4 domains, 1 domain (cooking good food) also showed a significant MMSE by time interaction for comparison group residents.
Mean FoodEx-LTC Measures for Baseline and Post interventiona
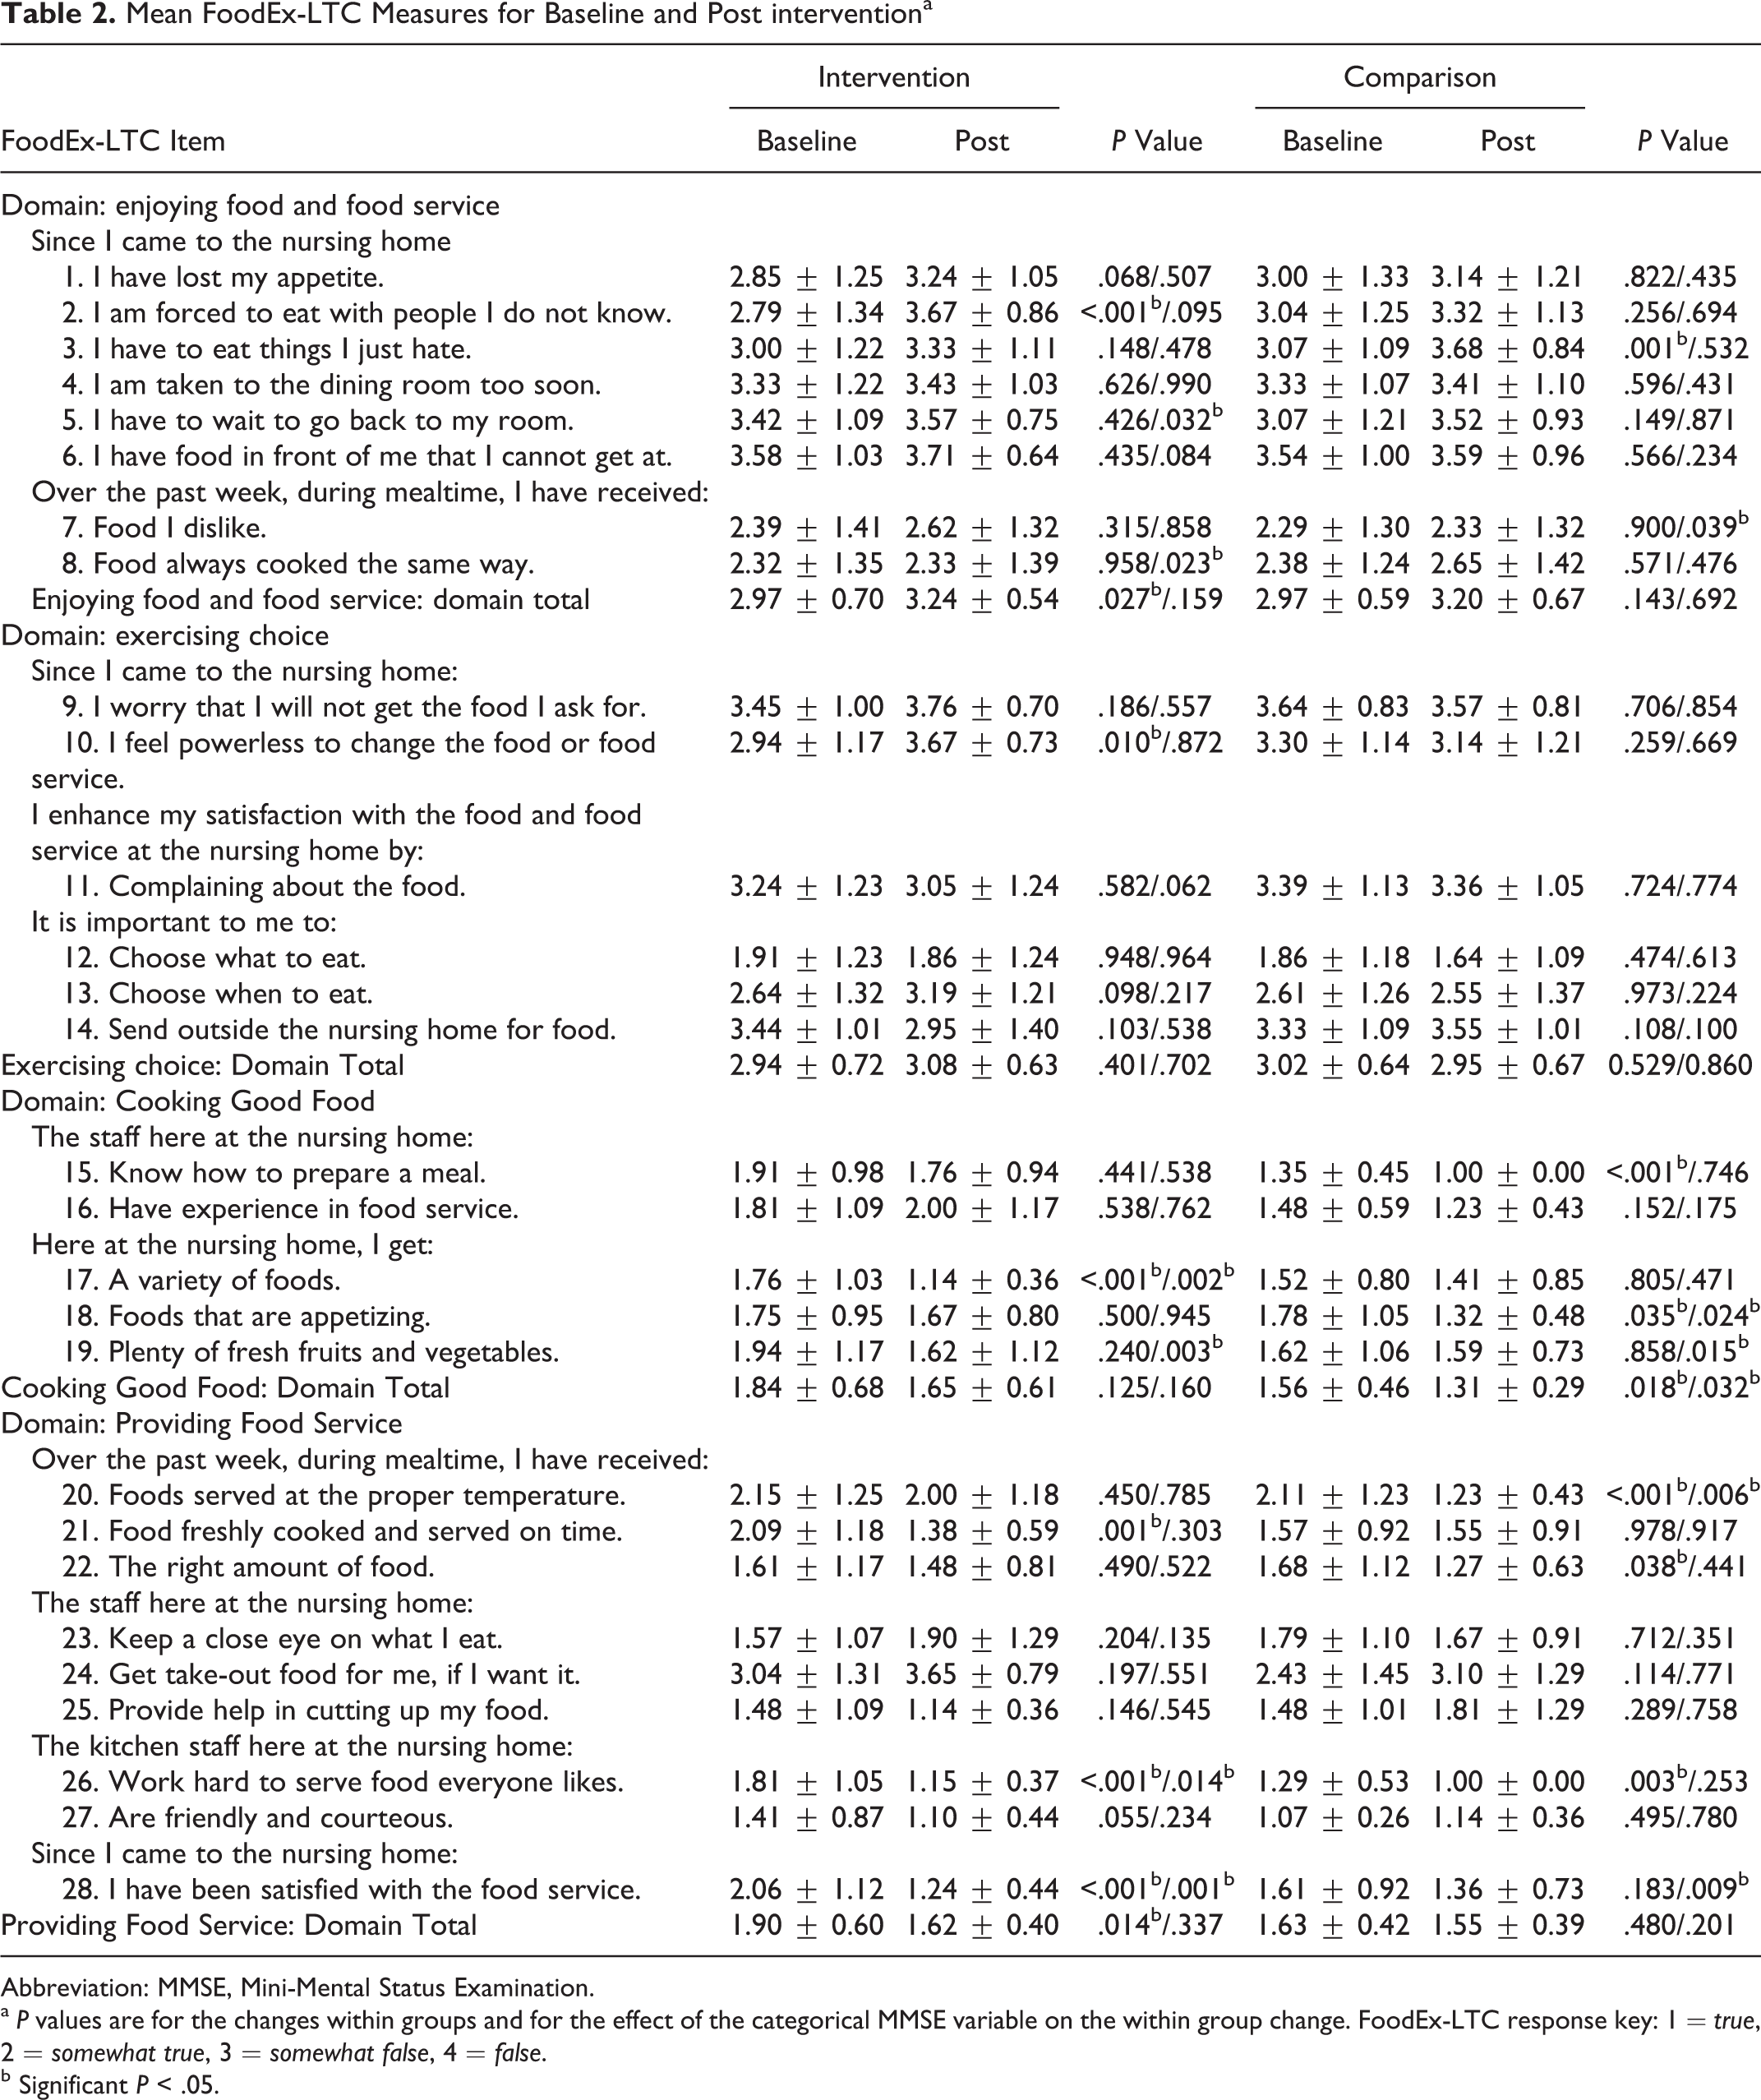
Abbreviation: MMSE, Mini-Mental Status Examination.
a P values are for the changes within groups and for the effect of the categorical MMSE variable on the within group change. FoodEx-LTC response key: 1 = true, 2 = somewhat true, 3 = somewhat false, 4 = false.
b Significant P < .05.
Across-Group Findings
Across-group nutritional differences are reported in Table 1. Serum prealbumin, body weight, and food intake were not significantly different (P < .05) at baseline. Resident satisfaction with food and meal service is reported in Table 2. At baseline, there were no significant differences between groups for 2 of the 4 FoodEx-LTC domains (enjoying food & food service, exercising choice). However, there was a significant difference across groups in the domains of cooking good food (P = .03) and providing food service (P = .05).
Table 3 reports the pre- and post mean for each group for FoodEx-LTC items that were significant in the within group analysis. The P values of the entire sample (from both nursing homes) are indicated for the mental status by condition interaction. Changes, dependent on mental status, were found for 6 items and 1 domain. Three of the items were not influenced by MMSE scores: #5—I have to wait to go back to my room; #7—I have received food I dislike; and #18—I get foods that are appetizing.
Residents with normal MMSE scores were more likely to report post intervention improvement in items #17—I get a variety of foods; #8—I have received food always cooked the same way; #20—I have received foods served at the proper temperature; and #27—The kitchen staff here at the nursing home are friendly and courteous. Residents with moderate cognitive impairment (MMSE scores 11-19) reported significant improvement in getting “plenty of fresh fruits and vegetables” (item #19) post intervention. All intervention group residents reported improved satisfaction with the food service (item #28); however, residents with MMSE scores <19 and 24 to 30 reported the greatest improvement.
FoodEx-LTC Item Means by Condition and MMSE Score Category With P Value for Effect of Mental Status by Time Interaction in the Combined Samples Model.a
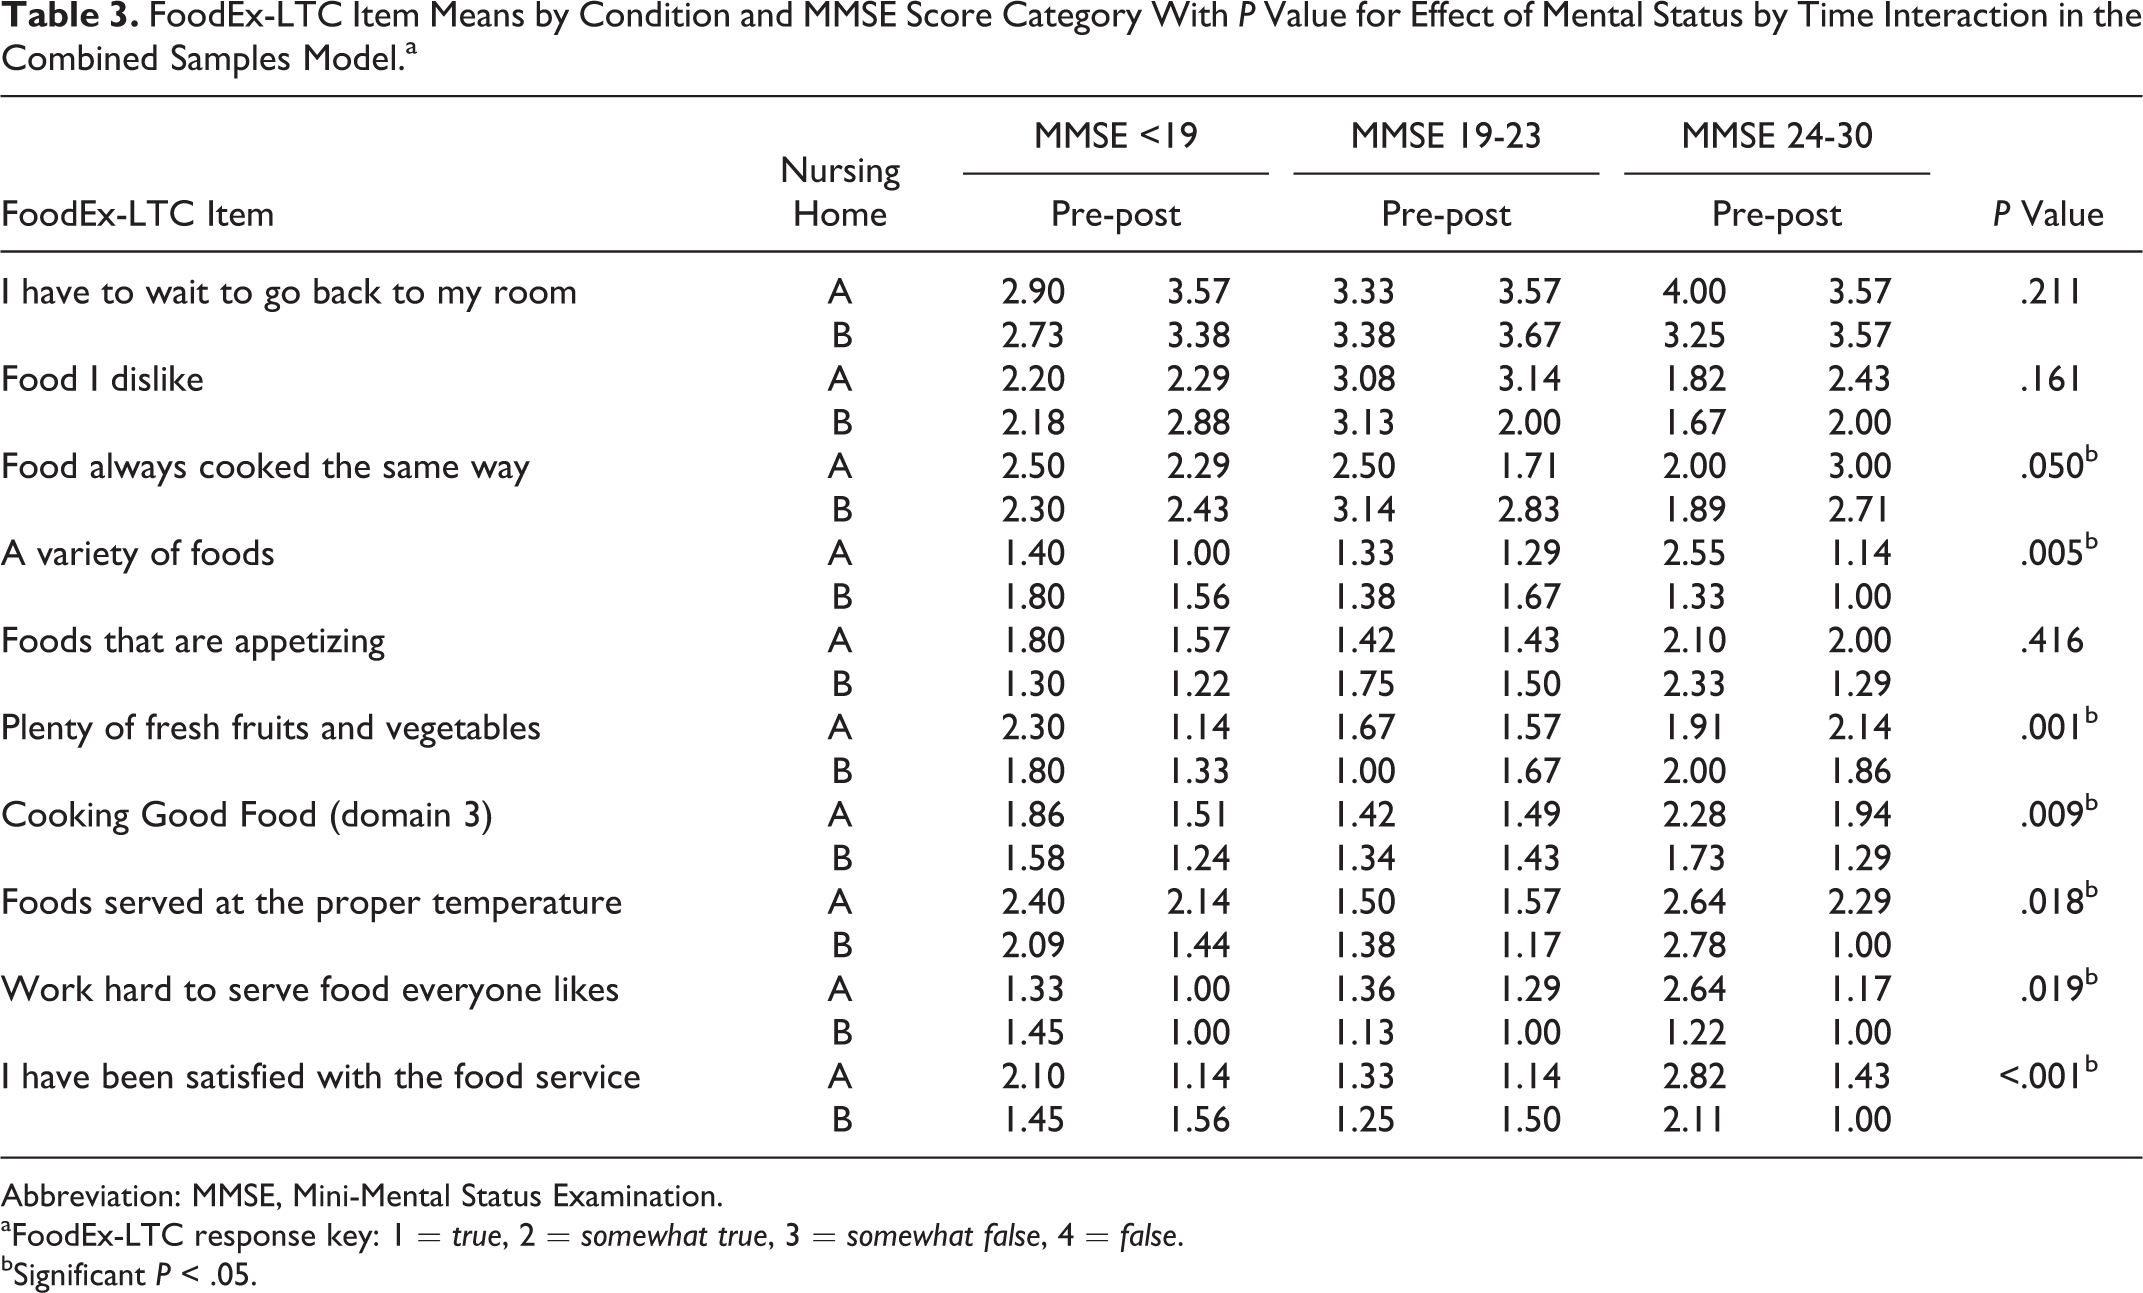
Abbreviation: MMSE, Mini-Mental Status Examination.
aFoodEx-LTC response key: 1 = true, 2 = somewhat true, 3 = somewhat false, 4 = false.
bSignificant P < .05.
Discussion
This article describes the impact of the EatR food delivery system on cognitively impaired residents’ food satisfaction, food intake, and subsequent nutritional status. There were no significant differences in food intake from baseline to post intervention in either group. However, intervention group residents experienced significant improvements in serum prealbumin levels (P = .001) and body weight (P = .029) post intervention. Even though the intervention group residents did not eat more food, the nutritional value of the food they did consume may have improved with the intervention. A menu that encourages food choice and daily selection options served on a steam table in the dining room may lead to improvement in the “quality” of food consumed.
Involving cognitively impaired residents in quality improvement efforts aimed at improving food and meal service satisfaction is integral to any system-wide change. In a systematic review of the literature (using PubMed and Cochrane Databases), no intervention studies were found aimed at improving food intake in cognitively impaired residents in nursing homes. However, Simmons et al 7 did interview 163 nursing home residents using 5 standardized questions to determine whether there was a relationship between cognitive status and resident food and meal service complaints. Those who expressed complaints about the food, ate less food, had less cognitive impairment, and had more depressive symptoms than those who did not. Residents with cognitive impairment were less likely to complain about the food and meal service.
Inadequate food intake is a multifaceted problem, thus findings from this study are not generalizable to other nursing home populations. However, study findings were encouraging. Results found that MMSE scores were not associated with changes in serum prealbumin levels, body weight, or food intake. Most importantly, even though some items demonstrated significant changes with mental status, the pattern of change in scores suggests that mental status was not associated with a resident’s ability to actively participate in the Rate the Food process or choose the foods they like and prefer to eat, nor did mental status appear to be related to the resident’s ability to gain weight using the EatR food delivery system.
Footnotes
Declaration of Conflicting Interests
The authors declared no potential conflicts of interest with respect to the research, authorship, and/or publication of this article.
Funding
The authors disclosed receipt of the following financial support for the research, authorship, and/or publication of this article: Article is the result of funding provided by the Alzheimer’s Association Foundation, Grant #IIRG-10-169412.