
Abstract
This study determined the sensitivity and specificity of the telephone-administered Minnesota Cognitive Acuity Screen (MCAS) to distinguish mild cognitive impairment (MCI) from healthy controls (HCs) and from Alzheimer’s disease (AD). A total of 100 individuals with MCI, 50 individuals with possible/probable AD, and 50 HCs were screened to exclude medical and psychiatric conditions affecting cognition. In-office evaluation included neuropsychological testing, neurologic examination, and neurodiagnostic work-up. Participants with AD obtained significantly lower MCAS total scores than participants with MCI, who in turn performed worse than the HC group. Sensitivity was 86% and specificity was 78% for distinguishing between MCI and HC. Sensitivity was 86% and specificity was 77% for discriminating between MCI and AD. Sensitivity was 91% and specificity was 78% for discriminating between impaired groups (MCI and AD) and HCs. Results suggest that the MCAS successfully discriminates MCI from HC and AD and has potential as an effective telephone-administered screening tool for memory disorders.
Introduction
Mild cognitive impairment (MCI) is a cognitive state that falls between normal aging and dementia. An individual with MCI has a significantly increased rate of conversion to dementia/Alzheimer’s disease (AD) when compared with the normal population. These figures approach 12% conversion per year compared with 1% to 2% in the normal elderly population. 1 As a result, it has become increasingly important to identify MCI. At present, the most effective way to identify an individual with MCI involves an office visit, which typically includes a neurologic examination, neuropsychological evaluation, laboratory work-up, and neuroimaging. However, many older adults refuse to see specialists, are homebound, live in rural settings, or lack transportation. In addition, a comprehensive evaluation can be costly. Therefore, a telephone-based assessment approach may be a cost-effective and highly accessible method to screen individuals and to identify those who would benefit most from a comprehensive, in-office work-up. Older adults who are reluctant to visit a specialist may also be more agreeable to undergo a brief telephone screening test. In a research setting, an accurate telephone cognitive test could assist in identifying participants who have a high likelihood of meeting study inclusion criteria for cognitive impairment. This may be critical as new treatments are developed and tested in MCI.
A number of telephone-based cognitive measures have been developed. In general, these instruments have been effective in distinguishing between individuals with dementia and cognitively healthy individuals. 2 For example, the most popular telephone-based cognitive measure, the Telephone Interview for Cognitive Status ([TICS] and its modification TICS-m), shows 94% sensitivity and 100% specificity for distinguishing patients with AD from healthy controls (HCs). 3 Fewer studies have examined whether telephone-based instruments can identify MCI and distinguish it from normal aging and early dementia. Lines et al 4 used the TICS-m to recruit individuals with amnestic MCI from a community sample of 16 998 individuals who had memory complaints. About one third of those screened performed in a predetermined range on the TICS-m suggestive of MCI. Of those individuals who completed in-person assessment, only 43% met criteria for MCI. Crooks et al 5 found that the TICS-m had poor sensitivities when distinguishing individuals with MCI or age-associated memory impairment from either normal cognition or dementia. In contrast, another study 6 examined the TICS-m to identify amnestic MCI based on thorough in-person assessment in a community sample (54 normal and 17 MCI). They found that the TICS-m had 84% sensitivity and 87% specificity (85.9% overall accuracy) to detect MCI. Knopman et al 7 investigated the TICS-m in classifying individuals who had dementia, MCI, or who were cognitively normal. Using specific cutoffs for the TICS-m, they showed correct classification of 78.3% of cognitively normal and 69% of dementia, but only 42.9% of MCI. Similarly, Manly et al 8 found that among an ethnically diverse sample, the TICS showed the highest sensitivity for distinguishing between demented and nondemented individuals (combining normal and MCI; 88%), but the TICS ability to distinguish MCI and normal was considerably lower (79% sensitivity and 58% specificity). Duff et al 9 found that the TICS-m accounted for 38% of the variance of an in-person memory composite score and 25% of the variance in the same score 1 year later. Overall, there is considerable variability in the accuracy of this telephone-based cognitive measure to identify MCI, and it is unclear whether other telephone screening instruments could be useful for this purpose.
Because of the modest findings with the TICS-m, we explored the use of the telephone-administered Minnesota Cognitive Acuity Screen (MCAS). The MCAS was developed based on review of the literature related to cognitive assessment, consultation with clinical experts, and review of other cognitive screening tests currently available. Unlike the TICS-m, which primarily focuses on memory assessment, the MCAS is more detailed and assesses a variety of cognitive domains, including orientation, attention, short-term memory, comprehension, repetition, naming, computation, judgment, and verbal fluency. The MCAS was shown to distinguish between cognitively healthy individuals (n = 129) and individuals with mild-to-moderate dementia (n = 99) with a high level of accuracy (97.5% sensitivity and 98.5% specificity). 10 Given its accuracy for detecting dementia, the next logical step is to determine whether the MCAS can accurately identify MCI and distinguish it from normal aging and mild dementia.
The purpose of the current study was to determine the sensitivity and specificity of the MCAS for distinguishing individuals with MCI, dementia, and normal cognitive aging. In addition to diagnostic validity, we examined relationships between MCAS performance and performance on in-office measures of cognitive function.
Methods
Participants
Participants were 200 community-dwelling older adults aged 55 to 85, 100 of whom were diagnosed with amnestic MCI, 50 with probable/possible mild AD, and 50 were HCs. Patients with MCI and AD were recruited from a memory disorders center. Healthy controls were recruited via advertising and soliciting family members of memory clinic patients. All participants were required to be English-speaking with access to a telephone, have adequate vision and hearing to complete study procedures, and no history of severe psychiatric disorder or alcohol or substance abuse/dependence within the last 2 years. Individuals with MCI or AD were required to have an informant with whom they had at least 10 hours of contact per week, be on stable doses (4 weeks) of dementia medications and/or antidepressants, brain imaging (MRI or CT) to rule out structural changes that could explain their cognitive symptoms, Hachinski 11 scores <4 to rule out significant cardiovascular disease, no evidence of current depression (as indicated by a Cornell Scale for Depression in Dementia 12 [CSDD] of 8 or higher or whether they had a current diagnosis of major depression), and no history of other neurologic or developmental disorders that impact cognition. In order to qualify as a HC, participants were required to have a Mini Mental Status Examination 13 (MMSE) score within the normal range for their age and educational attainment, no history of neurological or developmental disorder that impacted cognitive functioning, no evidence of current depression, and no cognitive complaints. Controls were not required to have informants. Dementia severity was measured by the Clinical Dementia Rating (CDR) scale. 14 Participants with MCI were required to have a memory complaint, objective memory loss defined as scores falling at least 1.5 standard deviations (SDs) below a participant’s age-adjusted mean on any aspect of memory testing (learning, delayed recall, and recognition/discriminability), CDR of 0.5, and largely preserved activities of daily living. Participants with AD were required to have CDR of 0.5 to 1.0 and to meet National Institute of Neurological and Communicative Disorders and Stroke and the Alzheimer's Disease and Related Disorders Association (NINCDS/ADRDA) diagnostic criteria for probable or possible AD. Patient classifications were established by consensus conference (including neurologists, neuropsychologists, and neuropathologists) without knowledge of MCAS scores. All data available for the patient from their medical record as well as measures from the study were used to assign a diagnosis. Any disagreements were resolved by majority vote.
Procedure
After obtaining informed consent, all participants completed an office visit that included meeting with a neurologist (who completed a neurological exam, CDR, MMSE, and CSDD) and a neuropsychologist or trained research assistant to complete cognitive testing. The neuropsychological evaluation was comprised of the American National Adult Reading Test, 15 Boston Naming Test, 16 Category Fluency (Animals), Hopkins Verbal Learning Test—Revised (HVLT-R), 17 Judgment of Line Orientation, 18 Mattis Dementia Rating Scale-2 (DRS), 19 Rey-Osterrieth Complex Figure (copy condition, Boston Qualitative Scoring System), 20 Trail Making Test A and B, 21 and Wechsler Adult Intelligence Scale—III Digit Symbol subtest. 22 Patients’ informants completed the Lawton Brody Activities of Daily Living Scale. 23 This scale is an informant-based measure of activities of daily living that assesses older adults’ ability to independently carry out both basic (eg, grooming, feeding, and dressing) and instrumental (eg, shopping and financial and medication management) activities of daily living. Patient groups also completed neurodiagnostic testing as part of their clinical work-up (eg, neuroimaging and laboratory testing).
All participants completed telephone testing with the MCAS, an average of 18.91 (SD = 15.20) days after their office visit. The MCAS takes approximately 15 minutes to administer and covers a wide range of cognitive domains, including the following: (1) orientation—brief questions to assess orientation to person, place (ie, home address and state during call), and time (8 points); (2) digit span—the examinee is asked to repeat digit sequences (6 points); (3) delayed word recall (repeated twice)—10 words are presented to the examinee, who is asked to use each one in a complete sentence and then asked to recall at the end of the examination (10 points); (4) comprehension—the examinee is asked to follow 2- and 3-part commands (3 points); (5) repetition—the examinee is asked to repeat sentences (4 points); (6) naming—the examinee is asked to name items based on a verbal description (eg, what do people wear that tells time; 4 points); (7) computation—the examinee is asked to perform basic mental calculations (8 points); (8) judgment—the examinee is presented with problematic scenarios and asked what they would do (8 points); and (9) verbal fluency—the examinee is asked to name as many fruits and vegetables as possible in 30 seconds (1 point per word generated). Examinees are frequently reminded that all questions need to be done in their head and that they cannot use paper and pencil.
Statistical Analyses
All analyses were conducted with SPSS version 12 (SPSS Inc, Chicago, Illinois) and Splus 8.2 for Solaris/Linux (TIBCO Software Inc, Palo Alto, California). Analysis of variance was used to determine overall group differences in demographic characteristics, in-office neuropsychological test performance, and performance on the MCAS subtests. Any significant overall result was followed by a Fisher’s least significant difference procedure to identify specific group differences. Pearson product–moment correlations were calculated between MCAS total score and in-office neuropsychological measures.
For the 2-class diagnostic testing (eg, AD vs HC), receiver operator characteristic (ROC) curves were employed to evaluate overall classification accuracy in a manner that does not depend on disease prevalence but relies solely upon the probabilities of correct classification in each of the 2 diagnostic classes of interest. 24 In situations such as this one, where lower marker scores indicate increased impairment, the area under the curve (AUC) can be shown to correspond to the probability that 2 study participants, each one randomly drawn from the AD and the HC groups, will be correctly ordered in terms of their MCAS total scores (AD < HC). Because the probability of obtaining a correct ordering of a randomly drawn pair of participants with AD and HCs is 1/2 under the null hypothesis of no association between the MCAS score and cognitive impairment, AUC values above 0.50 are suggestive of marker informativeness, with AUC values of 1.00 corresponding to perfect discrimination of participants with AD and HCs. 25
For 3-class diagnostic tests, in which the classes are ordered (eg, AD vs MCI vs HC), the natural extension of ROC methodology to plotting probabilities of correct classification in each of the 3 classes on the unit cube leads to volume under the surface (VUS) as the natural metric of classification accuracy. This value corresponds to the probability that 3 study participants, each one randomly drawn from the AD, MCI, and HC groups, respectively, will be correctly ordered in terms of their MCAS total score (AD < MCI < HC). Because the probability of obtaining a correct ordering of a randomly drawn triplet of participants with AD, MCI, and HC is 1/6 under the null hypothesis of no association between the MCAS score and cognitive impairment, VUS values above 0.17 are suggestive of marker informativeness, with VUS values of 1.00 again corresponding to perfect discrimination. 26
In determining the optimal cutoffs of the MCAS total score for distinguishing AD from MCI (c1) and MCI from HC (c2), we used the Youden index approach. 27 For 2-class diagnostic tests, in which misclassification costs are assumed equal across classes, the Youden index maximizes the sum of sensitivity and specificity across all possible cutoffs; geometrically, it corresponds to identifying the point on the ROC curve which is furthest from the 45° line, that is, from chance classification. 28 For 3-class diagnostic tests, in which the classes are ordered, the natural extension of this approach is to seek pairs of ordered cutoff scores (c1 < c2) that maximize the sum of the correct classification rates for each diagnostic class. 29
Finally, we used ordinal logistic regression with adjacent category logits to generate predicted probabilities for MCAS total scores using age and education as covariates and then regenerated covariate-specific ROC curves to identify whether sensitivity and/or specificity could be improved after controlling of these factors. 30
Results
Group Differences
Table 1 presents demographic characteristics of the 3 groups. Healthy controls were significantly younger and had more education than individuals with MCI and AD who did not differ from each other. The mean time between the office visit and the telephone test with the MCAS was significantly shorter in the control group when compared with the patient groups, but again patient groups were not different from each other.
Demographic Characteristics of HCs, MCI, and AD a
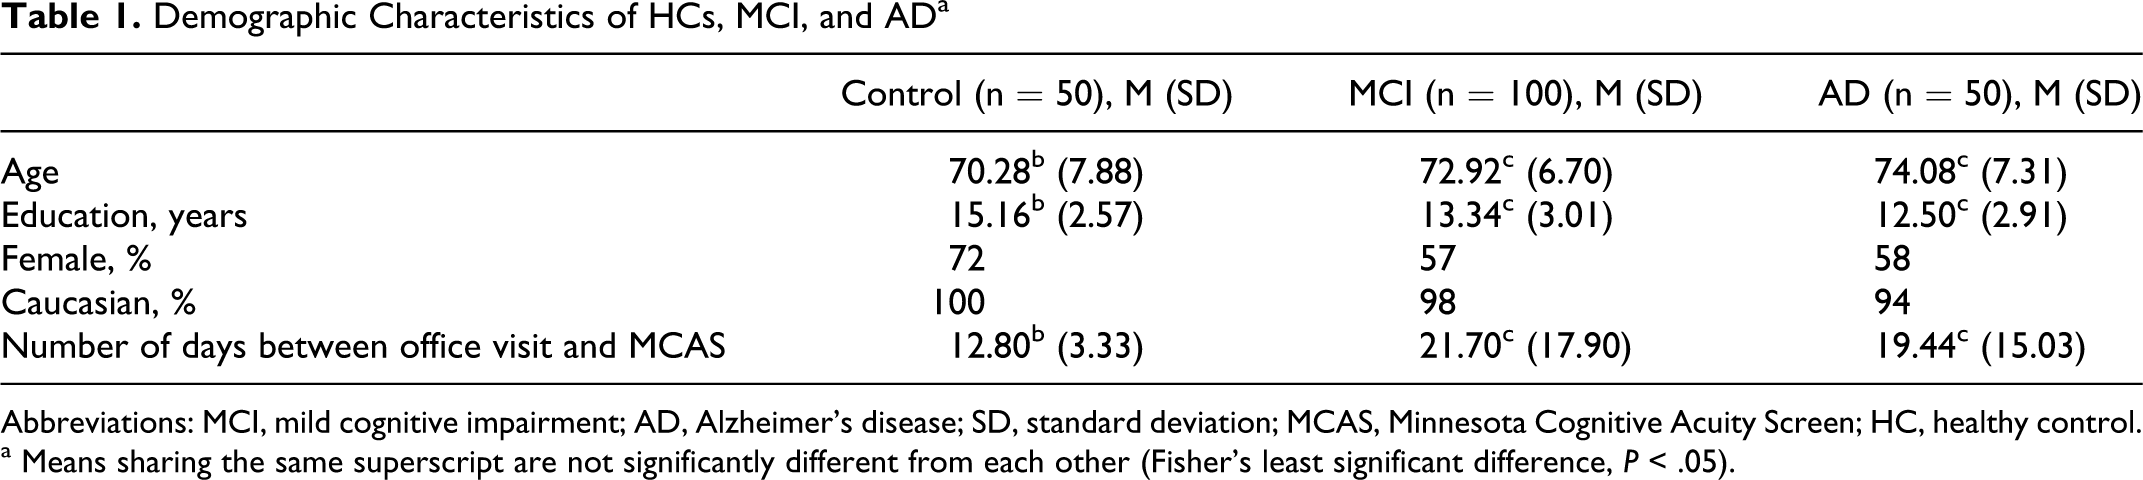
Abbreviations: MCI, mild cognitive impairment; AD, Alzheimer’s disease; SD, standard deviation; MCAS, Minnesota Cognitive Acuity Screen; HC, healthy control.
a Means sharing the same superscript are not significantly different from each other (Fisher’s least significant difference, P < .05).
Results of the in-office neuropsychological testing for the 3 groups showed that the control group performed significantly better than the MCI group who in turn performed significantly better than the AD group on all measures (data not shown, available upon request). Table 2 displays the scores on each of the MCAS subtests and total score for each of the 3 groups. Most subscale scores and the total score showed the same pattern as the in-office neuropsychological test results, with a few exceptions. Controls outperformed patients with AD on the digit span subtest, although MCI patients did not differ from either group. Control participants performed significantly better than patient groups on the repetition subtest who did not differ from each other. No significant differences between any of the groups were seen for the naming subtest.
Mean MCAS Scores for Each Group a
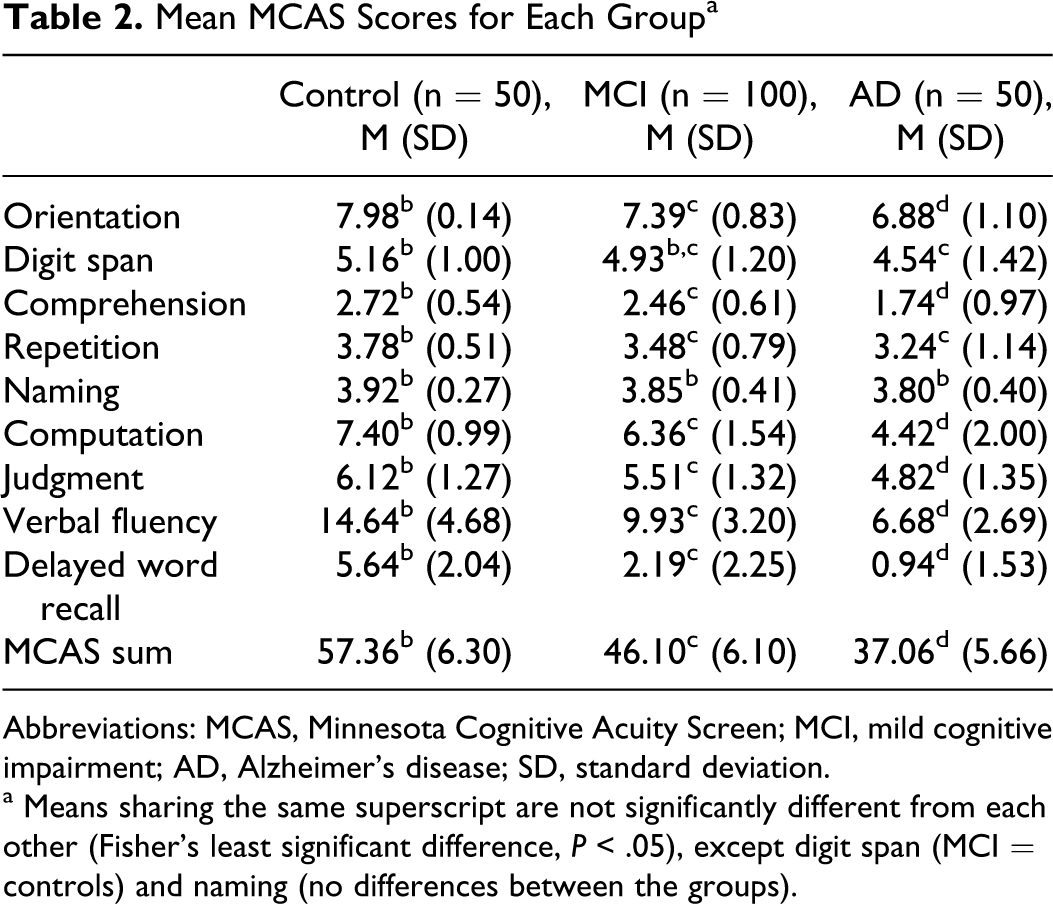
Abbreviations: MCAS, Minnesota Cognitive Acuity Screen; MCI, mild cognitive impairment; AD, Alzheimer’s disease; SD, standard deviation.
a Means sharing the same superscript are not significantly different from each other (Fisher’s least significant difference, P < .05), except digit span (MCI = controls) and naming (no differences between the groups).
Correlations
To examine the concurrent validity of the MCAS, we examined correlations between the MCAS and commonly used office measures of dementia. The MCAS total score showed strong positive correlations with the MMSE (r = .73, P < .001) and the Mattis DRS (r = .81, P < .001). A significant inverse correlation was seen between MCAS total score and CDR sum of box scores for the patient groups (r = −.56, P < .001), suggesting that poorer performance on the MCAS was associated with higher box scores.
Receiver Operator Characteristic Analysis
The Youden index approach to estimate optimal pairs of cutoff scores in our 3-class classification problem suggested that (42.5, 52.5) be chosen as the boundaries of the MCI region, with participants scoring lower than 42.5 characterized as AD, and those scoring higher than 52.5 assigned to the HC group. 29 This particular choice of cutoffs resulted in 86% of participants with AD, 63% of participants with MCI, and 78% of HC participants being correctly classified. Overall classification accuracy was measured using the VUS criterion. Bootstrap simulation with 1000 replications and ties between observations broken at random produced a VUS estimate of 0.761 (95% confidence interval [CI] = 0.691-0.830), indicating that the MCAS total score will correctly order randomly drawn triplets of participants with AD and MCI and HCs 4.5 times more often than expected under the null hypothesis of no discriminatory ability.
Even though the cutoffs were derived on the basis of 3-class optimality criteria, it was of interest to evaluate their performance in a 2-class setting as well, that is, when comparing pairs of diagnostic classes against each other, with the remaining class excluded as a possible outcome. The MCAS showed excellent discriminatory power in distinguishing between participants with HC and MCI, with an AUC of 0.902 (95% CI = 0.853-0.952, P < .001). At the optimal MCAS cutoff score of 52.5, sensitivity and specificity reached 86% and 78%, respectively (Table 3 ).
Sensitivity and Specificity of Select MCAS Total Score Cutoff Scores to Separate Participants With MCI (n = 100) From HCs (n = 50) a
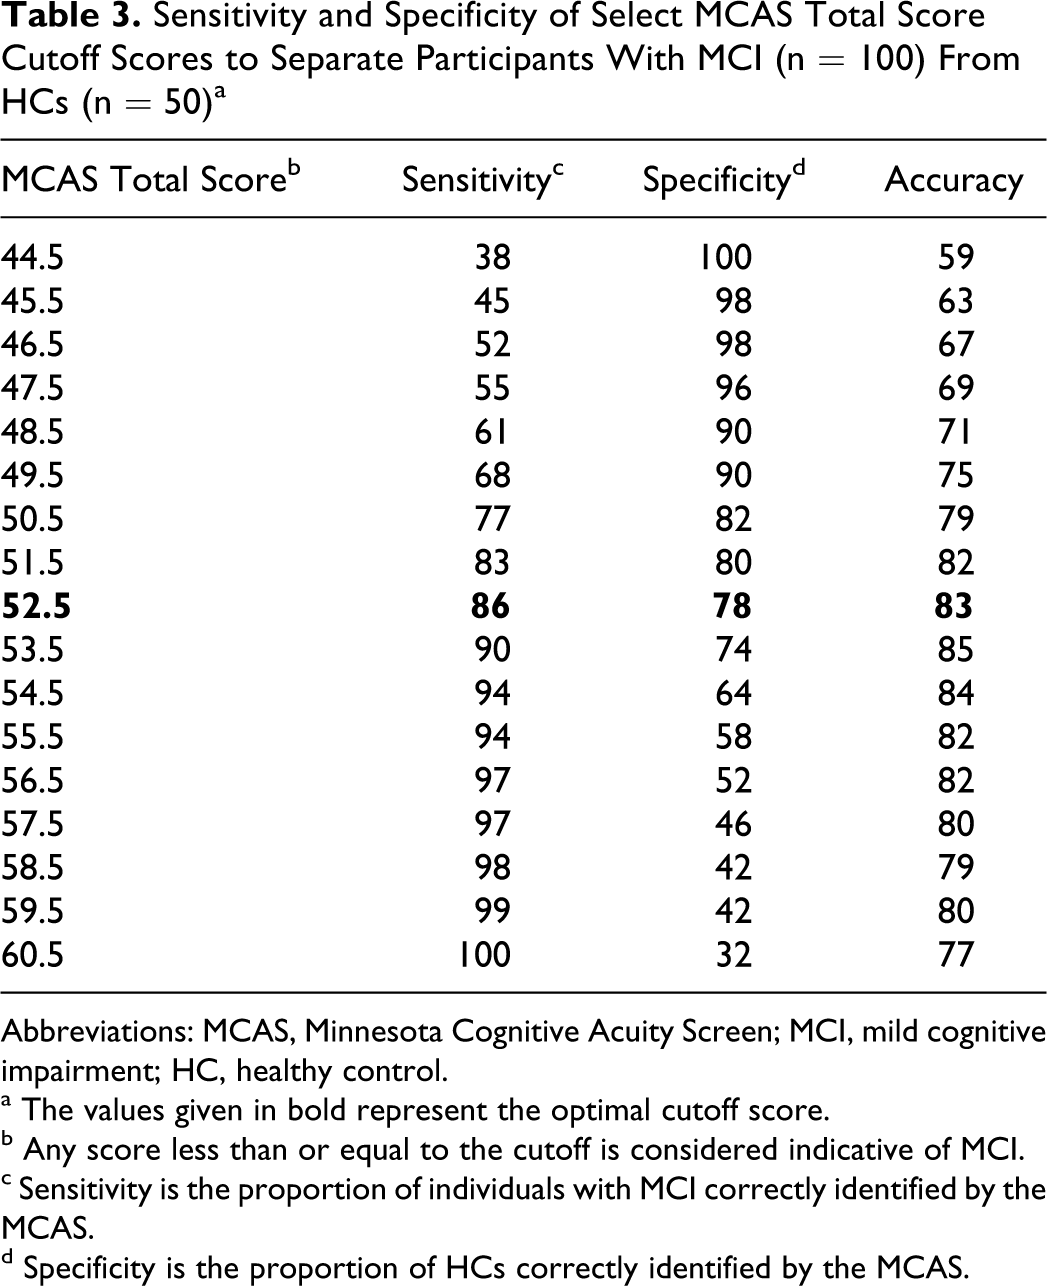
Abbreviations: MCAS, Minnesota Cognitive Acuity Screen; MCI, mild cognitive impairment; HC, healthy control.
a The values given in bold represent the optimal cutoff score.
b Any score less than or equal to the cutoff is considered indicative of MCI.
c Sensitivity is the proportion of individuals with MCI correctly identified by the MCAS.
d Specificity is the proportion of HCs correctly identified by the MCAS.
The MCAS also showed strong ability to distinguish between participants with MCI and AD, with analyses revealing an AUC of 0.858 (95% CI = 0.795-0.920, P < .001). Indeed, at the optimal MCAS cutoff score of 42.5, sensitivity and specificity were almost identical to those obtained for the MCI versus HC comparison, reaching 86% and 77%, respectively (Table 4 ).
Sensitivity and Specificity of Select MCAS Total Score Cutoff Scores to Separate Participants With MCI (n = 100) From Participants With AD (n = 50) a
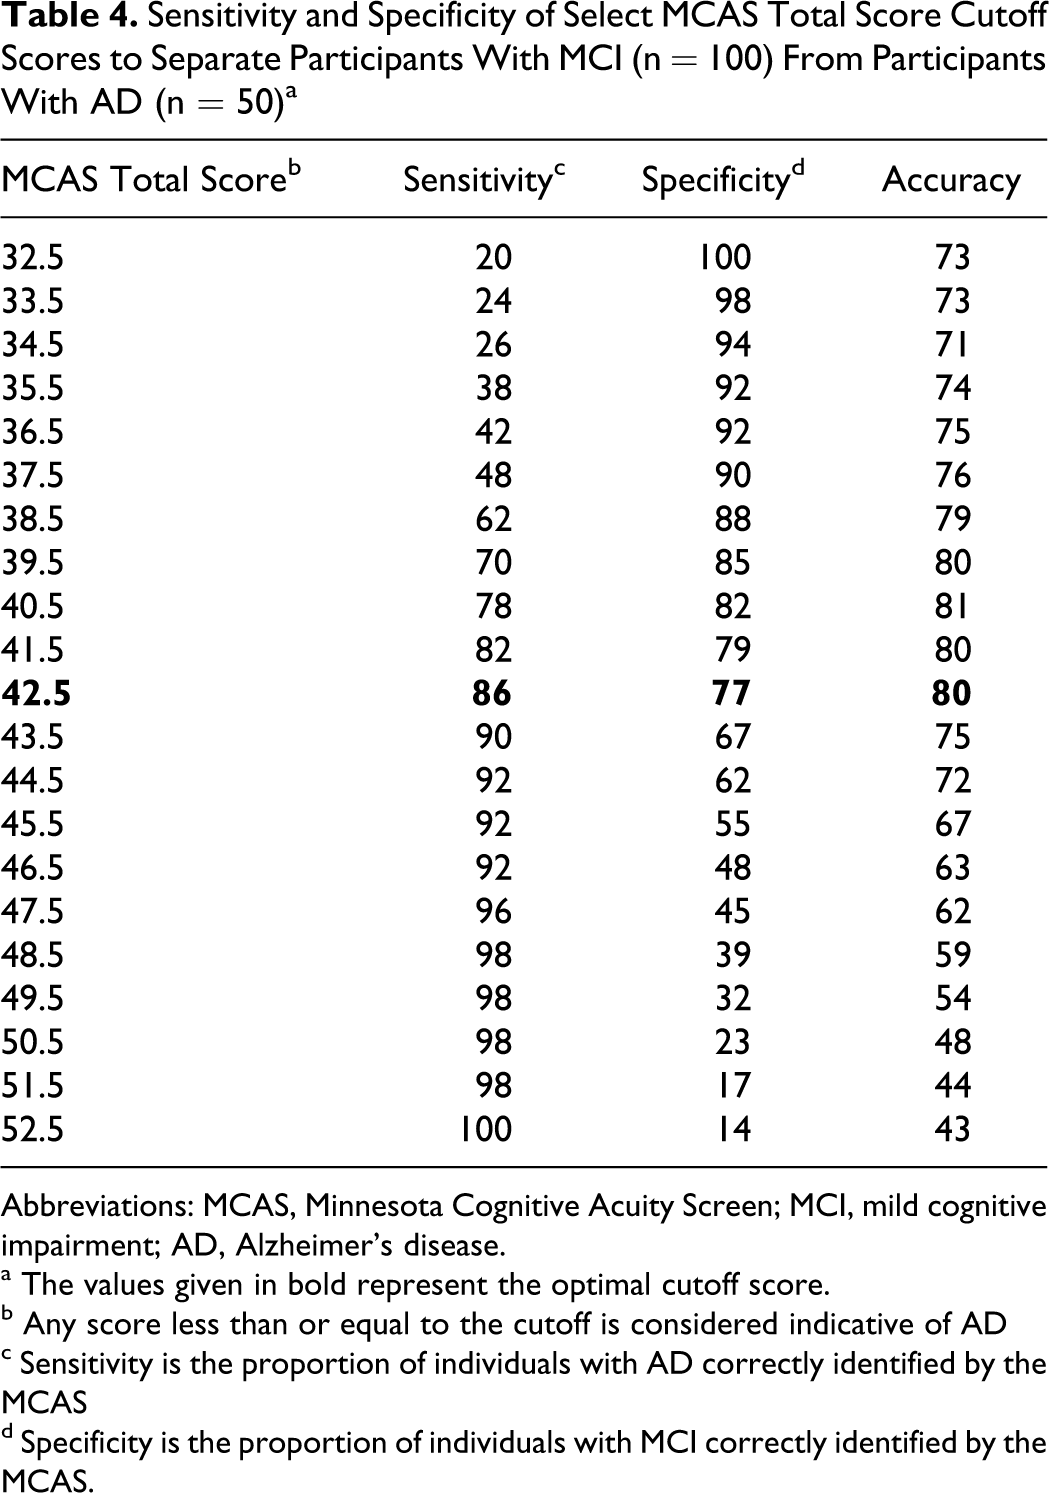
Abbreviations: MCAS, Minnesota Cognitive Acuity Screen; MCI, mild cognitive impairment; AD, Alzheimer’s disease.
a The values given in bold represent the optimal cutoff score.
b Any score less than or equal to the cutoff is considered indicative of AD
c Sensitivity is the proportion of individuals with AD correctly identified by the MCAS
d Specificity is the proportion of individuals with MCI correctly identified by the MCAS.
As a replication of the Knopman et al study, 10 we also examined the ability of the MCAS total score to distinguish between participants with AD and HC, when MCI was excluded as a possible outcome. Receiver operator characteristic analyses revealed near-perfect discrimination in this 2-class scenario, with an AUC of 0.993 (95% CI = 0.983-1.000; P < .001). The optimal MCAS cutoff score of 47.5 fell at the exact midpoint of the (42.5, 52.5) interval characteristic of participants with MCI in a 3-way classification and resulted in 96% sensitivity and 96% specificity. Finally, results of an ROC analysis to determine the ability of MCAS total scores to distinguish between impaired (either MCI or AD) and unimpaired (HC) study participants showed an AUC of 0.933 (95% CI = 0.898-0.976, P < .001). The optimal cutoff on the MCAS remained at 52.5 as expected, but the increased cognitive impairment burden in this mixed MCI/AD patient group relative to the pure MCI group previously used for deriving the lower bound of the HC region raised sensitivity to 91%, while specificity remained at 78% (Table 5 ).
Sensitivity and Specificity of Select MCAS Total Score Cutoff Scores to Separate Participants With MCI or AD (Impaired; n = 150) From HCs (n = 50) a
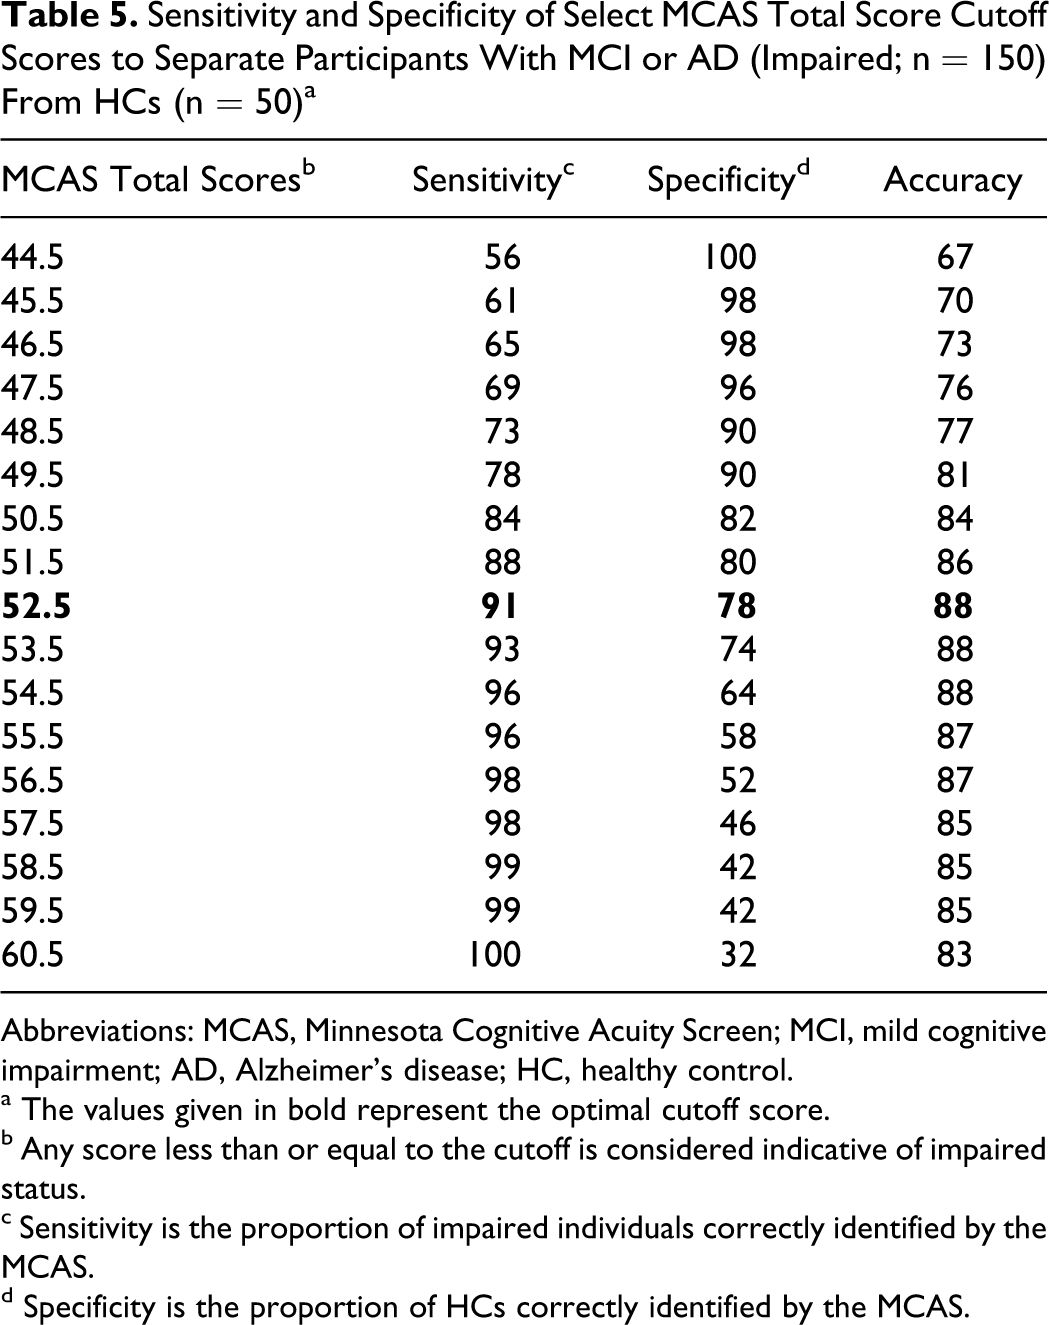
Abbreviations: MCAS, Minnesota Cognitive Acuity Screen; MCI, mild cognitive impairment; AD, Alzheimer’s disease; HC, healthy control.
a The values given in bold represent the optimal cutoff score.
b Any score less than or equal to the cutoff is considered indicative of impaired status.
c Sensitivity is the proportion of impaired individuals correctly identified by the MCAS.
d Specificity is the proportion of HCs correctly identified by the MCAS.
Because of age and education differences between patient and control groups, we reanalyzed data controlling for these variables in the ROC analyses. We found only minimal changes in sensitivity and specificity. For example, the sensitivity to distinguish between MCI and HCs was improved by 2%, whereas there was no change in specificity. Similar findings were seen for the other group comparisons. Based on these results, we chose to present cutoff scores without age and education correction for ease of interpretation and use.
In Tables 3 to 5, we also present the overall accuracy of classifications based on the MCAS total score for different choices of possible cutoffs, as a way of validating our choice of optimal cutoff based on the Youden index approach of maximizing the unweighted sum of sensitivity and specificity. 28 However, we note that overall classification accuracy depends on the assumed disease prevalence (ie, accuracy = sensitivity × prevalence + specificity × (1 − prevalence)) and can be misleading when the number of participants in the AD, MCI, and HC groups is determined a priori by study design considerations and does not reflect the relative sizes of these groups in the population to which the MCAS test battery will actually be administered. 24
Discussion
Findings from this study show that the MCAS, a brief, telephone-administered cognitive test, successfully discriminates individuals with MCI from HCs and MCI from those with AD. Results also replicate the original study with the MCAS, showing high sensitivity and specificity for discriminating AD and HCs. 10 We found that the MCAS had over 95% sensitivity and specificity for making this distinction, which was very close to the original estimates found by Knopman et al. 10 Minnesota Cognitive Acuity Screen subscale scores were slightly worse in the Knopman et al study compared with the present results, likely reflecting that the Knopman sample was residing in a nursing home. Control participants performed very similarly on the MCAS between the 2 studies.
The main purpose of this study was to expand the application of the MCAS to individuals at-risk for developing dementia. Although ROC methodology revealed many possible sensitivity/specificity trade-offs, sensitivity at the recommended MCAS total score cutoff was better than 90% for distinguishing a combined MCI/AD group from HCs, dropping to 86% when the impaired group was made up of participants with MCI alone. Specificity remained at 78% for both sets of comparisons. Compared with estimates reported in the highest quality studies using the TICS-m, MCAS sensitivity was in the same range as the 84% figure reported for an MCI versus HC comparison by Cook et al 6 and exactly double the 42.9% figure reported for this comparison by Knopman et al. 6 7 In contrast, specificities are generally consistent with the 78.3% value reported in Knopman et al, 7 but below Cook et al’s 6 finding of 87%. One factor that may account for the difference is that, in the present study, HC status was based on lack of self-reported memory problems and MMSE score within normal limits for age and education. The Cook et al 6 study classified non-MCI status based heavily on the neuropsychological test scores. Although we did not select based on performance on neuropsychological tests, we found clear statistical separation between the 3 groups on all in-office neuropsychological measures. We did, however, have some HCs performing 1.5 SDs below age and/or education mean on memory tests (ie, 4%-6%) and other neuropsychological tests. These impairment percentages among HCs are well below findings from normative studies, which show up to 26% of older adults in standardization samples, and have at least one impaired memory measure. 31
To investigate factors that accounted for misclassification of HCs as MCI by the MCAS, we compared healthy individuals correctly classified (n = 37) with those misclassified (n = 13) on demographic and neuropsychological variables. Misclassified controls were older (by approximately 5 years) and more likely to be male. Compared with correctly classified controls, those individuals misclassified also showed significantly worse performance on speeded measures (ie, initiation–perseveration subtest from the DRS, Trail Making Test A and B, Digit Symbol, Letter, and Category Fluency), single-trial learning (HVLT-R Trial 1), and global cognitive functioning (DRS total score). Psychomotor speed has been shown to be a predictor of conversion from MCI to dementia. 32 In our study, therefore, the MCAS may have detected some degree of pre-MCI type cognitive impairment in these individuals. The best way to address this issue is to follow these individuals longitudinally to determine whether impairment on the MCAS in healthy older adults predicts later development of MCI.
The MCAS was less accurate in making the distinction between MCI and mild AD, although it did perform better than the TICS-m in differentiating these 2 clinical groups. 7 One could argue that distinguishing between MCI and mild AD is difficult even in a face-to-face office setting. Often the distinction comes down to careful assessment of the impact of cognitive impairment on activities of daily living.
Findings from the group analysis of the MCAS subtests showed that naming performance was insensitive to diagnostic group status. This subtest involves a responsive naming paradigm, in which naming is tested by providing a descriptive cue (eg, “a machine for cutting grass”). The repetition and digit span subtests also did not show consistent separation between all 3 groups. Given these findings, modifications could be made to the MCAS to eliminate subtests that do not contribute to differentiating normal, MCI, and AD, thereby shortening the administration time without sacrificing diagnostic accuracy.
Our findings suggest that the MCAS has potential as an effective screening tool for memory disorders in clinical and research settings. Although it is a not a substitute for a thorough diagnostic evaluation, the MCAS may serve as an effective method to identify individuals at-risk for dementia. The scale could be used as a method to identify individuals with high likelihood of MCI responding to an advertisement for memory complaints. It might also be used in rural settings, in which individuals can be screened prior to traveling to the medical center. We found that the MCAS correlated highly with office-based screening measures, supporting the concurrent validity of the MCAS. The high correlation between the MCAS and the DRS is particularly noteworthy and suggests that the MCAS could have a role in tracking cognitive decline in dementing illnesses.
The study has several limitations. As previously noted, some of the control participants performed poorly on certain cognitive measures. Furthermore, we relied upon self-report to classify control individuals as having no memory complaint and did not involve informants in the process. Previous work has shown that significant percentages of individuals with MCI lack awareness of their deficits. 33 Therefore, it is possible that we included impaired individuals in the control group, thereby attenuating between-group differences in the distribution of MCAS total score. We hope to address this issue as we follow these individuals longitudinally. The cognitive battery was limited to essentially single measures of each cognitive domain to keep the evaluation time reasonable. We included the HVLT-R as our memory measure. It is possible that the results would be different, if we had chosen a story memory task or a visuospatial memory measure. There is evidence, however, that the list learning may be more sensitive to MCI than story memory. 34 It is also important to note that sensitivity, specificity, and classification accuracy rates are likely to be overestimates, given that the same data set was used both for developing and testing the cutoff scores. The next step would be to test our cutoff scores in an entirely independent sample. Therefore, cutoff scores derived in this study may not generalize to other samples. Finally, the results of the study are cross-sectional and do not provide information about whether the MCAS can identify individuals whose MCI reliably predicts the future development of AD.
Overall, the present study found that a brief, telephone-administered cognitive test can accurately distinguish between cognitively healthy individuals and those with MCI and AD. Whether or not the test can perform as well in less highly selected groups will require further studies in community-based samples.
Footnotes
Acknowledgement
The Minnesota Cognitive Acuity Screen was developed by Drs. David Knopman and Dean Knudson and Assessment Services, Inc., based out of the University of Minnesota for Univita Health and it has been used by Univita extensively as a screening test for insurance in the United States for more than 10 years.
The authors declared no potential conflicts of interest with respect to the research, authorship, and/or publication of this article.
The authors disclosed receipt of the following financial support for the research, authorship and/or publication of this article: GT, GDP, JG, LF, and BRO are supported by funds from Univita, Inc., Scottsdale, AZ. GT has served as a paid speaker for Univita, Inc.