
Abstract
Relationship between late-life hypertension and Alzheimer’s disease (AD) remains less clear. Both cross-sectional and longitudinal methods were used to examine whether systolic blood pressure (SBP), diastolic blood pressure (DBP), pulse pressure (PP), mean arterial pressure (MAP), and self-reported hypertension (S-HTN) in late life were associated with having and developing AD. The cross-sectional examination included 1768 individuals with AD and 818 nondemented individuals, and AD was not significantly associated with S-HTN or any of blood pressure measures (S-HTN: P = .236; SBP: P = .095; DBP: P = .429; PP: P = .145; MAP: P = .162). In the longitudinal examination, 594 nondemented individuals, 171 with and 423 without S-HTN at entry, were included. Diastolic blood pressure was significantly related to the development of AD (P = .030) but not S-HTN (P = .251), SBP (P = .294) PP (P = .919), and MAP (P = .060). The association underscores the necessity of further investigation to outline the detailed mechanisms and biological relevance, if any, of late-life DBP to later AD.
Keywords
Introduction
Hypertension decreases the elasticity and increases the resistance of blood vessels, 1 leading to cerebral hypoperfusion 2–4 and cardiovascular disorders, which may contribute to 3,5,6 and worsen cognitive functioning in Alzheimer’s disease (AD). 7 Hypertension also is a risk factor for clinically silent cerebral infarctions in the older population. 8 Silent infarctions, in turn, are associated with an increased risk of developing dementia. 9,10 Additionally, higher systolic blood pressure (SBP) and hypertension in midlife have been linked to an increased risk of developing AD in later life. 11,12
However, the association between late-life hypertension and AD is less clear. Although some longitudinal studies have found late-life self-reported hypertension (S-HTN) and higher blood pressure to be associated with increased incidence of AD, 13 in other studies lower diastolic blood pressure (DBP) has been reported to increase the risk of developing AD 14 and mildly to moderately raised SBP to decrease the risk of incident AD. 15 Conflicting results are also reported from cross-sectional studies. Some find that hypertension 16 and blood pressure 17 are not associated with AD, others find that hypertension is associated with a lower prevalence of AD, 18,19 and yet others find that lower blood pressure is associated with a higher prevalence of AD. 20,21 These variable findings may result in part from the use of different definitions of hypertension and nonuniform measures of high or low blood pressure 16,20,21 or to disparate study designs.
Longitudinal and cross-sectional associations between late-life blood pressure and AD rarely are examined in the same study, so that it is difficult to determine whether the relationship between blood pressure and AD is similar for both study types. Moreover, some studies do not adjust for the presence of an apolipoprotein E (APOE)-ϵ4 allele, 15,22 an important risk factor for AD. 23 Previous work also varies with regard to the particular blood pressure measures used. Although hypertension, SBP, and DBP are frequently examined, pulse pressure (PP), the difference between SBP and DBP, and also an index of stiffness and atherosclerosis 24,25 are less often studied. Pulse pressure has been found to predict incident AD 26 and cognitive decline 27 in some studies but not others. 28,29 Mean arterial pressure (MAP), determined by cardiac output and vascular resistance, 4 serves as an index of cerebral perfusion 30 but rarely has been examined in relation to AD. 26
We examined 5 variables (hypertension, SBP, DBP, PP, and MAP) using both cross-sectional and longitudinal methods among participants enrolled in longitudinal studies of memory and aging at the Charles F. and Joanne Knight Alzheimer’s Disease Research Center (ADRC) to clarify their late-life associations, if any, with AD.
Materials and Methods
Participants
Data from participants enrolled in longitudinal studies of dementia and healthy aging at the ADRC between April 1990 and February 2005 were used. Participants are recruited from the greater St. Louis community for studies of “memory and aging.” Both nondemented and demented participants are evaluated for research purposes only and thus comprise a convenience sample of community-living volunteers. All participants were examined annually unless prevented by death, refusal, or relocation. Further details about the participants and the recruitment and assessment methods for these individuals have been published. 31
Evaluation
All procedures were approved by Washington University’s Human Subjects Committee and written informed consent was obtained from all participants and their collateral sources. At entry and at annual follow-up, experienced clinicians assessed each participant for the presence and severity of dementia based on semistructured interviews with the research participant and a knowledgeable collateral source (usually a spouse or adult child), followed by a neurological and physical examination of the participant. The assessment protocol evaluated cognitive problems that represented a decline from a former level of function for that individual and that interfered to at least some degree with the individual’s ability to carry out accustomed activities. The clinical diagnosis of AD was made in accordance with the standard criteria (Diagnostic and statistical Manual of Mental Disorders-Third Edition-Revised) [DSM-III-R] and 32 National Institute of Neurological and Communicative Disorders and Stroke and the Alzheimer’s Disease and Related Disorders Association [NINCDS-ADRDA] 33 ). The protocol included assignment of a Clinical Dementia Rating (CDR) 34 by the examining clinician. A CDR score of 0 indicates no dementia, and 0.5, 1, 2, and 3 indicate very mild, mild, moderate, and severe dementia, respectively. In our center, the clinical diagnosis of AD is confirmed pathologically in 93% of cases, 31,35 even when diagnosed at the CDR 0.5 level, the earliest symptomatic stage of AD. 36 The ascertainment of AD or of nondemented status for participants was based on their initial assessment for both of longitudinal and cross-sectional examinations.
The assessment protocol also included a health history, a depression inventory, an aphasia battery, and a medication inventory. 37 Nondemented participants, and the collateral sources of participants with dementia, were asked at each assessment whether the participant had ever been diagnosed with hypertension. Both SBP and DBP were measured once at each assessment, with the participant in the seated position. Measurements were taken at the right upper arm with an appropriately sized cuff and aneroid sphygmomanometer after the patient had been resting for approximately 15 minutes.
The operational definition of hypertension used in this study was a report of hypertension (S-HTN) from either the participant (if nondemented) or the collateral source at the first assessment for both of the longitudinal and the cross-sectional examinations. Pulse pressure was defined as the difference between SBP and DBP, and MAP as DBP + 1/3 PP. Apolipoprotein E genotyping was performed following a modification of the protocol developed by Pyrosequencer TM (http://www.pyrosequencing.com). Briefly, 10 ng of DNA was amplified in a 20-μL reaction volume in which deoxyguanosine triphosphat (dGTP) was replaced by a mixture of 25% dGTP and 75% deoxyinosine triphosphate (dITP) to facilitate the analysis of the GC-rich fragment. A 276-bp fragment was generated using the forward primer AGA CGC GGG CAC GGC TGT and the reversed Biotin-labeled primer CTC GCG GAT GGC GCT GAG. Single-stranded DNA prepared using streptavidin-coated beads and the APOE gene variants at codons 112 and 158 was pyrosequenced using the following primers and dispensation order: SNP112 GAC ATG GAG GAC GTG and SNP158 CCG ATG ACC TGC AGA and dispensation order GCTGAGCTAGCGT.
Statistical Analyses
Data analysis was performed using SPSS statistical software (Standard version 11.5.0; SPSS Inc, Chicago, IL, USA). All statistical tests were 2-tailed and an α of .05 was taken to indicate significance.
In the cross-sectional examination, t tests for independent groups were used to assess unadjusted differences between the AD and nondemented groups on the 4 continuous blood pressure measures: SBP, DBP, PP, and MAP. Chi-square test was used to test the comparability of the groups with regard to S-HTN. Multiple logistic regression models were fit to calculate odds ratios (ORs) and 95% confidence intervals (CIs) for the association between AD and each of the 5 blood pressure measures. The models adjusted for demographics and APOE genotype status.
In the longitudinal examination, Kaplan-Meier survival curves were employed to assess the relationship between hypertension and development of clinically diagnosed AD among participants who were nondemented at baseline. The log-rank test was used to test unadjusted differences between the survival curves. Duration of follow-up was defined in years, as time from the participant’s initial assessment to the first assessment with a clinical diagnosis of AD, or, to the date of the last assessment for individuals who never received a clinical diagnosis of AD. Age was defined as the age at first assessment, and data from individuals who did not develop clinically diagnosed AD during the follow-up period were censored on the date of their last assessment. Cox proportional hazard models without Bonferroni correction, adjusting for demographic and genetic variables, were used to test the effects of S-HTN and the other 4 blood pressure measures, SBP, DBP, PP, and MAP, on the time from baseline assessment to the first assessment with a clinical diagnosis of AD. Each blood pressure variable was tested in a separate model.
In both the cross-sectional and longitudinal examinations, demographic variables tested were age, gender, education, and race. Genetic variables were having at least 1APOE-ϵ2 (a putative protective factor for AD) and having at least 1 APOE-ϵ4 allele. Age, education, SBP, DBP, PP, and MAP were treated as continuous variables using 1-year increments for age and education and 1 mm Hg increments for all blood pressure measures. Gender, race, S-HTN, APOE-ϵ4, and APOE-ϵ2 status were treated as dichotomous categorical variables.
Results
Of the 2586 participants in the cross-sectional examination, 1768 individuals were clinically diagnosed with AD and 818 were nondemented (Table 1 ). Differences in age (P < .001), education (P < .001), race (African American [AA] vs Caucasian; P < .001), and the presence of the ϵ4 (P < .001) and ϵ2 (P < .001) allele of the APOE gene were found between the 2 groups. Among all participants, 955 individuals had a history of hypertension and 1360 did not. The percentage of individuals with hypertension was similar in the AD and nondemented groups (P = .164; Table 1). There were no unadjusted differences between the AD and nondemented groups on the 4 blood pressure measures: SBP (P = .811), DBP (P = .629), PP (P = .556), and MAP (P = .878; Table 1).
Baseline Characteristics of Participants in the Cross-Sectional Examination
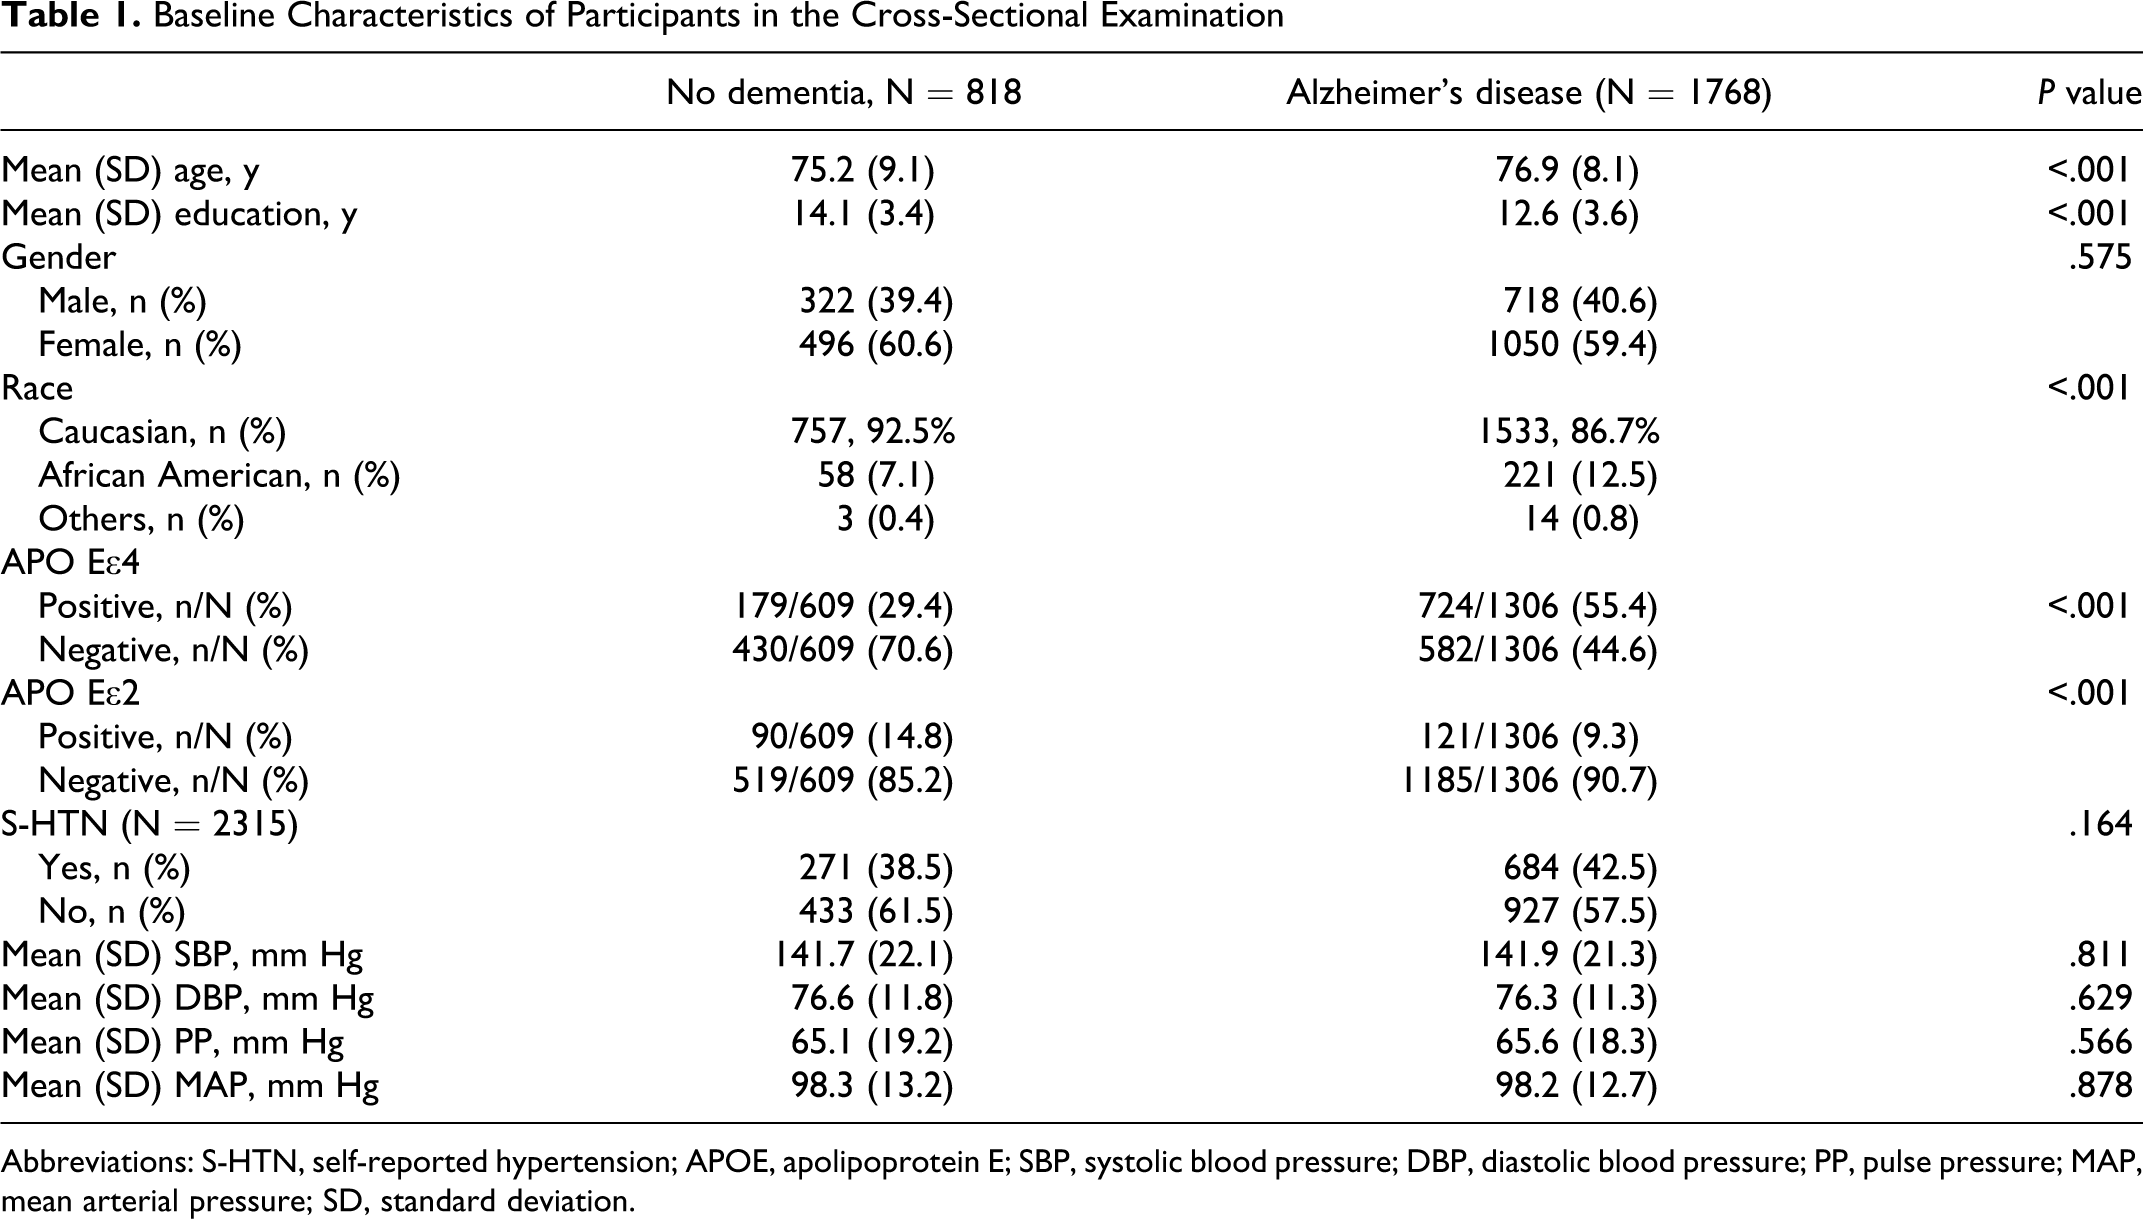
Abbreviations: S-HTN, self-reported hypertension; APOE, apolipoprotein E; SBP, systolic blood pressure; DBP, diastolic blood pressure; PP, pulse pressure; MAP, mean arterial pressure; SD, standard deviation.
After adjustment for other variables, there was no association between S-HTN nor any of blood pressure measures and AD (S-HTN: P = .236, OR = 0.87, 95% CI = 0.70-1.09; SBP: P = .095, OR = 1.00, 95% CI = 0.99-1.00; DBP: P = .429, OR = 1.00, 95% CI = 0.99-1.01; PP: P = .145, OR = 1.00, 95% CI = 0.99-1.00; MAP: P = .162, OR = 0.99, 95% CI = 0.99-1.00; Table 2 ).
Multiple Logistic Regression Models Testing the Relationship of the 5 BP Variables With the Likelihood of Having AD in the Cross-Sectional Examination
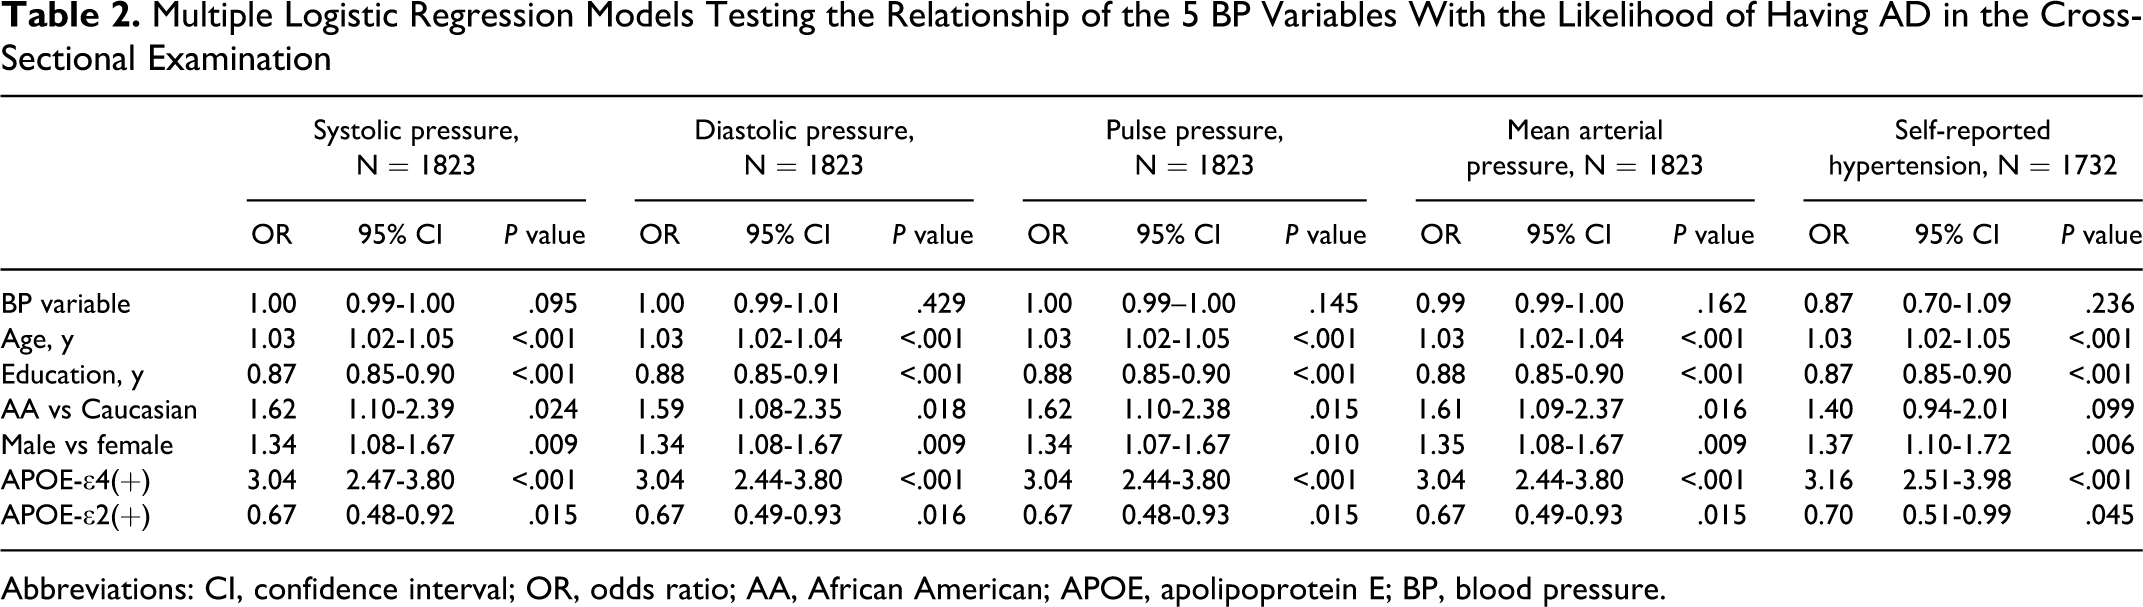
Abbreviations: CI, confidence interval; OR, odds ratio; AA, African American; APOE, apolipoprotein E; BP, blood pressure.
As shown in Table 2, each logistic regression model indicated that increased age (OR = 1.03, P < .001) and the presence of an APOE-ϵ4 allele (OR = 3.04-3.16, P < .001) were associated with AD. The adjusted analyses also indicated that the likelihood of having AD was less for individuals with higher educational levels (OR = 0.87-0.88, P < .001) and individuals with at least 1 APOE-ϵ2 allele (OR = 0.67-0.70, P = .015-.045). African Americans, compared with Caucasians, had a higher likelihood of having AD in the models testing each of the blood pressure measures (OR = 1.59-1.62, P = .016-.024), but not in the model testing S-HTN (OR = 1.40, P = .099; Table 2).
Data from 594 individuals, 171 with and 423 without hypertension, in the cross-sectional study, who were nondemented at initial assessment and had at least one follow-up assessment were used in the longitudinal examination (Table 3 ). The mean follow-up time was 6.7 ± 5.3 (95% CI = 6.2-7.1) years for all participants, 5.9 ± 4.9 (95% CI = 5.4-6.3) years for participants with a CDR score of 0 and 9.2 ± 5.6 (95% CI = 8.2-10.1) years for participants developing AD. In the Kaplan-Meier survival analysis, 159 individuals without and 58 individuals with S-HTN eventually developed AD. Mean survival time was 12.1 ± 0.6 years for individuals without S-HTN and 9.2 ± 0.9 years for those with S-HTN. The log-rank test of differences between these 2 groups in the rate of developing AD over time did reach the criterion for statistical significance (P = .043). Further investigation using Cox proportional hazards regression analysis indicated that S-HTN was not significantly associated with time to first diagnosis of AD (hazard ratio [HR] = 0.82, 95% CI = 0.58-1.15, P = .251) after controlling for the effects of gender, age, education, APOE gene status, and race (Table 4 ).
Baseline Characteristics of Participants in the Longitudinal Examination
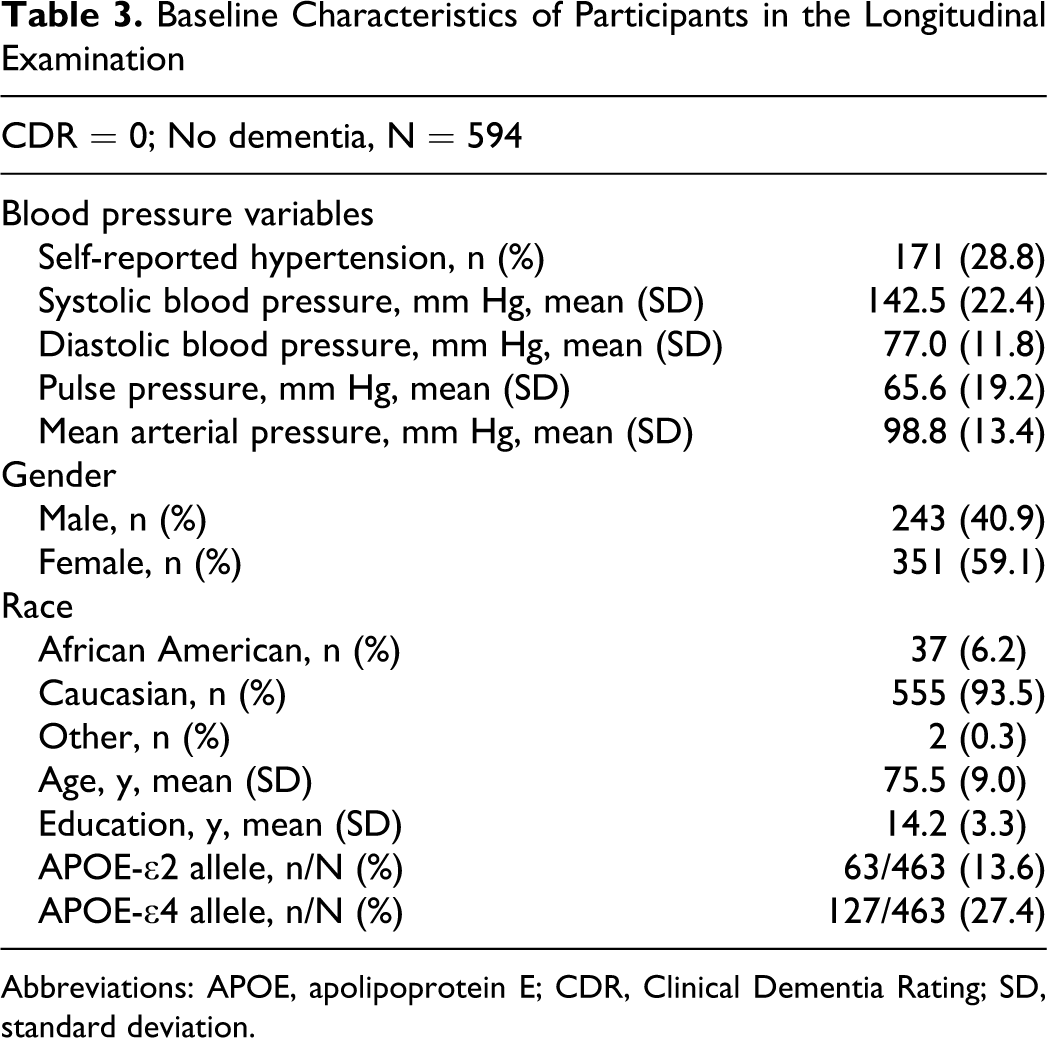
Abbreviations: APOE, apolipoprotein E; CDR, Clinical Dementia Rating; SD, standard deviation.
Cox Proportional Hazards Models Testing the Relationship Between Each of the BP Variables and Time to First Clinical AD Diagnosis
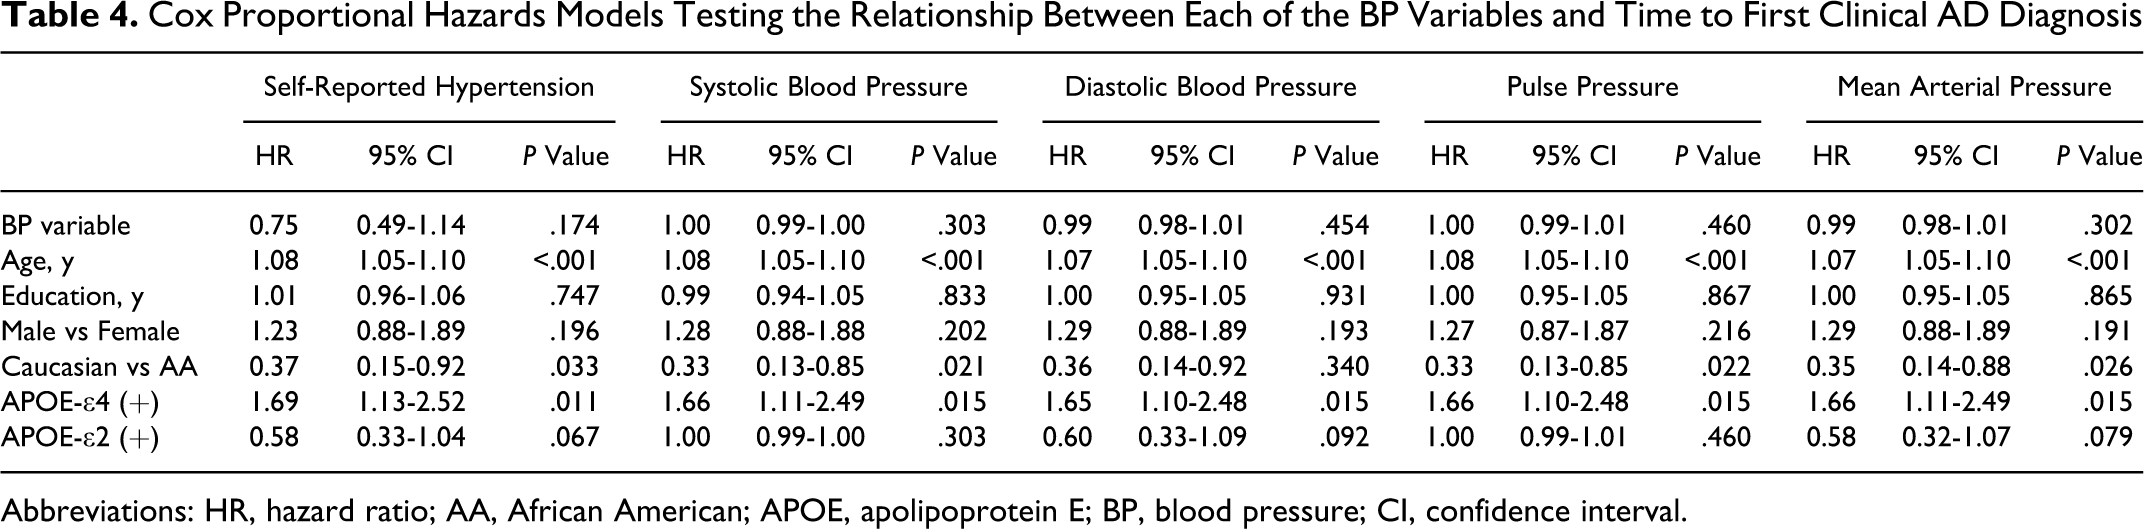
Abbreviations: HR, hazard ratio; AA, African American; APOE, apolipoprotein E; BP, blood pressure; CI, confidence interval.
When Cox proportional hazards models were used to examine the effects of each blood pressure measure on time to AD diagnosis, we found that DBP (HR = 0.98, 95% CI = 0.97-1.00, P = .030) was significantly associated with the development of AD, but not SBP (HR = 1.00, 95% CI = 0.99-1.00, P = .294), PP (HR = 1.00, 95% CI = 0.99-1.01, P = .919), and MAP (HR = 0.99, 95% CI = 0.98-1.00, P = .060; Table 4).
As expected, having at least 1 APOE-ϵ4 allele was associated with an increased rate of developing AD with time in all models (HR = 1.40-1.45; P = .030-.053), and older age at study entry increased the rate of receiving an AD diagnosis with time (HR = 1.06-1.08, P < .001; Table 4).
Discussion
We found that increased DBP was significantly associated with the decreased development of AD with time when examined longitudinally. Our findings are consistent with other longitudinal studies indicating that low DBP is related to the increased development of AD. 14,15,38 One explanation for a relationship between increased DBP and a slower rate of AD development is that increased DBP provides adequate cerebral perfusion to protect against changes in cerebral perfusion which commonly occur in older adulthood. In late life, low DBP and high SBP resulting from atherosclerosis during aging may lead to low cerebral perfusion, 39 which may contribute to the formation of senile plagues and neurofibrillary tangles. 5
The results of our cross-sectional examination are consistent with those of 2 other studies that found no association between hypertension and prevalent AD, 16,17 although several studies, using an arbitrary cutoff value for hypotension, 20,21 reported that low blood pressure was related to a high prevalence of AD. The differences in the association of hypertension and AD derived from our longitudinal versus cross-sectional analyses probably do not reflect participant differences as both samples were drawn from the same cohort.
Our study had several strengths. First, we comprehensively examined both longitudinal and cross-sectional associations between hypertension and AD. Second, because some information is lost when continuous variables are categorized, we treated all objective measures of blood pressure (SBP, DBP, PP, and MAP) as continuous variables in our analyses. Third, we also controlled for important variables, such as race and APOE genotype, and fourth, our diagnostic criteria for AD have been shown to be accurate and sensitive. 35,36
However, our study is not without limitations. Our participants were not randomly sampled from the community, and findings from the cross-sectional examination between hypertension and AD should be interpreted cautiously because of possible sampling bias. Moreover, a cross-sectional study is limited in determining the direction of association of hypertension and AD because such study evaluates the exposure and outcome simultaneously. We considered individuals to have hypertension or to have the diagnosis of AD, if they reported hypertension or were diagnosed AD at their first assessment but did not ascertain when the hypertension or the AD began. Accumulating evidence suggests that the age at which hypertension develops (or the amount of time an individual lives with hypertension) influences the relationship of hypertension to the development of AD. 40 Although longitudinal studies provide an opportunity to assess the temporal relationship between blood pressure and AD, the length of follow-up remains relevant, 40 as dementia may have a long prodromal period so longer lengths of follow-up could render individuals more vulnerable to comorbid conditions such as cerebrovascular disease that confer greater risk of AD. 9,10 As mentioned above, data on the age of onset of hypertension and years of living with the condition may be important in clarifying temporal relationship between hypertension and AD.
We also used a single measure of blood pressure obtained at the participant’s initial assessment. A single measurement of blood pressure may not accurately reflect the participant’s average blood pressure level. Finally, we did not examine the potentially modifying impact of antihypertensive therapy on the relationship between hypertension and AD. Some observational studies have suggested that antihypertensive treatment may protect against the development of AD among individuals with hypertension, 5,41 although confirmation of this relationship is limited because there have been few randomized studies. 40
Increased DBP in late life is independently associated with a slower time to development of AD in our sample. The association underscores the necessity of further investigation to outline the detailed mechanisms and biological relevance, if any, of late-life DBP to later AD.
Footnotes
The authors declared no potential conflicts of interest with respect to the research, authorship, and/or publication of this article.
The authors disclosed receipt of the following financial support for the research, authorship, and/or publication of this article: supported by the National Institute on Aging of the National Institutes of Health, Bethesda, MD (P01AG03991 and P50AG05681), and the Charles F. and Joanne Knight Alzheimer Research Initiative of the Washington University Alzheimer’s Disease Research Center.