
Abstract
We examined retrospectively the concurrent relationships between fasting plasma total cholesterol, triglycerides, and glucose levels, and Alzheimer’s disease (AD), in a clinical setting-based study. Total cholesterol level was higher in patients with AD compared to elderly controls; triglycerides or glucose levels did not significantly differ between the 2 groups. Respective plotted trajectories of change in cholesterol level across age were fairly parallel. No significant difference in total cholesterol levels was recorded between patients with AD classified by the Clinical Dementia Rating (CDR) score subgroups. These results suggest that patients with AD have relative mild total hypercholesterolemia, normal triglyceridemia, and normal fasting plasma glucose level. Mild total hypercholesterolemia seems to be permanent across age, and across dementia severity staging, and fairly parallels the trajectory of age-related change in total cholesterolemia of healthy controls. We speculate that these biochemical parameters pattern may be present long before—a decade at least—the symptomatic onset of the disease.
Keywords
Introduction
Alzheimer’s disease (AD) is a neurodegenerative disorder characterized by a progressive and irreversible deterioration of memory and cognition and is the leading cause of senile dementia. Currently, no known cure is available for this devastating disease. Cholesterol, lipids, insulin activity, and glucose metabolism abnormalities have been successively incriminated in the development of AD; important but varying results have been reported. 1 Few epidemiologic studies have examined the concurrent relation between fasting plasma total cholesterol (TC), triglycerides (TGs), and glucose levels, and AD.2–4 Moreover, plasma lipids and glucose concentrations are measured routinely in everyday practice with cheap, accurate, and noninvasive methods; these measurements may constitute a potential marker for many diseases, including AD and other dementias. In this context, using a retrospective study design, in a clinical setting-based population, plasma levels of these biologic parameters were evaluated in normal elderly participants and patients with AD for comparison. The relationship between these biologic parameters and dementia severity was also assessed.
Methods
Participants
A total of 150 medical charts from patients aged 55 years and older, from a private ambulatory of neurology, were selected as probable and possible AD according to Diagnostic and Statistical Manual of Mental Disorders (Thrid Third Edition Text Revision [DSM-III-TR])5,6 and the National Institute of Neurological and Communicative Disorders and Stroke–Alzheimer’s Disease and Related Disorders Association criteria (NINCDS-ADRDA) 7 ; out of the 325 medical charts from patients with diagnosis of dementia recruited in a community elderly, in Skikda area-Algeria, between 2002 and 2008. Dementia evaluations included neurological examination, neuropsychological assessment, a proxy interview, neuroimaging, blood tests, and consensus diagnoses.
Exclusion Criteria
Demented patients with history of previous stroke or transient ischemic attack, ischemic heart disease; permanent use of antihypertensive medication; history of or current use of lipid-lowering medication; previously diagnosed diabetes mellitus, or taking oral hypoglycemic agents or insulin, or with a fasting blood glucose level ≥126 mg/dL; and individuals with dementia not otherwise specified were excluded from this study.
Measures of fasting plasma levels of TC, TGs, and glucose were studied in participants with AD (n = 150) and in age-matched elderly controls (n = 320), recruited among healthy elderly participants under periodic health status screening, and elderly participants with other minor medical complaint, to whom the same exclusion criteria as participants with AD were applied. For the purpose of assessment of the plasmatic level of these biochemical parameters in healthy participants aged 35 to 94 years in this community sample, measures of these parameters in a separate third group of adult healthy individuals (n = 160), aged 35 years through 54 years, under periodic health status screening, were also collected between 2002 and 2008.
Relation between these biochemical laboratory parameters and the Washington University clinical dementia rating score—global Clinical Dementia Rating (CDR) score—was examined for the participants with AD. Assignment of a CDR score was derived from the score in each of the 6 categories (box scores)—memory, orientation, judgment and problem solving, community affairs, home and hobbies, and personal care; with no impairment = 0; questionable impairment = 0.5; mild impairment = 1; moderate impairment = 2; and severe impairment = 3. Memory was considered the primary category and all others were secondary. Of note, patients with a CDR score of 0.5 established by the time of their initial medical visit were included in this study (as CDR = 0.5) based on their conversion to CDR of 1 score during the medical follow-up.
Laboratory Tests
Blood samples were drawn usually in the morning after an overnight fast. Plasma levels of TC and TGs were determined using standardized enzymatic procedure in an automated spectrophotometer; plasma glucose concentration was determined by the glucose oxidase method.
Statistical Analysis
Patients with AD and control participants were compared on sociodemographic characteristics and clinical data (biochemical parameters) using t tests and χ2 tests where appropriate. Patients with AD and elderly controls classified by decennial age strata subgroups were compared with the t test, and the Mann-Whitney test. Correlation with the AD status was performed for plasma TC level. For the purpose of a logistic regression analysis, plasma TC level was dichotomized as high (≥190 mg/dL) or normal (<190 mg/dL) and all study participants grouped accordingly. This cut point was defined a priori based on the threshold recommendations for cardiovascular risk prevention (desirable TC level <200 mg/dL.) 8 and based on the mean TC level observed in our study controls; odds ratios were used to measure the degree of association in 2 × 2 tables. The odds ratio of AD was examined for the whole sample of study participants. We tested the relationships between the severity of dementia and biochemical parameters of interest, by performing linear regression analysis separately for each biochemical parameter as independent variable and CDR score as dependent variable, accounting for age and gender. Then patients with AD were classified by CDR score into 4 subgroups, which were compared using t tests and Mann-Whitney test where appropriate; and analyzed using 1-way analysis of variance (ANOVA) for multiple independent samples separately for each biochemical parameter, and its nonparametric alternative the Kruskal-Wallis test.
Results
Demographic data and the biochemical parameter values of individuals with AD (n = 150; 84 women, 56%) and elderly controls (n = 320; 160 women, 50%) are shown in Table 1. The mean ± standard deviation (SD) age of the patients with AD was 75.3 ± 7.7 years (range, 55-92 years) and 74.3 ± 11.6 years (range, 55-94 years) for the elderly controls (P = .34). There was no significant difference in mean age between genders, either for the participants with AD, 75.4 ± 8.0 vs 75.1 ± 7.5 years (men vs women; P = .81); or for controls 74.4 ± 11.6 vs 74.2 ± 11.5 years (men vs women; P = .90). In the AD group, mean symptomatic disease duration at the initial visit was 2.6 ± 1.8 years (range, 0.5-8 years); no significant difference between genders was observed (2.4 ± 1.7 vs 2.8 ± 1.9 years, men vs women; P = .25).
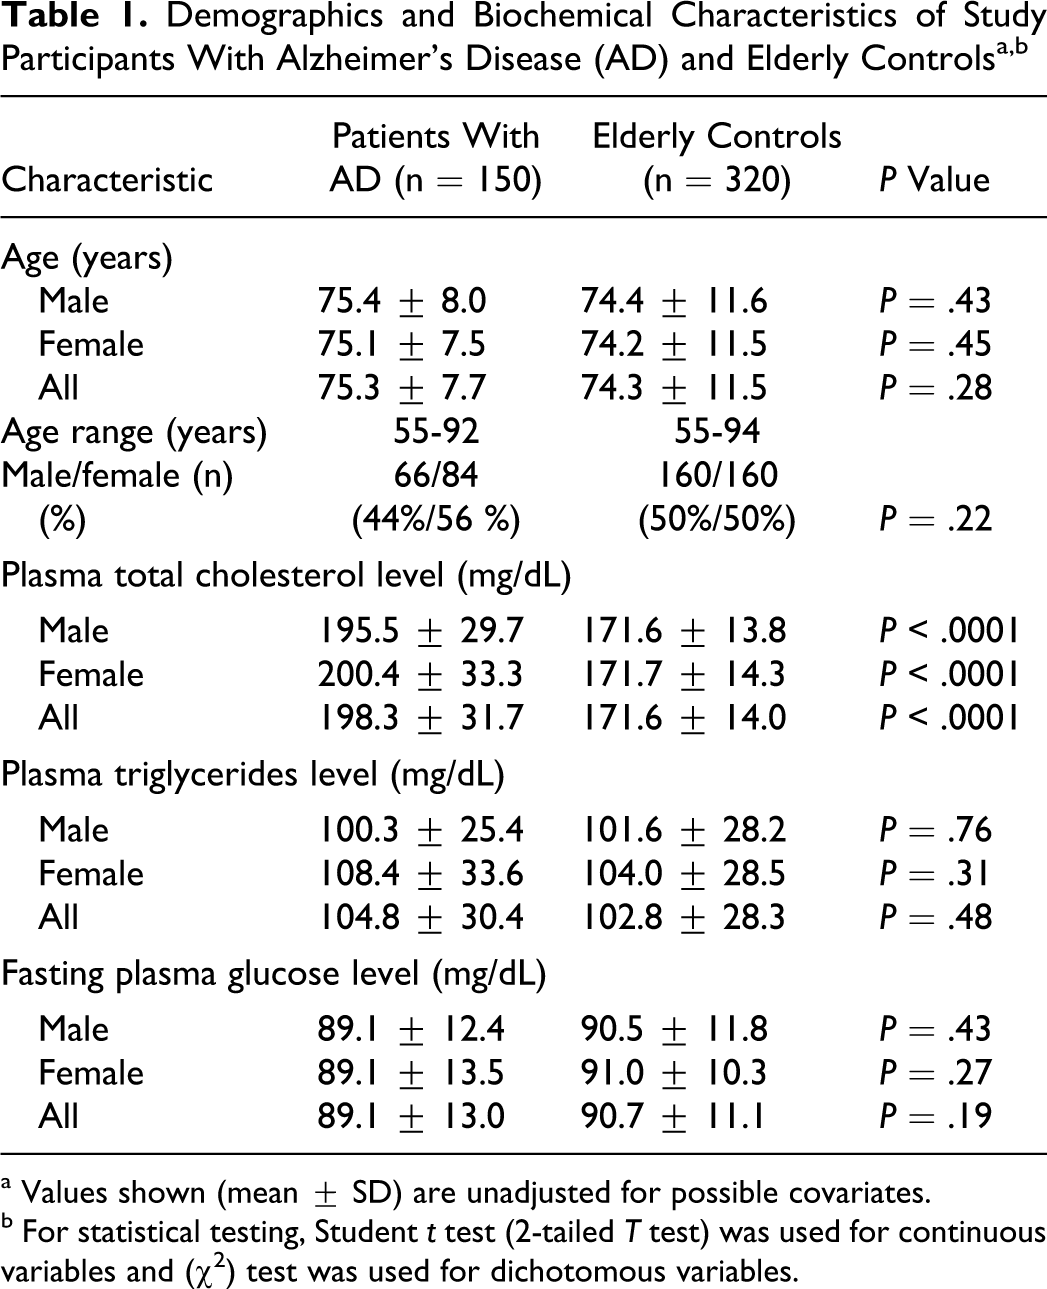
a Values shown (mean ± SD) are unadjusted for possible covariates.
b For statistical testing, Student t test (2-tailed T test) was used for continuous variables and (χ2) test was used for dichotomous variables.
Laboratory parameters were compared among the 2 groups. For the whole samples, the mean TC level was higher in patients with AD compared to the elderly controls group, 198.5 ± 31.7 vs 171.6 ± 14.0 mg/dL, respectively (P < .0001). No significant differences were recorded between mean TC levels of males and females in AD (P = .30), nor in elderly control group (P = .90). Mean TG levels did not significantly differ between patients with AD and elderly controls: 105.9 ± 37.1 vs 101.9 ± 33.6 mg/dL, respectively (P = .24). There was no significant difference in mean glucose level between the 2 groups: 88.9 ± 13.2 vs 90.2 ± 12.4 mg/dL (AD group vs controls; P = .32). No significant differences were recorded between TGs and glucose levels of males and females in any group. When classified by decennial age strata, higher mean TC levels in patients with AD compared with control participants were observed across all decennial age subgroups—55 to 64 years: 204.9 ± 43.4 vs 175.4 ± 17.7 mg/dL (P < .0001); 65 to 74 years: 202.0 ± 32.4 vs 172.8 ± 13.6 mg/dL (P < .0001); 75 to 84 years: 199.8 ± 33.2 vs169.5 ± 15 mg/dL (P < .0001); and 85 to 94 years: 182.4 ± 21.4 vs 165.4 ± 11.8 mg/dL (P < .0001). Respective plotted trajectories of change in TC levels across age for the 2 groups were parallel, with a slight increase from age 55 through 64/69 years (men/women), followed by a gradual decline afterward (Figure 1 ). No significant differences were found for TGs or glucose levels, between patients with AD and elderly controls across all decennial age subgroups.
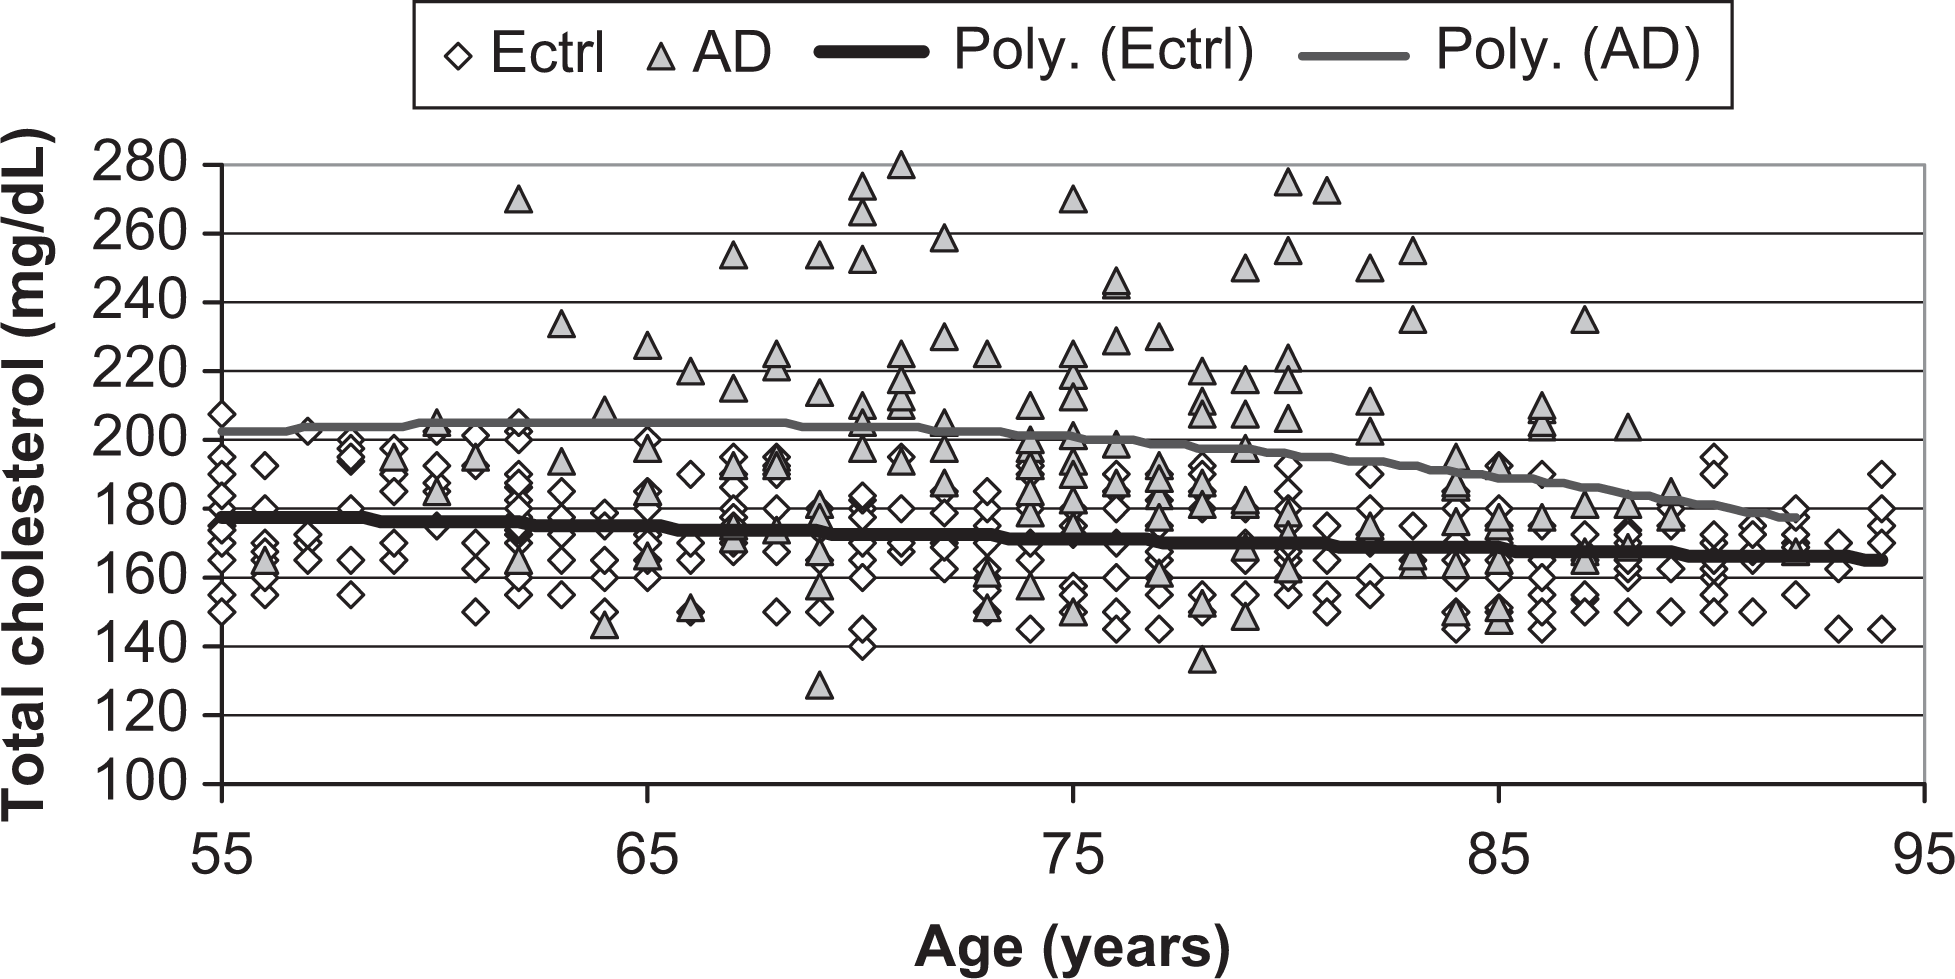
Scatter plots and polynomial trajectories of change in serum total cholesterol levels across age, for participants with Alzheimer’s disease, ([AD] [filled triangles, upper thin line]) and for elderly controls ([Ectrl] [open diamonds, lower thick line]).
When the plasma TC level was dichotomized as “high” (≥190 mg/dL) or “normal” (<190 mg/dL) and all study participants grouped accordingly, the odds ratio (95% confidence interval) of AD for the high TC level compared to the normal TC level was 7.777 (4.955-12.208; P < .0001).
Evaluation of the relation between biochemical parameters and dementia staging
Table 2 shows the demographics and the biochemical parameters of participants with AD, classified by the CDR score subgroups according to their CDR score. For the combined male and female participants with AD, we did not find significant difference in mean TC levels, between the patients classified as CDR = 0.5 subgroup: 196.9 ± 35.4 mg/dL; CDR = 1 subgroup: 206.4 ± 34.6 mg/dL; CDR = 2 subgroup: 197.6 ± 30.5 mg/dL; and CDR = 3 subgroup: 189.6 ± 33.6 mg/dL; (1-way ANOVA, F = 1.11; P = .34; Kruskal-Wallis test, H = 3.47, df = 3; P = .32). There were no significant differences in TG levels between all CDR subgroups, except for CDR = 3 subgroup whose mean TG level was slightly lower than CDR = 1 subgroup (P = .01) and than CDR = 2 subgroup (P = .04). Mean FPG levels did not significantly differ between all CDR subgroups, except between CDR = 0.5 and CDR = 1 subgroups (P = .01; Figure 2 ). By gender, no significant difference was recorded between CDR subgroups for all 3 studied biochemical parameters, except for mean glucose levels between CDR = 0.5 and CDR = 1 subgroups in men (P = .04) and for mean TG levels between CDR = 1 and CDR = 3 subgroups in women (P = .04). There were a high positive correlation between CDR score and age, r = .398; t = 5.277, df 148; P < .0001; and a marginally significant negative correlation between CDR score and TG levels, r = −.162; t = −1.997, df = 148; P = .047. A negative correlation between CDR and TC level was observed, but it was not statistically significant, r = −.104; t = −1.272, df = 148; P < .2; CDR score did not correlate with glucose level, r = .014, P = .86.
Mean (± SD) Fasting Plasma Total Cholesterol, Triglycerides, and Glucose Levels, of Study Participants With Alzheimer’s Disease Classified by the CDR Score Subgroups, Comparison Between CDR Score Subgroupsa
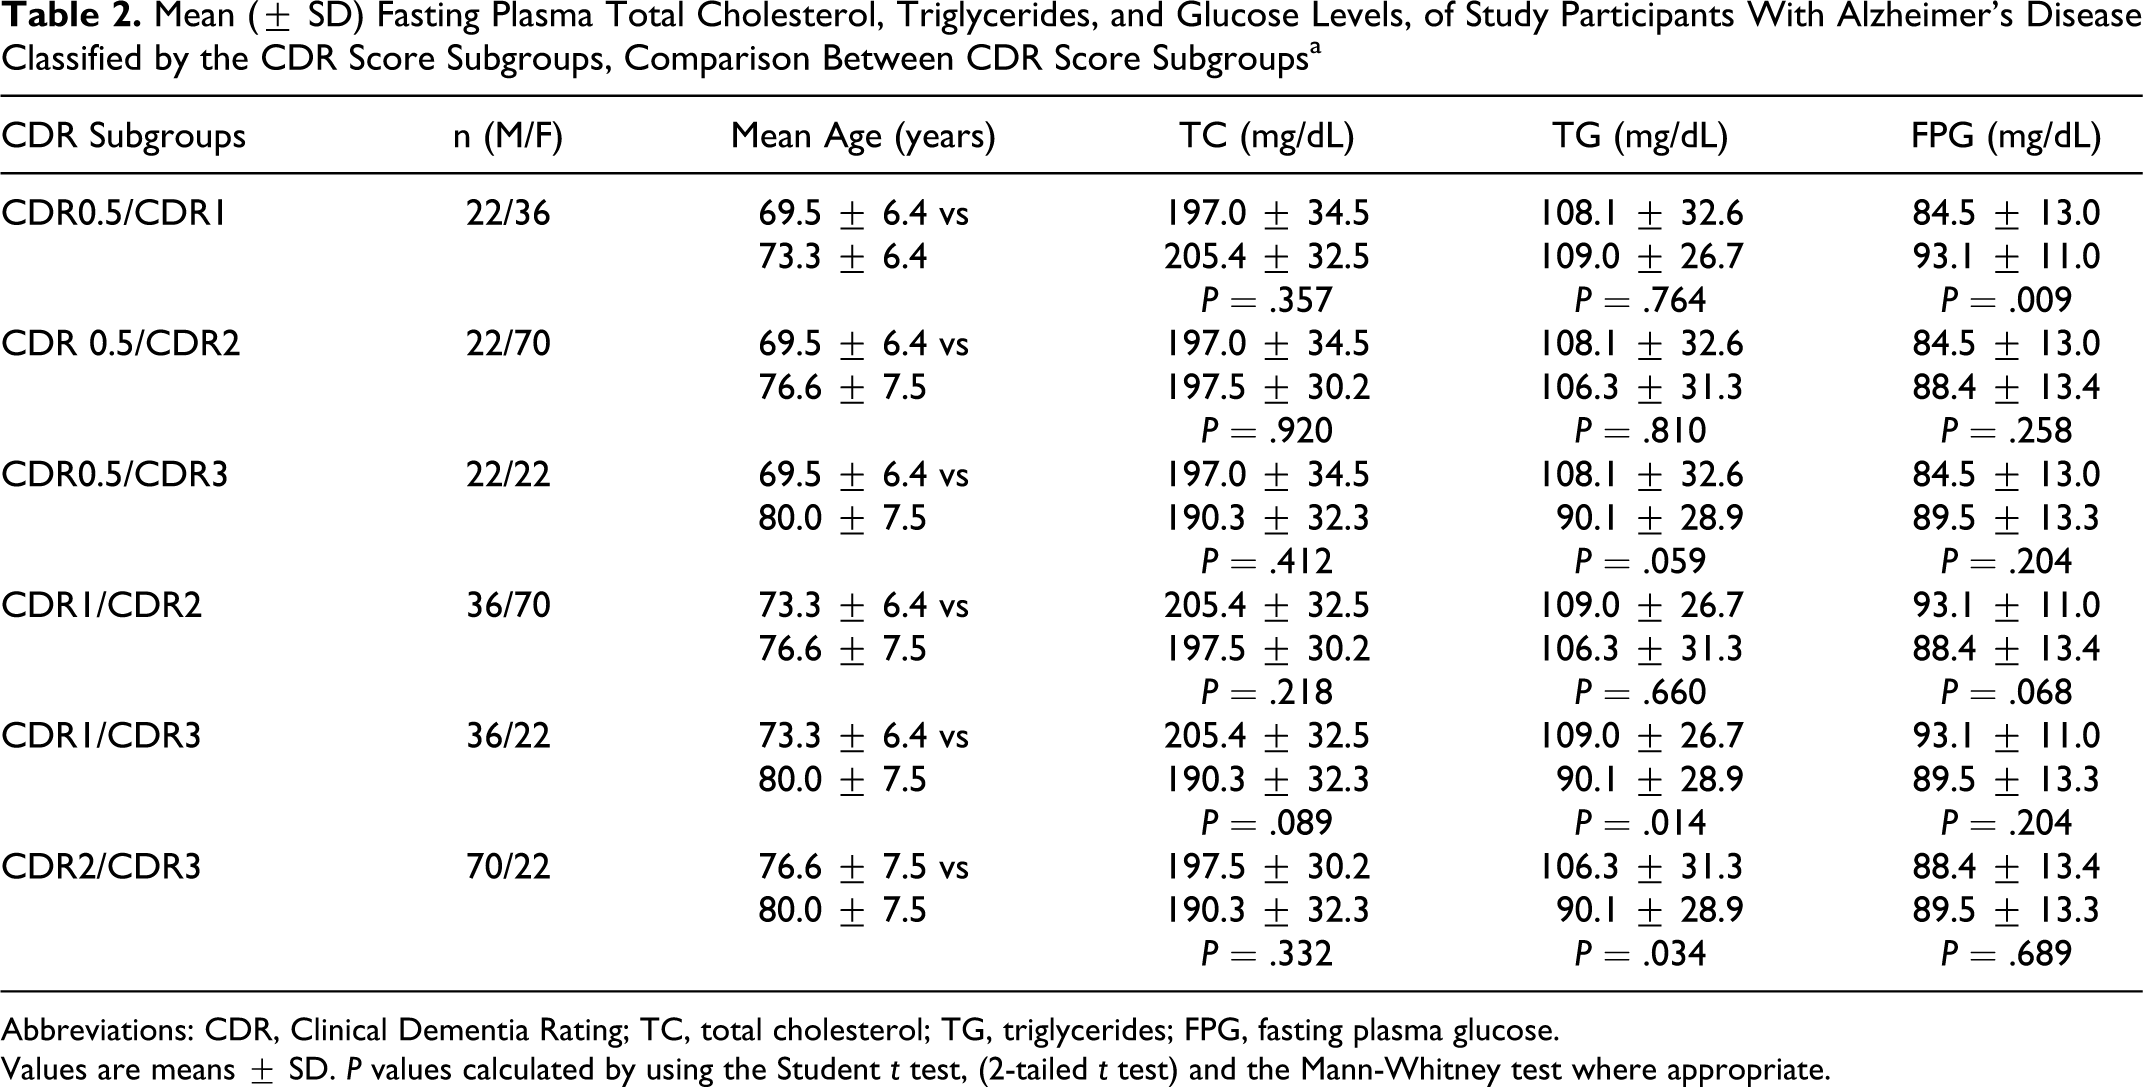
Abbreviations: CDR, Clinical Dementia Rating; TC, total cholesterol; TG, triglycerides; FPG, fasting plasma glucose.
Values are means ± SD. P values calculated by using the Student t test, (2-tailed t test) and the Mann-Whitney test where appropriate.
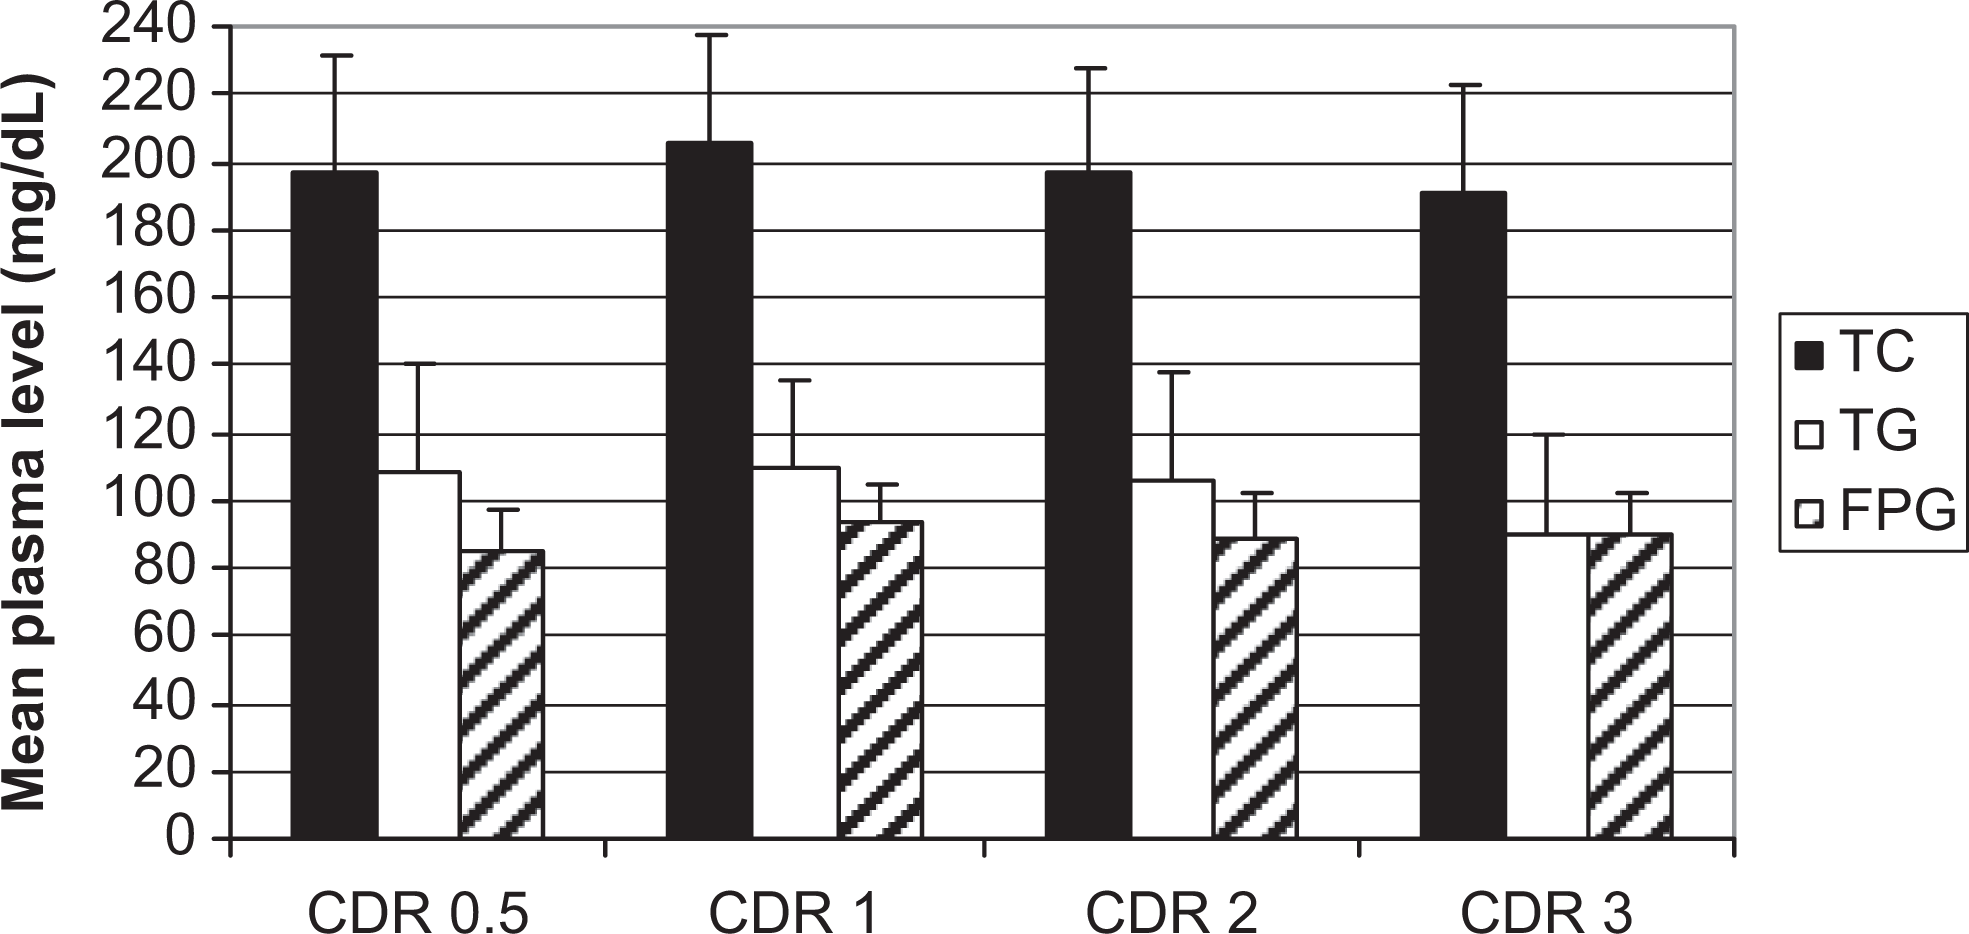
Mean (± SD) of serum total cholesterol (black columns), plasma TGs (white columns), and fasting plasma glucose (upward diagonal pattern columns) levels across CDR score subgroups, in participants with Alzheimer’s disease. No significant differences recorded between CDR subgroups for all 3 studied biochemical parameters; except for TGs between CDR1 and CDR3 subgroups (P = .01) and between CDR2 and CDR3 subgroups (P =.04).
Trajectories of cholesterol level change across age for the combined healthy adults and elderly controls vs the patients with AD (Figure 3 ): Plasma TC, TG, and glucose levels in healthy adults aged 35 to 54 years (n = 160; 80 women), recruited from the same community, between 2002 and 2008, were evaluated (data not shown). Mean TC levels by decennial age strata were as follows: 35 to 44 years: 169.6 ± 18.1 mg/dL; and 45 to 54 years: 169.9 ± 19.7 mg/dL; no difference was observed between genders. Again, the plotted trajectories of changes in TC level across age for patients with AD and that of combined healthy adults (35-54 years) and elderly controls (55-94 years) showed a plateau phase of relatively stable TC level that seems to be present across the full age span of healthy adults (35-54 years), followed by the parallel increase in TC level, from age 55 through age 64/69 years (men/women), and a gradual decrement later (already described above in Figure 1).
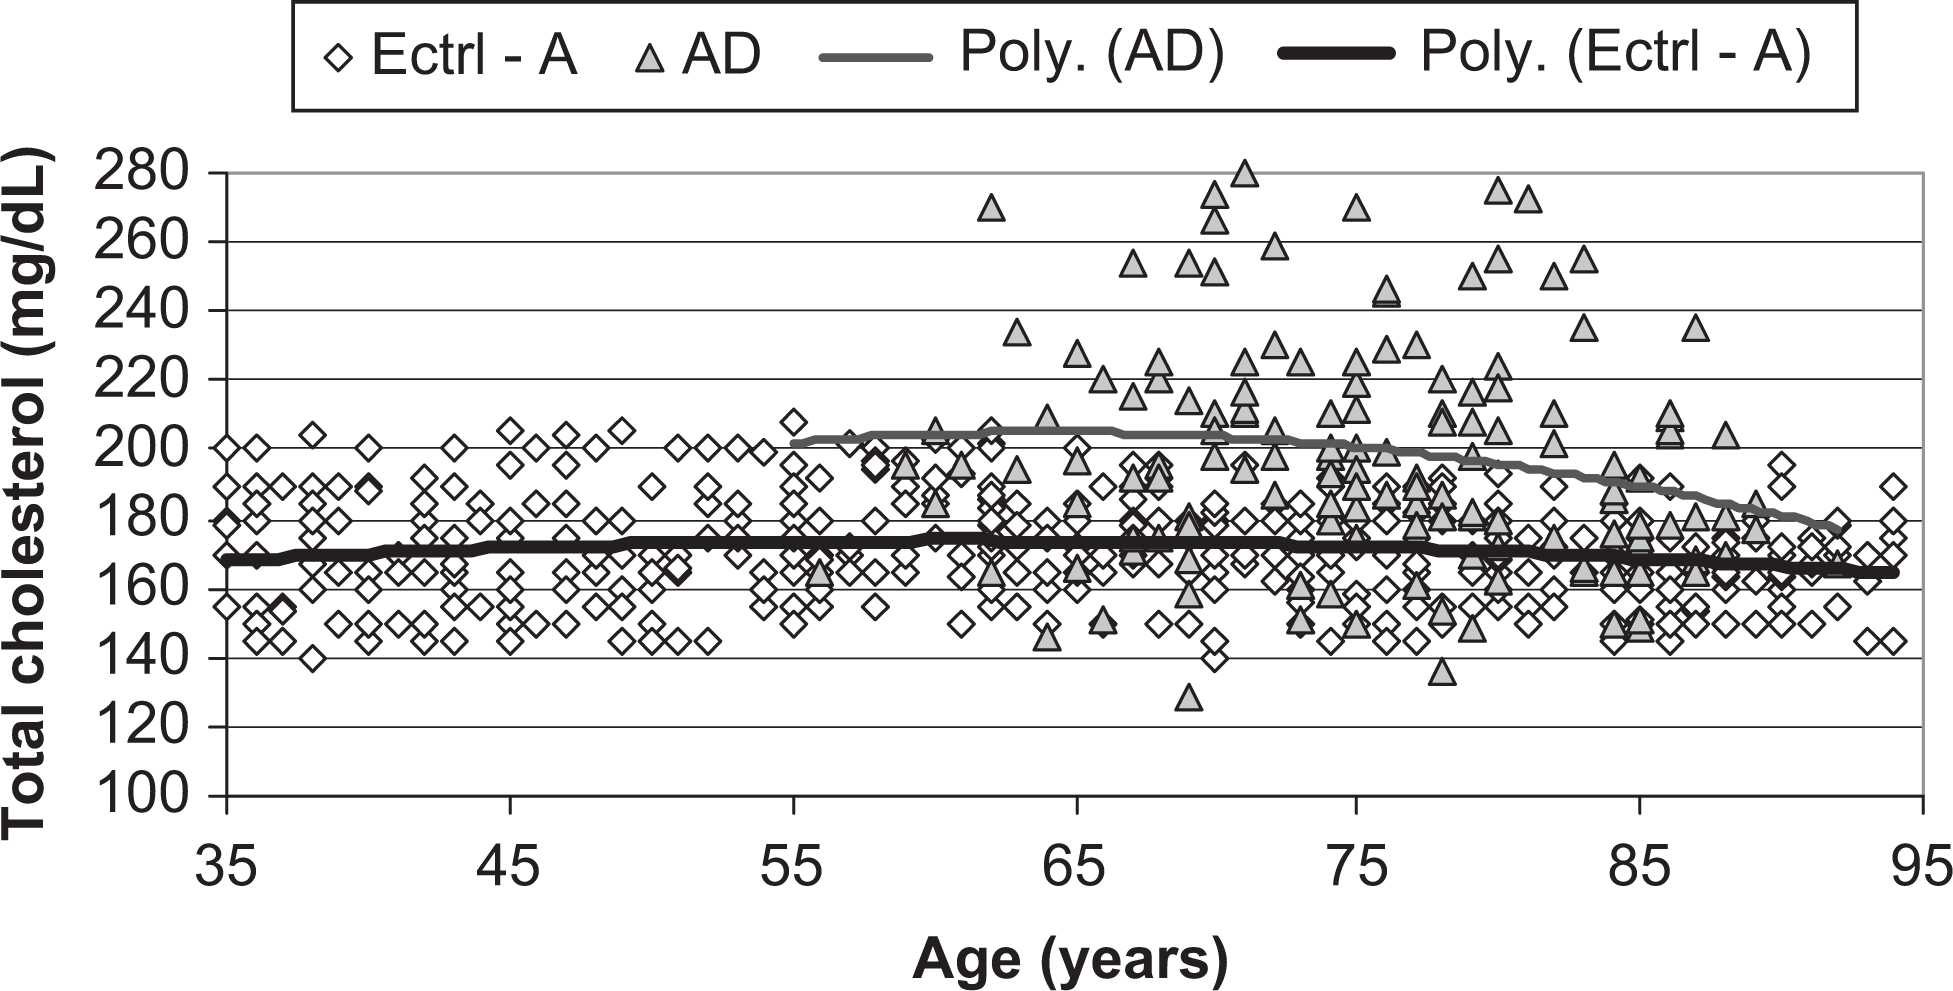
Scatter plots and polynomial trajectories of change in plasma total cholesterol levels across age, for patients with AD ([AD] [filled triangles, upper thin line]) and for the combined healthy adults and elderly controls ([Ectrl-A] [open diamonds, lower thick line]).
Discussion
In this study, we found that plasma TC was significantly higher in the patients with AD compared to the elderly controls, among both men and women and across age. Further, mean TGs and mean glucose levels did not differ significantly between the 2 groups. Studies that have assessed the concurrent relation between plasma TC, TGs, and glucose levels, and AD are sparse; moreover, study designs differ, which does not allow comparison.2–4 By contrast, with regard to cholesterol level and AD risk association, large epidemiological studies have investigated this relationship and yielded varying results. Some long-term epidemiologic studies found association between higher midlife serum TC level and increased risk of AD 2 to 3 decades later9–14; this association is also supported by 3 autopsy studies.15–17 On the contrary, other studies found association between lower TC level and incident AD.3,18 While 1 longitudinal study reported that high TC level in late life was associated with a decreased risk of dementia and AD, 19 whereas others found no association, or no consistent relationship between the serum TC levels and the risk of AD.20–23 These discrepancies persisted among studies with long-term follow-up and serial assessments of cholesterol. In the Framingham community-based cohort study, no association between the risk of AD and TC measured at different times, including measurements 10 to 40 years before the onset of dementia, was observed. 20 The Honolulu-Asia Aging Study compared the natural history of change in TC across 26 years between men who did and did not develop dementia 3 years after the last measurement, and the slope of 26-year change in serum TC levels was estimated by a repeated-measures analysis, cholesterol levels in men with AD had declined at least 15 years before the diagnosis and remained lower than cholesterol levels in men without dementia throughout that period. 18 The Cardiovascular risk factors, Aging, and Dementia (CAIDE) study investigated changes in serum TC from midlife to late life and their relationship with late-life cognition, with an average follow-up of 21 years; the authors concluded that high midlife serum TC is a risk factor for subsequent AD, but decreasing serum TC after midlife may reflect ongoing disease processes and may represent a risk marker for late-life cognitive impairment. 13 The data reported by the Prospective Population Study of Women in Gothenburg, Sweden, with a 32-year follow-up suggested that the midlife cholesterol level is not associated with an increased risk of AD, and that declining cholesterol levels from midlife to late life may better predict AD risk than levels obtained at 1 time point prior to dementia onset. 24 In a longitudinal cohort study conducted in the Northern Manhattan, New York, the authors reported that high-density lipoprotein cholesterol levels in elderly individuals may be associated with a decreased risk of AD; and in addition, higher levels of TC were associated with a decreased risk of AD in the analyses adjusting for age, sex, education, ethnic group, and APOE e4 genotype. 25
With regard to TG levels and AD risk association, at present there are insufficient data from specifically designed studies assessing this relation. In our study, TG levels in patients with AD and in elderly controls did not significantly differ, which is concordant with the finding of other studies reporting no association between plasma TG levels and AD risk.3,12,22,23,26–28 Mean FPG level of the patients with AD was not significantly different from that of elderly controls. This result is somewhat expected if one takes into account that all demented individuals with diabetes were excluded from the present study, which is designed specifically to assess demented patient with the so-called pure AD.
Mean TC levels observed in our study were lower compared to those reported in other population studies,11,19,21 but nearly similar to those reported in African population studies. 12 Other population-based studies in Algeria, likewise, have reported low TC levels.29,30 Thus, in our study, higher mean TC level of AD patients could be regarded a relative mild hypercholesterolemia, as compared to mean TC level of elderly control participants. Furthermore, several cross-sectional and longitudinal studies of change in cholesterol level across age have shown that TC tends to increase with age in apparently healthy young or middle-aged adults, but later decreases as the individuals get older.31–34 In our study, the plotted trajectories of change in TC levels across age for the combined sample of healthy adults and elderly control groups, and for patients with AD, were parallel with a slight increase from 55 years through age 65/69 years (men/women), followed by gradual decrement afterward.
Interestingly, we did not find statistically significant difference in TC level between CDR subgroups; thus, in our AD patients, mild hypercholesterolemia seems to be constantly present across dementia severity staging until the late stage of the disease. On the other hand, we observed a marginally significant negative correlation between CDR and TGs level for the entire AD sample, which failed to reach statistical significance when analyzed by gender. Although, severely demented patients had significant lower TG levels compared to mild or moderate cases for the whole AD sample; again, this difference was significant among women but not among men. Data on this topic are also sparse; 2 studies reported no correlation between the Mini-Mental State Examination score and the lipid parameters.35,36
In sum, our findings add controversy to the still debated link between cholesterol and AD and put forward questions about the significance of the permanent mild hypercholesterolemia recorded in patients with AD, which is present across age and across disease severity staging, and displaying a slope of change across age that seems parallel to that of the combined healthy adults and elderly controls (35-94 years) total cholesterolemia. This observation suggests by extrapolation that the mild total hypercholesterolemia may be present long before the symptomatic stage of the disease. Although derived from an exploratory approach study—implicating many limitations—we believe that these data could be of great interest and deserve further studies. In conclusion, these results suggest that patients with AD have mild total hypercholesterolemia, normal fasting plasma TG, and normal plasma glucose levels. The mild total hypercholesterolemia seems to be permanent across age, does not change significantly across dementia severity staging, until the late stage of the disease and fairly parallels the trajectory of changes in total cholesterolemia of healthy controls, that is in this study slight increase from age 55 through 64 years in men and 69 years in women, followed by gradual and progressive decline afterward. By extrapolation, we also speculate that the pattern of this biochemical parameters may be present long before (a decade at least) the symptomatic onset of the disease.
Footnotes
Acknowledgments
The authors thank Dr Alioua K (Department of Public Health Prevention, General Hospital of Skikda, Algeria), Dr Nezzal A and Dr Tourab D (University School of medicine of Annaba, Algeria) for help with statistical questions. Akkef Y, Gueddah A, Hmimasse T, Ramdane A, Ramdane M, Ramdane T, and Sekkache R, for their helpful technical assistance. Special thanks to my brother Salim Ramdane and his family.
The author(s) declared no potential conflicts of interest with respect to the research, authorship, and/or publication of this article.
The author(s) received no financial support for the research, authorship, and/or publication of this article.