
Abstract
The pathogenesis of hepatocellular carcinoma is complex and not fully known yet. This study aims to screen and identify the differentially expressed proteins in peripheral blood and liver tissue samples from rat hepatocellular carcinoma and to further clarify the pathogenesis and discover the specific tumor markers and molecular targets of hepatocellular carcinoma. The hepatocellular carcinoma model of Wistar rats were induced by chemical carcinogen. The serum and liver tissue samples were obtained after induction for 2, 4, 8, 14, 18, and 21 weeks. The results showed that the clusterin (IPI00198667), heat shock protein a8 (IPI00208205), and N-myc downstream-regulated gene-2 (IPI00382069) being closely related to hepatocarcinogenesis were eventually identified from the 30 different proteins. As the time progressed, the serum levels of clusterin and heat shock protein a8 increased gradually during induced liver cancer in rats. However, the serum N-myc downstream-regulated gene 2 level in induced liver cancer in rats underwent biphasic changes, and the serum N-myc downstream-regulated gene 2 level decreased at the 8th week, increased at the 14th week, and then decreased significantly. Statistical difference occurred in protein expression of clusterin and heat shock protein a8 in liver tissues at the different time points. In the liver tissues, the N-myc downstream-regulated gene 2 level decreased gradually at the 8th week, increased gradually at the 14th week, and then decreased significantly after 14 weeks. The study demonstrated that heat shock protein a8, clusterin, and N-myc downstream-regulated gene 2 participated in the process of abnormal cell division, proliferation, and carcinogenesis of liver cells during hepatocarcinogenesis.
Introduction
Hepatocellular carcinoma (HCC) is one of the common malignant tumors. Each year about 750 000 patients have HCC worldwide, and 600 000 patients die of liver cancer. The mortality of HCC ranks second in the malignant tumors, and it seriously threatens health of humans. 1 Fifty-five percent of new HCC cases occur in China every year, and mortality due to HCC ranks second among various cancersin China and is only second to lung cancer. 2 The pathogenesis of HCC is complex and related to environmental and genetic factors. It involves hepatitis B or (and) C virus infection, aflatoxin-contaminated food or water, carcinogens such as nitrosamines, butter yellow, chloroform, parasitic infections, and so on. The occurrence, hyperplasia, carcinogenesis, and metastasis of HCC involve in multiple genes and proteins. It is a more complicated process involving multiple factors and steps synergy. Proteomics is performed to obtain the peptide and protein sequences of serum, tissues, or cells using protein mass spectrometry. 3 The 2-dimensional gel electrophoresis map and protein database were analyzed and constructed to screen and identify the differential proteins to establish the proteomic database by bioinformatics. 4 Using SWISS-PROT and TrEMBL databases, the differential protein peaks were compared to proteins with equal length or mass charge ratio to obtain the length range of proteins, then search differential protein peaks that are nearest, and identify related proteins. 5 Differential proteomics can compare the number, location, and modification of protein expression of tissues and cells in normal and pathological states and find the specific proteins associated with the pathological status or disease. Differential proteomics is of great value in studying the pathogenesis of malignant tumors, searching for the diagnostic markers of malignant tumors, and screening the metastasis-associated proteins and molecular-targeted drugs. 6 The proteomics and its related technology are used to study the protein expression profiles of HCC occurrence and development; it is not only beneficial for screening the tumor-specific markers of HCC but also for determining the therapeutic targets for HCC, improving the early diagnosis and therapeutic effect of HCC. Paradis et al 7 analyzed the serum of 82 patients with liver cirrhosis (44 cases of liver cancer among the patients) by surface-enhanced laser desorption/ionization-time of flight-mass spectrometry. The results showed that 30 differential protein peaks associated with HCC and cirrhosis were identified. The 6 peaks of the highest score were used to diagnose HCC, and the diagnostic accordance rate was over 90%. Among them, 3 peaks were the C-terminal part of the V10 fragment of vitronectin, which were considered as potential markers for early screening and diagnosis of HCC. Hu et al 8 compared the proteins of hepatitis B virus-infected HCC tissues and adjacent non-HCC tissues in 9 groups and identified the 222 differentially expressed proteins. Further studies indicated that reducing the expression of glucose-6-phosphate dehydrogenase could reduce the metastasis and recurrence rate of HCC. This present study aims to screen and identify the differentially expressed proteins in peripheral blood and liver tissue samples from rat HCC induced by diethyl nitrosamine using 2-dimensional gel electrophoresis and tandem time-of-flight mass spectrometry techniques at different time points. The level of the differential proteins in peripheral blood and liver tissue is detected using enzyme-linked immunosorbent assay (ELISA) and Western blotting techniques; the location of the differential proteins in liver tissues is detected using immunohistochemical technique. This study has important biological significance for further understanding the pathogenesis of HCC and finding specific tumor markers and molecular targets of HCC.
Materials and Methods
Reagents
Diethyl nitrosamine, Proteo-Prep Immunoaffinity Albumin and IgG Depletion Kit, thiourea, dithiothreitol, iodine acetamide, sodium thiosulfate, and 2-dimensional gel electrophoresis standard protein were purchased from Sigma Company. Solid phase pH gradient dry strip (IPC strip pH 3-10 L, and 24 cm), interpublic buffer (pH : 3-10), ampholytes (pharmalyte, pH 3-10), low-molecular-weight protein, protein silver dye kits, urea, propylene phthalein amine, double propylene phthalein methylene amine, glycerin, glycine, nonidet P-40, 3-hydroxymethyl aminomethane, 3-[(3-bravery acyl amino propyl) dimethyl amine] propyl sulfonate, phenylmethylsulfonyl fluoride, Triton X-100, sodium dodecyl sulfate (SDS), EDTA, and filter column were purchased from Amershma Bioseiences Company. IPGhor isoelectric focusing (GE Healthcare), DALT-6 sodium dodecyl sulfate-polyacrylamide gel electropheresis (SDS-PAGE) electrophoresis apparatus, ImageScanner scanner, ImageMaster 2d Platinum 7.0 analysis software were purchased from GE Healthcare Company. ABI4800 tandem time-of-flight mass spectrometer (MALDI-TOF/TOF) is purchased from America ABI Co LTD. The primary and second antibodies of clusterin, NDRG2, and HSPa8 are purchased from Santa Cruz biotechnology Co, Ltd.
Rats and Grouping
Six-week-old male Wistar rats, weighing from 140 to 160 g, were provided by the Shanghai Laboratory Animal Center (Chinese academy of sciences, license SCXK Shanghai 2003-0003).All rats were quarantined for 1 week before the start of the experiment. They were housed in an animal facility maintained on a 12-hour light–dark cycle, at a constant temperature of 23°C ± 1°C and a relative humidity of 44% ± 5% and were given free access to tap water and food. The rats were randomly divided into the control group and the induced cancer group according to the experiment design. Each group had 10 Wistar rats. The experimental protocols were reviewed and approved by the Committee of Ethics on Animal Experiments of the animal facility, and all the animal work procedures were approved by the Institutional Animal Care and Use Committee of Shanghai University of Traditional Chinese Medicine.
Establishment of Rat HCC Model
The rats in the induced cancer group were fed with standard fodder and diethylnitrosamine (DENA) water (DENA content, 0.05 g/L) for 2 weeks; then DENA water (DENA content, 0.05 g/L) was changed into DENA water (DENA content, 0.1 g/L) for 8 weeks, and later DENA water (DENA content, 0.1 g/L) was changed into normal drinking water after 10 weeks. 37 The Wistar rats in the control group were fed with standard fodder and normal drinking water. The experimental protocols were reviewed and approved by the Committee of Ethics on Animal Experiments of the animal facility, and all the animal work procedures were approved by the Institutional Animal Care and Use Committee of Shanghai University of Traditional Chinese Medicine.
Acquirement of Serum and Tissue Samples
After all rats were killed by ether, 2 mL venous blood from inferior vena cava, liver tissues, and tumor tissues were, respectively, were acquired from Wistar rats in the control group and the induced cancer group before and after induction for 2, 4, 8, 14, 18, and 21 weeks. Ten rats were killed at the indicated time. Liver and tumor tissues were, respectively, dehydrated at different concentration of ethanol and embedded with paraffin, and then 4-µm slice was prepared to be stained with hematoxylin–eosin dye for pathological examination. The samples of serum, liver tissues, and tumor tissues were, respectively, frozen at is −80°C for protein mass spectrometry analysis and identification.
Histopathological Examination of Liver Tissues in Induced Liver Cancer
Paraffin slices of liver tissue in each group at the different time points were processed with xylene clearing, ethanol dehydration, hematoxylin–eosin staining, ethanol dehydration, xylene clearing, and neutral gum mounting step by step, and then the pathological changes were observed under a microscope.
Removal of Serum High-Abundant Proteins
Filter column with balance fluid was centrifuged at the speed of 8000 rpm for 10 seconds at room temprature, and the balance fluid was removed from filter column. After the procedure was repeated 3 times, 40 µL of balance fluid and 60 µL of serum in each group were added into the upper part of filter column, incubated at 20°C for 10 minutes, and then centrifuged at 10 000 rpm for 60 seconds. The filtered fluid was added into the upper part of filter column, incubated at 20°C for 10 minutes, and then centrifuged at 10 000 rpm for 60 seconds. A total of 125 µL of balance fluid was added into the upper part of filter column, centrifuged at 10 000 rpm for 60 seconds, and then the filter fluid was, respectively, frozen at −80°C for protein mass spectrometry analysis. Serum protein concentration was determined by Bradford method. 38
Preparation of Liver and Tumor Tissue Protein Samples
A total of 0.1 g frozen liver or tumor tissue was fully grinded, 2 mL tissue lytic fluid was added into tissue, and then was incubated at 36°C for 1 hour. The mixture was centrifuged at 15 000 rpm for 15 minutes at room temprature, the supernatant was extracted from mixture, and then the supernatant was centrifuged 15 000 rpm for 15 minutes at room temperature again to remove impurities. The supernatant wasfrozen at −80°C for protein mass spectrometry analysis. Tissue protein concentration was determined by Bradford method.
Isoelectric Focusing
Serum or tissue protein sample of 450 µL with a protein content of 400 µg was slowly added into focusing slot; gel strip was slowly put into protein solution without bubble formation in the case of gel surface downward, 2 mL covered oil was slowly added on the surface of gel strip, and then the cover lid of focusing slot was added. The parameter of isoelectric focusing was set at 20°C and maximum current of 50μA per strip. The procedure of isoelectric focusing was done successively at 50V × 12 hours (step), 500V × 1 hour (step), 1000V × 1 hour (step), 1000 to 8000 V × 1 hour(gradient), 8000 V × 10 hours (step), and 500 V × 10 hours (step).
Gel Strip Balance and SDS-PAGE
Gel strip in each group was taken out of focusing slot after isoelectric focusing was completed. The covered oil and residual protein solution on the gel surface were sucked out, and the gel strip was added 10 mL balance fluid 1 for 15 minutes, and then the gel strip was put into 10 mL balance fluid 2 for 15 minutes. The balanced gel strip was incubated in the SDS-PAGE electrophoretic buffer solution for 30 seconds, then added to the surface of SDS-PAGE gel, and then the gel strip and SDS-PAGE gel were placed the electrophoretic tank and electrophoresed at 15°C. The electrophoresis was done continuously at 100V × 1 hour, 200 V, and until bromophenol blue ran out of the gel.
Gel Staining
After electrophoresis, the gel was rinsed with ultrapure water for 1 minute, fixed with fixation solution for 30 minutes, sensitized with sensitizing solution for 30 minutes, then rinsed with ultrapure water for 5 minutes for 3 times, stained with silver dye solution for 30 minutes, and then rinsed with ultrapure water for 1 minute twice. The gel was washed with developing solution until the strip was clear, stopped with stop bath solution for 10 minutes, and then rinsed with ultrapure water for 5 minutes thrice. The gel was stored in 1% acetic acid.
Gel Imaging and Image Analysis
The stained gel at the indicated time was scanned in a grayscale manner at the optical density value of 300 dpi using an Image Scanner. The scanned images were, respectively, analyzed using ImageMaster 2D Platinum 7.0 software. Compared to 0 time point, the protein expression at the indicated time was quantified in case of gel protein point detection, image background subtraction, protein point gray value standardization, and protein point matching between different gels. The t-test was performed among 3 groups of different time points with fold change being more than 2 times or less than 0.5 times. P value < .05 was considered to be statistical significant difference between protein points. The statistical difference in protein points were, respectively, obtained from the gel subjected to mass spectrometry.
Protein Enzymolysis
Every protein gel point was added to a test tube, rinsed with ultrapure water twice, destained with silver destaining solution for 10 minutes, and rinsed with deionized water twice. Imbibitional solution was added to the test tube for 5 minutes, removed, then dehydrated solution 1 was added to the test tube to dehydrate for 5 minutes, and removed; dehydrated solution 2 was added into the test tube to dehydrate for 5 minutes and removed. Zymolytic working solution of 10 µL was added to the test tube to imbibe for 30 minutes, and then 20 µL zymolytic covering solution was added into test tube to enzymolyse at 37°C for 12 hours. The supernatant was removed, and 50 µL protein extractive solution was added to the test tube in the water bath at 37°C for 30 minutes, centrifuged at 5000 rpm for 5 minutes, and supernatant was removed. All supernatant was lyophilized to be analyzed by mass spectrometry.
Protein Mass Spectrometry
Lyophilized powder of every protein gel point was dissolved in 5 µL of 0.1% trifluoroacetic acid (TFA) solution and mixed with α-cyano-4-hydroxy cinnamic acid saturated solution containing 50% acetonitrile and 1%TFA in 1:1 proportion. Mixed sample of 1 µL was taken out to identify the point target of mass spectrum by ABI4800 MALDI-TOF/TOF Mass Spectrometer. Positive ion mode and automatic data mode were used to collect data. The mass spectrum scanning range of peptide mass fingerprinting was from 800 to 3500 Da, and the 10 peaks of maximum strength were selected to be secondary mass spectrometry. The primary and secondary mass spectrum data were integrated to analyze and identify the proteins by the GPS3.6 (Applied Biosystems) and Mascot2.1 (Matrix Science) softwares. The processing and control images of 2-dimensional electrophoresis were, respectively, compared, and the statistical difference in protein points were analyzed by mass spectrometry with the fold change being more than 2 times or less than 0.5 times; P value was <.05. Rattus was database, enzyme was trypsin, maximum omissive cut site was 1, fixed modification was carbamidomethyl (C), variable modification was oxidation (M), MS tolerance was 0.15 Da, MS/MS tolerance was 0.25 Da, and protein score CI% being greater than 95 was regarded as successful identification.
Assay for Serum Expression of Clusterin, NDRG2, and HSPa8 Using ELISA Technique
Serum sample of 100 µL at different time points in each group was added into each well of culture plate and incubated at 37°C for 2 hours. After liquid of each well was removed, 200 µL 5% fetal bovine serum was added into each well to block the antigens at 37°C for 40 minutes. After liquid of each well was removed, 100 µL working solution A was added into each well; then, the primary antibodies including anti-clusterin antibody(1:200), anti-NDRG2 antibody(1:200), anti-HSPa8 antibody(1:200), and anti-β-actin antibody(1:200) were, respectively, added into each well and incubated at 37°C for 1 hour. After liquid of each well was removed, it was washed with washing solution for 3 times for 6 minutes, and then 100 µL of working solution B was added into each well and incubated at 37°C for 30 minutes. After liquid of each well was removed, washed with washing solution 5 times for 10 minutes, 90 µL trimethylhexamethylenediamine substrate solution was added into each well, incubated at 37°C for 15 to 25 minutes (finish time according by the actual colour reaction), and then 50 µL terminated solution was added into each well; absorbance of each well was measured using enzyme standard instrument at 450 nm wavelength.
Assay for Protein Expression of Clusterin, NDRG2, and HSPa8 in Liver Tissue With Western Blotting Technique
A total of 12.5 µL 5× SDS loading buffer was added into 50 µg protein sample at different time points in each group, denatured at 100°C for 10 minutes, and cooled in ice bath. Protein marker, control samples, and protein samples at different time points in each group were, respectively, added into 10% SDS-PAGE gel hole, electrophoretic buffer solution was slowly added into electrophoretic tank, and gel electrophoresis was performed at 80 V for 20 minutes and then at 120 V until the bromophenol blue was near the bottom of gel. Gel was taken out and placed on the cellulose acetate membrane and protein electrotransfer was performed by Electrotransfer Apparatus at 350 mA for 2 hours, and then the cellulose acetate membrane was immersed into the blocking solution containing 5% skimmed milk powder and gently shaken for 1 hour. After the blocking solution was removed, the cellulose acetate membrane was, respectivlely, placed in 5 mL primary antibody solution including anti-clusterin antibody (1:200), anti-NDRG2 antibody (1:200), anti-HSPa8 antibody (1:200), and anti-β-actin antibody (1:200) overnight at 4°C. The membranes were rinsed with PBST buffer solution at room temperature for 15 minutes thrice. After the primary antibody solution was removed, 5 mL of the secondary antibody solution was added and incubated at room temperature for 1 hour with a horseradish peroxidase-conjugated secondary antibody (1:1000). The membranes were rinsed with PBST buffer solution at room temperature for 15 minutes 3 times again. The each band was, respectively, scanned with the Odyssey near-infrared scanners, the gray value of each band was analyzed with Quantity One software, the relative quantity of target protein expression was expressed with the gray value of each band and the gray value of β-actin ratio.Three independent blots were analyzed for each protein.
Detection of Location of Expression of Clusterin, NDRG2, and HSPa8 in Liver Tissues Using Immunohistochemistry Technique
After the paraffin slices of liver tissue in each group at the different time points were, respectively, processed with xylene clearing and gradient ethanol dehydration, the paraffin slices were, respectively, incubated in 3% hydrogen peroxide solution at room temperature for 10 minutes and rinsed with 0.01 mol/L phosphate-buffered saline (PBS) solution for 5 minutes 3 times. Proteinase K solution of 50 μL (dilution 20μg/mL) was, respectively, added on the tissue slice to digest proteins at 37°C for 20 minutes and then rinsed with double distilled water for 5minutes 3 times. The paraffin slices were placed in citrate buffer solution (pH 6.0) and boiled for 10 minutes, placed at room temperature for 20 minutes, and then blocked with animal serum for 30 minutes. After the serum was removed, the primary antibodies including anti-clusterin antibody (1:100), anti-NDRG2 antibody (1:100), and anti-HSPa8 antibody (1:100) were, respectivlely, added on to the tissue slices and left overnight at 4°C. The tissue slices were rinsed with 0.01 mol/L PBS at room temperature for 3 minutes 3 times, the primary antibody solution was removed, and then the secondary antibody solution was added on the tissue slices at room temperature for 30 minutes. Then, the tissue slices were rinsed with 0.01 mol/L PBS at room temperature for 3 minutes 3 times and placed in the avidin–biotin–peroxidase complex solution (Vector, Cat: PK-6100) at room temperature for 30 minutes, then rinsed with 0.01 mol/L PBS at room temperature for 3 minutes 3 times, colorated with diaminobenzidine reagent about 2 minutes, rinsed with water, and redyed with hematoxylin. The paraffin slices were processed with xylene clearing and gradient ethanol dehydration, sealed with neutral gum, and then observed under light microscope.
Tissue cells with brown particles in nuclei were identified as positive cells that expressed the target protein and were counted at 200× magnification. Three visual fields were randomly selected in each slice, and the average of 3 visual fields was used for statistical analysis.
Statistical Analysis
Statistical analysis was performed using the Statistical Package for Social Sciences, version 17.0, statistics software (SPSSInc, Cabit Information Technology Co. Ltd, Shanghai). The mean was expressed as
Results
Morphological and Histopathological Changes in Liver Tissues During Induced Liver Cancer
The volume of liver lobe became swollen and large at the eighth week, and many white nodules occurred on the liver surface. The volume of liver lobe became obviously swollen and larger at the 14th week, and large tumor lesions occurred at the liver surface. Many tumor lesions occurred in liver tissues at the 18th 21st week, and there were a lot of tumor vessels and necrotic lesions on the surface of tumor tissues. Rat hepatocytes underwent hypertrophy, degeneration, necrosis, fibrosis, and nucleolus atypia within 2 to 4 weeks during induced liver cancer (Figure 1B and D). Hepatocytes underwent obviously nucleolus atypia, structure disorder, and cancer focus formation within 8 weeks. Hepatocytes had pathologic mitosis, bigger nucleolus, and typical pathological manifestations of liver cancer within 14 to 21 weeks (Figure 1F and H).

Morphological changes and tissue pathology of liver tissues during induced liver cancer in rats. A, The volume of liver lobe became swollen and large at the eighth week, and the liver surface had many white nodules. B, Hepatocytes occurred obviously nucleolus atypia, structure disorder, and canceration (original magnification HE ×200). C, The volume of liver lobe became obviously swollen and larger at the 14th week, and the liver surface showed large tumor lesions. D, Hepatocytes had a lot of large nucleolus, and some hepatocytes became cancer cells (original magnification HE ×200). E, Many tumor lesions occurred in liver tissues at the 18th week. F, Liver tissues had structure disorder and a lot of cancer cells and became typical pathological manifestations of hepatocellular carcinoma (original magnification HE ×200). G, Many tumor lesions occurred in liver tissues at the 21st week, and there were a lot of tumor vessels and mecrotic lesions on the surface of tumor tissues. H, Hepatocytes had typical nucleolus atypia, structure disorder, and intracytoplasmic vacuoles degeneration. The histopathological manifestations were typical hepatocellular carcinoma (original magnification HE ×200).
Screening of Serum Differential Proteins During Induced Liver Cancer in Rats
The primary and secondary mass spectrum data from the protein spots of serum 2-dimensional electrophoresis were integrated for analysis. Fifteen differential proteins were screened by comparing the mass spectrometric data between the control group and the induced cancer group (Figure 2 and Table 1).

Serum 2-dimensional gel electrophoresis at the different time points during induced liver cancer in rats. A, Serum 2-dimensional gel electrophoresis in normal control rats. B, Serum 2-dimensional gel electrophoresis at the fourth week during induced liver cancer in rats. C, Serum 2-dimensional gel electrophoresis at the 14th week during induced liver cancer in rats. D, Serum 2-dimensional gel electrophoresis at the 21st week during induced liver cancer in rats.
Screened Serum Protein Profiles at Different Time Points During Induced Liver Cancer in Rats.

Screening of Differential Proteins of Liver Tissues During Induced Liver Cancer in Rats
The primary and secondary mass spectrum data from the protein spots of tissue 2-dimensional electrophoresis were integrated for analysis. Fifteen differential proteins were screened by comparing the mass spectrometric data between the control group and the induced cancer group at the different time points (Figure 3 and Table 2).

Two-dimensional gel electrophoresis of liver tissues at the different time points during induced liver cancer in rats. A, Two-dimensional gel electrophoresis of liver tissue at the fourth week during induced liver cancer in rats. B, Two-dimensional gel electrophoresis of liver tissue at the 14th week during induced liver cancer in rats. C, Two-dimensional gel electrophoresis of liver tissue at the 21st week during induced liver cancer in rats. D, Two-dimensional gel electrophoresis of paraneoplastic liver tissue at the 21st week during induced liver cancer in rats.
Screened Protein Profiles of Liver Tissues at Different Time Points During Induced Liver Cancer in Rats.
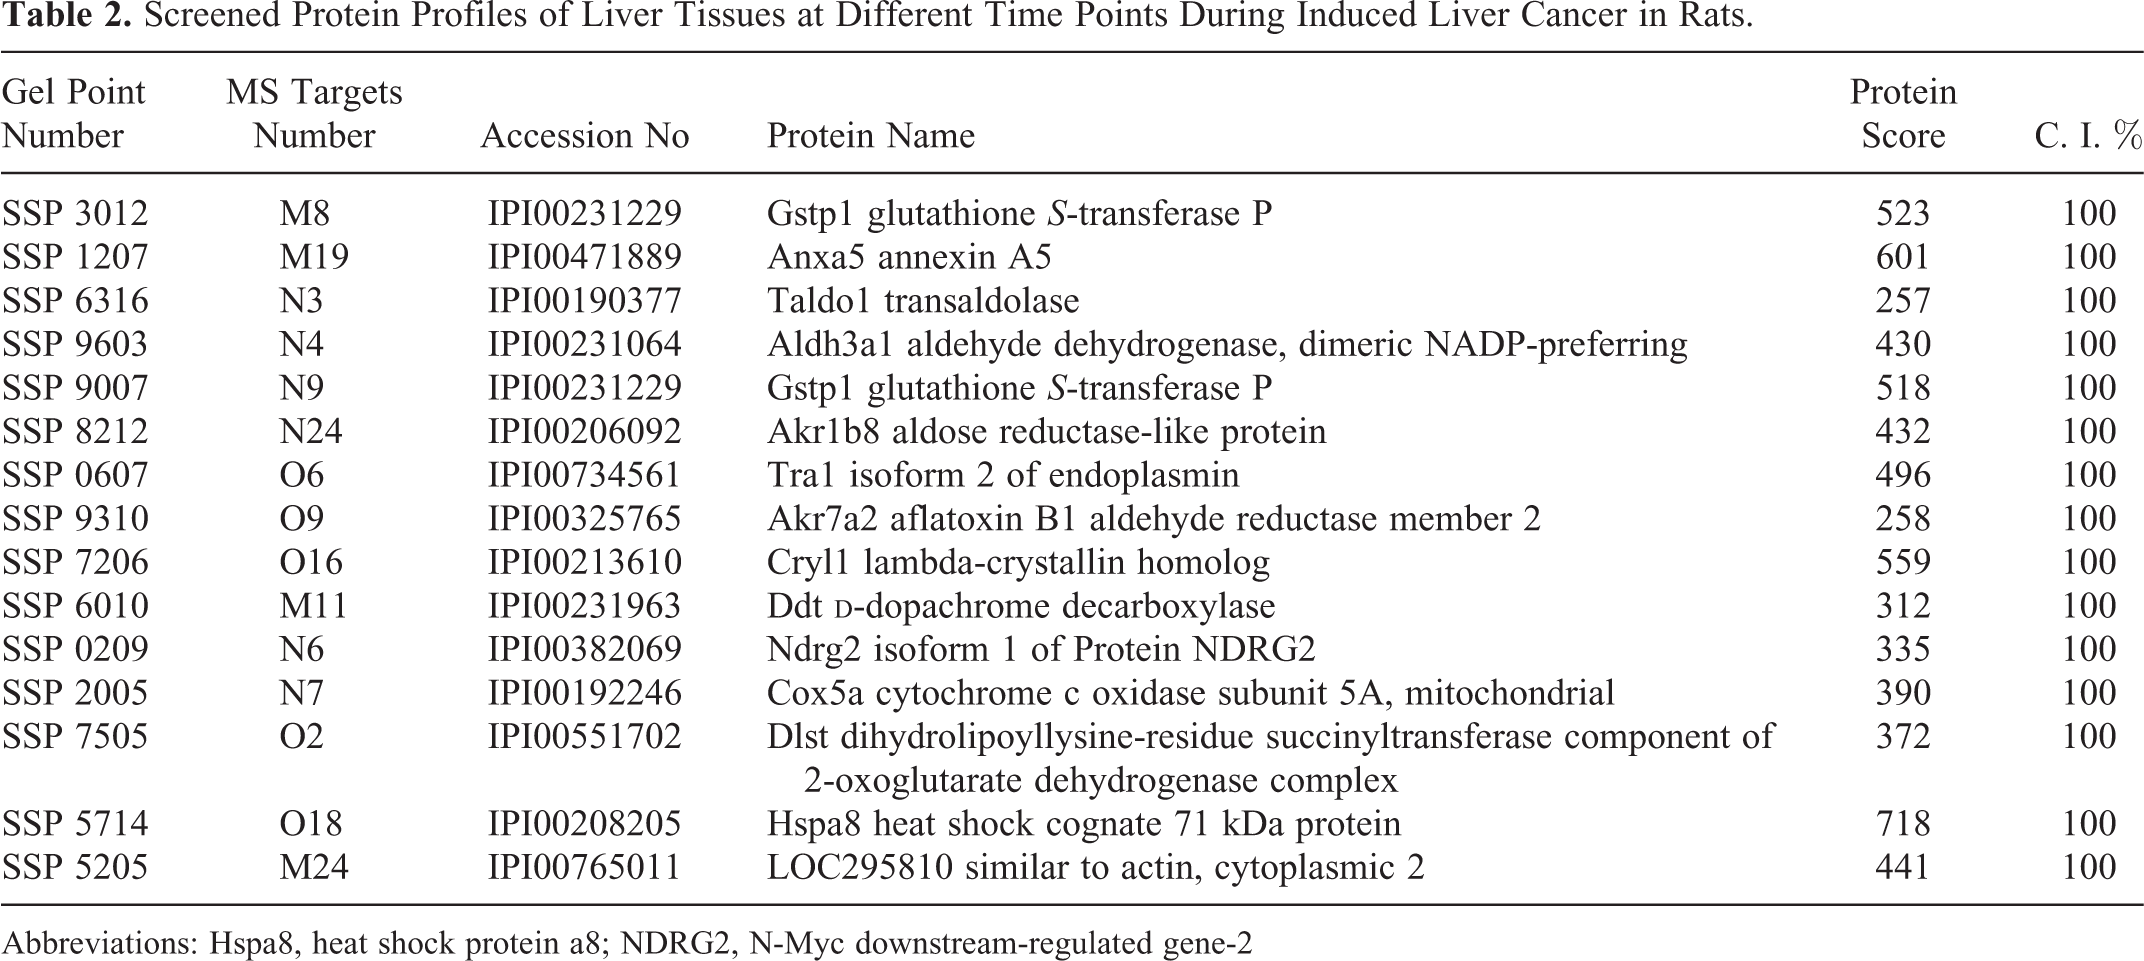
Abbreviations: Hspa8, heat shock protein a8; NDRG2, N-Myc downstream-regulated gene-2
Identification of Differential Proteins of Serum and Liver Tissues
Three differential proteins closely related to hepatocarcinogenesis were identified from 30 different proteins of serum and liver tissues with protein score CI% being >95. The 3 identified proteins were, respectively, clusterin (IPI00198667), N-Myc downstream-regulated gene-2 (NDRG2; IPI00382069), and heat shock protein a8 (HSPa8); IPI00208205).
Serum Expression of Clusterin, NDRG2, and HSPa8 During Induced Liver Cancer in Rats
As the time progressed, the serum levels of clusterin and HSPa8 in induced liver cancer in rats increased gradually (Figures 4 and 5). However, the serum NDRG2 level in induced liver cancer in rats underwent biphasic changes, and the serum NDRG2 level decreased at the 8th week, increased at the 14th week, and then decreased significantly (Figure 6).

The serum level of clusterin during induced liver cancer in rats. The curve chart showed that as the time prolonged, the serum level of clusterin increased gradually compared to the control group.

The serum level of heat shock protein a8 (HSPa8) during induced liver cancer in rats. The curve chart showed that as the time prolonged, the serum level of HSPa8 increased gradually compared to the control group.

The serum level of N-myc downstream-regulated gene-2 (NDRG2) during induced liver cancer in rats. The curve chart showed that as the time prolonged, the serum level of NDRG2 underwent biphasic changes, and the serum NDRG2 level decreased gradually from 2 to 8 weeks, increased gradually from 8 to 14 weeks, and then decreased significantly after 14 weeks.
Protein Expression of Clusterin, NDRG2, and HSPa8 in Liver Tissues During Induced Liver Cancer in Rats
The protein expression of clusterin and HSPa8 in liver tissues at the different time points didn’t have a statistical difference between the control group and the induced cancer group (P > .05). The NDRG2 level in liver tissues decreased gradually at the 8th week, increased gradually at the 14th week, and then decreased significantly after 14 weeks (P < .05), which was consistent with the serum level of NDRG2 (Figure 7).

The protein expression of clusterin and heat shock protein a8 (HSPa8) in liver tissues at the different time points didn’t show statistical difference. The N-myc downstream-regulated gene-2 (NDRG2) level in liver tissues decreased gradually at the eighth week, increased gradually at the 14th week, and then decreased significantly after 14 weeks; this indicated that the NDRG2 expression showed biphasic changes in liver tissues at the different time points.
Location and Expression of Clusterin, NDRG2, and HSPa8 in Liver Tissues During Induced Liver Cancer in Rats
The expression of clusterin in the cytoplasm of hepatocytes was weakly positive in the liver parenchyma at the second week (Figure 8A). Expression of clusterin in hepatocytes was located in the cytoplasm around the portal area at the fourth week (Figure 8B). The clusterin expression in hepatocytes increased significantly at the 8th week (P < .05; Figure 8C), decreased significantly at the 14th and 18th week (P < .05; Figure 8D and E), and then increased significantly at the 21st week (P < .05; Figure 8F).

The location of expression of clusterin in liver tissues during induced liver cancer in rats (IHC ×200). A, The expression of clusterin in the cytoplasm of hepatocytes was weakly positive in liver parenchyma at the second week. B, The expression of clusterin in the cytoplasm of hepatocytes was positive around the portal area at the fourth week. C, The expression of clusterin in the cytoplasm of hepatocytes was strongly positive around the portal area at the eighth week. D and E, The expression of clusterin in the cytoplasm of hepatocytes was weakly positive in liver parenchyma at the 14th and 18th week. F, The expression of clusterin in cytoplasm of hepatocytes was strongly positive in liver parenchyma at the 21st week.
The expression of HSPa8 in the cytoplasm of hepatocytes occurred in liver parenchyma at the second week (Figure 9A). The expression of HSPa8 in the cytoplasm of hepatocytes increased gradually in liver parenchyma from the 4th week to 21st week (Figure 9B-F).

The location of expression of heat shock protein a8 (HSPa8) in liver tissues during induced liver cancer in rats (IHC ×200). (A): The expression of HSPa8 in the cytoplasm of hepatocytes was positive in liver parenchyma at the second week. B and C, The expression of HSPa8 in the cytoplasm of hepatocytes was strongly positive in liver parenchyma at the fourth and eighth weeks. D, The expression of HSPa8 in the cytoplasm of hepatocytes was strongest positive in liver parenchyma at the 14th week. E and F, The expression of HSPa8 in cytoplasm of hepatocytes was strongly positive in liver parenchyma at the 18th and 21st weeks.
The expression of NDRG2 in the cytoplasm and nucleus of mesenchymal cells occurred around portal area at the second week (Figure 10A). The expression of NDRG2 in cytoplasm and nucleus of hepatocytes increased gradually in liver parenchyma from the fourth to eighth week (Figure 10B and C). The expression of NDRG2 in cytoplasm of hepatocytes decreased gradually in liver parenchyma after the 14th week (Figure 10D-F).

The location of expression of N-myc downstream-regulated gene-2 (NDRG2) in liver tissues during induced liver cancer in rats (IHC ×200). A, The expression of NDRG2 in the cytoplasm and nucleus of mesenchymal cells occurred around portal area at the second week. B and C, The expression of NDRG2 in cytoplasm and nucleus of hepatocytes was strongly positive in liver parenchyma at the fourth and eighth week. D- F, The expression of NDRG2 in cytoplasm and nucleus of hepatocytes was weakly positive in liver parenchyma after the 14th week.
Discussion
The deregulation of the cell cycle results in the abnormal cell proliferation and apoptosis, and it plays an important role in the occurrence and development of tumor. Alaiya et al 9 analyzed the differences in protein expression between the cancerous tissue and normal liver tissue by proteomic and immunohistochemical techniques; the results showed that the aldose reductase-like protein, whose relative molecular mass and isoelectric point were, respectively, 35 000 Da and 74, was expressed in the precancerous lesions and liver cancer tissue; however, there was no expression in the normal liver tissue. It indicated that these changes might be closely related to the pathogenesis of liver cancer. 9 Poon et al 10 screened 250 different proteins in serum samples from patients with liver cancer, cirrohosis, and healthy persons using the proteomic technique. Different proteins demonstrated the specificity of the liver cancer proteome and were better markers for early diagnosis of HCC. We established the rat HCC model induced by diethylnitrosamine agent; the proteome in the serum and liver tissue samples was screened and identified by 2-dimensional gel electrophoresis and tandem time-of-flight mass spectrometry, and the results showed that 15 serum differential proteins and 15 tissue differential proteins were, respectively, screened according to protein score CI% >95. The 3 differential proteins closely related to hepatocarcinogenesis were eventually identified from the 30 different proteins. The 3 differential proteins were clusterin (IPI00198667), HSPa8 (IPI00208205), and NDRG2 (IPI00382069), respectively.
Clusterin is a kind of heterologous dimer-sulfated glycoprotein common in the cytoplasm of normal cells and can stabilize the cell membrane and regulate the intercellular matrix interaction and differentiation, cell cycle, transformation, apoptosis, movement, oxidative stress, DNA repair, adhesion, membrane regeneration, and circulation of epithelial cell. 11 Qian et al 12 found that the positive rate of clusterin in liver cancer tissue was 82.93%, and the expression of clusterin in liver cirrhosis and normal liver tissues was negative or weakly positive. The degree of tumor differentiation was lower, the clusterin level in liver cancer tissue was higher, and it indicated that clusterin could promote the proliferation, metastasis, and invasion of liver cancer cells. Recent studies found that serum clusterin significantly increased in patients with HCC and decreased in patients with cirrohsis and chronic hepatitis. Moreover, serum clusterin significantly increased in patients with HCC being poorly differentiated, portal vein, and lymph node invasion. The optimal threshold of serum clusterin level was 128 μg/mL, and the sensitivity and specificity of predicting HCC was, respectively, 90% and 89%, if serum clusterin level was more than 128 μg/mL. It could also be used as a potential indicator for predicting the development and metastasis of HCC. 13,14 Our current study found that serum clusterin level gradually increased with the prolongation of time during hepatocarcinogenesis in rats. Expression of clusterin in the cytoplasm of hepatocytes was positive around the portal area at the fourth week. Expression of clusterin in the cytoplasm of hepatocytes was strongly positive around the portal area at the eighth week. However, the clusterin expression in the cytoplasm of hepatocytes was weakly positive in liver parenchyma at the 14th and 18th week. The clusterin expression in the cytoplasm of hepatocytes was strongly positive in liver parenchyma at the 21st week. It indicated that clusterin played a positive role in inducing cancer in normal liver cells by promoting the abnormal proliferation of normal liver cells.
Heat shock cognate protein a8, also known as HSP70, is a main intracellular molecular chaperone and has lower expression in normal cells. 15,16 The increase in expression of HSPa8 induced by the malignant transformation of cells results in the abnormal expression of HSPa8 in tumor cells. Through interaction with c-myc, c-fos, p53, and their protein products, HSPa8 can regulate the proliferation, apoptosis, differentiation of cells, tumor resistance, and immune in the case of coordination with Bcl2, Bcl-XL, and Cr-mA. H eat shock protein a8 is closely related to the occurrence and development of tumor cells. 17,18 As one of the most important subset in the HSP family, HSP70 proteins are found to be a cancer relevant survival protein. It is abundantly expressed in malignant tumors of various origins, and its expression correlates with increased cell proliferation, poor differentiation, lymph node metastases, and poor therapeutic outcome. 19,20 The expression of HSP70 increased in lower differentiation of liver cancer cells and weak expression in mature differentiation of liver cancer cells. Moreover, the expression of HSP70 in paracancerous tissue is very weak, indicating the heterogeneity in tumor tissue differentiation because of the expression of HSP70 in cytoplasmic, nuclear, and/or cell membrane. 21,22
In recent years, many studies suggested that HSP70 is overexpressed in early and progressed HCC. It is believed that the specific inhibition of HSP70 expression may affect the proliferation and apoptosis of HCC cells. 23 -25 Tumor overgrowth can result in the relative insufficiency of vascular hyperplasia to induce expression of HSP70 due to hypoxia stress, it indicates that the HSP70 level may reflect the proliferation and malignant degree of HCC cells, and HSP70 is involved in early occurrence of HCC. 26
Our study showed that serum HSPa8 level gradually increased with the prolongation of time during hepatocarcinogenesis in rats. The expression of HSPa8 in the cytoplasm of hepatocytes was positive in hepatic parenchyma at the second week. The expression of HSPa8 in the cytoplasm of hepatocytes increased at the fourth and eighth week. Moreover, the expression of HSPa8 in the cytoplasm of hepatocytes was persistently positive in liver parenchyma at the 21st week. The results indicated that the diethylnitrosamine agent could cause DNA and cell damage of normal liver cells; resulted in the mutation, abnormal proliferation, canceration of liver cells, and overecpression of HSPa8 in liver cells; and the expression level of HSPa8 could reflect the degree of proliferation and malignant transformation of liver cells.
N-myc down stream regulated gene 2 is a kind of gene related to cell proliferation and differentiation; participates in the occurrence, development, and prognosis of tumor; involves in hypoxia and stress reaction; and facilitates the maintenance of costimulatory signal being necessary for T lymphocyte proliferation induced by dendritic cells. 27 -30 N-Myc downstream-regulated gene-2 is located in the cytoplasm of cells and is involved in the cell growth and differentiation. N-Myc downstream-regulated gene-2 plays a bidirectional regulation role in liver regeneration; the NDRG2 expression decreases during early liver regeneration and promotes the division and proliferation of liver cells. However, the expression of NDRG2 increases during late liver regeneration and promotes the differentiation and maturation of liver cells. 31 As a new candidate tumor suppressor gene, NDRG2 also plays an important role in the formation of HCC. Compared to normal and paracancerous liver tissues, the expression of NDRG2 in liver cancer tissues downregulated significantly, and the overexpression of NDRG2 was positively correlated with the differentiation of HCC. The in vitro experimental results showed that the expression level of NDRG2 was closely related to the proliferation, invasion, and metastasis of liver cancer cells. 32,33 Yang et al 34 found that the messenger RNA (mRNA) and protein expression of NDRG2 in hepatocytes decreased after hepatectomy for 8 hours and decreased to the lowest level at 48 hours; then, the mRNA and protein expression of NDRG2 increased gradually to the highest level after 72 hours. The positive expression rates of NDRG2 in HCC tissues and normal liver tissues were 16.67% and 100%, respectively, and the NDRG2 expression was located in the cytoplasm. The mRNA and protein expression of NDRG2 in HCC tissues was significantly lower than that in normal liver tissues, but there was no significant difference in the NDRG2 mRNA expression in different HCC tissues of Edmondson-Steiner grading. The results showed that the gene expression of NDRG2 was significantly different between HCC tissues and normal liver tissues, and NDRG2 was involved in the occurrence and development of HCC. 35
Our current study showed that serum NDRG2 level decreased at the 8th week, increased at the 14th week, and then decreased at the 18th week during hepatocarcinogenesis in rats. The serum NDRG2 expression was a biphasic change. The NDRG2 expression was located in cytoplasm and nucleous of mesenchymal cells around the portal area in the second week. The overexpression of NDRG2 was located in the cytoplasm and nucleous of hepatocytes in liver parenchyma at the fourth week and eighth week. The expression of NDRG2 decreased in hepatocytes at the 14th week and decreased to the lowest level at 18th week. It indicated that NDRG2 participated in the process of abnormal cell division, proliferation, and carcinogenesis of liver cells induced by diethylnitrosamine agent during hepatocarcinogenesis in rats.
So far, the exact mechanisms of the occurrence and development of HCC has not been fully elucidated. Chronic inflammation is a major driver for the transformation of genetically defective liver stem cells (LSCs) into highly metastatic liver cancer cells in premalignant liver tissue, and interleukin 6-mediated inflammation programs constitutive activation of the Transforming growth factor activated kinase1-Nuclear transcription KappaB signaling cascade in LSCs, thereby, accelerating the transformation of normal LSCs to metastatic cancer stem cells. 36 It is one of the research hotspots in HCC to find a new molecular and therapeutic target, which is closely related to the occurrence and development of HCC. Our present study indicates that HSPa8, clusterin, and NDRG2 participate in the process of abnormal cell division, proliferation, and carcinogenesis of liver cells during hepatocarcinogenesis, but the biological effects of the 3 proteins is not fully understood. Their structure, function, and regulating mechanism of induced activation needs further study to clarify their biological effects in different stages of the occurrence and development of HCC, and the molecular targeted drugs can be developed for these molecules. It will provide a new theoretical basis for the early diagnosis and molecular-targeted drug therapy for HCC.
In conclusion, our results indicate that HSPa8, clusterin, and NDRG2 participate in the process of abnormal cell division, proliferation, and carcinogenesis of liver cells during hepatocarcinogenesis.
Footnotes
Abbreviations
Acknowledgment
We thank Dr Bolie Shu for kind help in protein mass spectrometry.
Declaration of Conflicting Interests
The author(s) declared no potential conflicts of interest with respect to the research, authorship, and/or publication of this article.
Funding
The author(s) disclosed receipt of the following financial support for the research, authorship, and/or publication of this article: This research project was supported by the major project of Science and technology commission of Shanghai Putuo district (PT2012-B-162).