
Abstract
Deformable image registration is a powerful tool for mapping information, such as radiation therapy dose calculations, from one computed tomography image to another. However, deformable image registration is susceptible to mapping errors. Recently, an automated deformable image registration evaluation of confidence tool was proposed to predict voxel-specific deformable image registration dose mapping errors on a patient-by-patient basis. The purpose of this work is to conduct an extensive analysis of automated deformable image registration evaluation of confidence tool to show its effectiveness in estimating dose mapping errors. The proposed format of automated deformable image registration evaluation of confidence tool utilizes 4 simulated patient deformations (3 B-spline-based deformations and 1 rigid transformation) to predict the uncertainty in a deformable image registration algorithm’s performance. This workflow is validated for 2 DIR algorithms (B-spline multipass from Velocity and Plastimatch) with 1 physical and 11 virtual phantoms, which have known ground-truth deformations, and with 3 pairs of real patient lung images, which have several hundred identified landmarks. The true dose mapping error distributions closely followed the Student t distributions predicted by automated deformable image registration evaluation of confidence tool for the validation tests: on average, the automated deformable image registration evaluation of confidence tool–produced confidence levels of 50%, 68%, and 95% contained 48.8%, 66.3%, and 93.8% and 50.1%, 67.6%, and 93.8% of the actual errors from Velocity and Plastimatch, respectively. Despite the sparsity of landmark points, the observed error distribution from the 3 lung patient data sets also followed the expected error distribution. The dose error distributions from automated deformable image registration evaluation of confidence tool also demonstrate good resemblance to the true dose error distributions. Automated deformable image registration evaluation of confidence tool was also found to produce accurate confidence intervals for the dose–volume histograms of the deformed dose.
Introduction
Deformable image registration (DIR) has been used for various clinical applications in radiation oncology. The resulting deformation vector field (DVF) from DIR can reduce the time needed for image segmentation 1 –7 and can be used to transfer dose from one image to another 1 –3,8 –11 for adaptive radiation therapy or to evaluate the composite dose from multiple treatment courses. Deformable image registration, however, has inherent uncertainties, which makes the application to dose transfer much more challenging, as there is currently no clinical means to verify its accuracy.
Many studies 12 –16 have highlighted the accuracy of DIR algorithms in terms of landmark tracking and image similarity. A few studies 17 –21 have investigated how DIR uncertainty affects dose transfer, and some 9,22,23 have developed the automated processes for spatial uncertainty modeling. Bender et al 9 suggested finding the region of spatial DIR uncertainty by assessing the inverse inconsistency of a deformation field, but this ignores DIR errors in the inverse consistent regions. A distance-to-dose difference tool was introduced by Saleh-Sayha et al 22 that maps the effect of dose gradients on the uncertainty. It, however, does not account for other causes of DIR inaccuracy, including the increased errors frequently found in regions of homogeneous image intensity. The work proposed by Murphy et al 23 obtained a spatial DIR error map by analyzing the effect of varying the region of interest (ROI) on the resulting DVF. This, however, does not consider the variability between different DIR algorithms, as well as other causes of DIR uncertainty other than those caused by the ROI.
Our general goal for radiotherapy is to deliver doses to patients that are within 5% of that prescribed, when accounting for all sources of uncertainty (International Commission on Radiation Units, ICRU Report 24). For many patients, DIR becomes a contributing component to this uncertainty, but there is not currently a clinically established method to evaluate this uncertainty for a patient and how it contributes to the overall treatment uncertainty. Recently, Kirby et al 24 proposed a new software tool, the automated DIR evaluation of confidence tool (AUTODIRECT) that evaluates the spatial dose mapping accuracy of a DIR algorithm on a patient-by-patient basis. The automated confidence methodology utilizes a small number of test deformations (currently 4 for computational efficiency) to estimate the uncertainty in the DIR algorithm’s performance. It analyzes the spatial dose mapping errors from the 4 test cases by modeling them using a Student t distribution. 25
This validation is differentiated from the previous proof-of-principle study 24 in 2 ways. First, the implementation of AUTODIRECT in the previous study overpredicted DIR uncertainty. This issue has now been corrected in the current implementation, and it yields results close to the expected statistical behavior. Second, to demonstrate the performance and clinical relevance of the proposed framework, the validation is comprehensively performed with a total of 15 data sets. Twelve of these are phantoms (11 virtual and 1 physical) with known ground-truth deformations. The remaining 3 are actual lung patient data sets containing hundreds of pairs of manually defined landmarks. This extends the testing of AUTODIRECT to several anatomical sites (head-and-neck [HN], pelvis, and lung). Also, as virtual phantoms are simulated deformations, the addition of the physical phantom and real patient data sets benchmarks AUTODIRECT with real deformations.
Methods
Review of AUTODIRECT
For the phantom data sets in this study, the true deformation is known (Dtrue) and can be compared to the DVF (Dc) predicted by the clinical DIR algorithm (Ac) when applied to the phantom images, as seen in Figure 1A.

A, Diagram depicting the clinical use of a deformable image registration (DIR) algorithm. B, Diagram depicting the procedure used by automated deformable image registration evaluation of confidence tool (AUTODIRECT) to create a pair of patient-specific images with known deformation to test the performance of a DIR algorithm.
Figure 1B shows the workflow of AUTODIRECT. 24 It requires fixed and moving CT images (Fc and Mc) and 2 noise scans (N1 and N2) describing the noise characteristics of the imaging system to produce DIR error estimates. More specifically, Figure 1B illustrates how AUTODIRECT applies a generator DIR algorithm (Ag) to Mc and Fc to produce a test DVF (Dt). A filter with edge preserving and smoothing functions processes Mc to remove noise that could potentially skew DIR accuracy determination, yielding a processed moving image (Mp). The test deformation field (Dt) is applied to Mp to create an artificial-processed fixed image (Fp). This test deformation is the ground-truth deformation for the pair Mp and Fp. Two unique noise scans are then added to Mp and Fp to create the final test moving and fixed images (Mt and Ft). The pair of Mt and Ft is passed to the clinical DIR algorithm (Ac), and the resulting deformation field (Dr) is compared to Dt. In AUTODIRECT, this procedure is performed 4 times using different generator algorithms (3 B-spline DIRs and 1 rigid transform). The comparison of the 4 test and resulting deformations are used to create a statistical model of the dose errors for each voxel. When small sample sizes (<20) are used to estimate Gaussian distributions, a Student t distribution is better suited to represent the probability distribution of variables. As the current version of AUTODIRECT has small number of samples (n = 4), the distribution of DIR dose mapping error is assumed to conform to the Student t distribution with 3 (N−1) degrees of freedom. Thus for each voxel, a Student t variable can be defined as expressed in Equation 1.

where N is the number of the test deformations (N = 4). E is the actual dose mapping error, given by the difference between the true dose at that voxel (dactual) and the dose predicted
Once the t variable is defined for each voxel, Equation 2 shows how to estimate the range of possible dose errors from our proposed framework at a certain confidence interval:

where k represents the confidence interval defined by the t distribution, that is, k = 3.182 at 95% confidence interval for 3 (N − 1) degrees of freedom. Notably, once Equation 2 is derived under assumption of the t statistic, the minimum and maximum doses for the confidence interval are completely defined by the mean and variance of the dose mapping errors from the test cases without the true deformation. Hence, if the t statistic assumption is validated, AUTODIRECT will demonstrate the ability to provide valuable dose uncertainty information for the clinical case without prior knowledge of the true deformation. For the clinical usage of this method, when the ground-truth deformation is not known, the test deformation fields would be utilized to calculate the statistical parameters in Equation 2 to derive the dose confidence interval.
Evaluation of AUTODIRECT
For validation testing of AUTODIRECT, we employed 11 pairs of virtual phantom images based on patient CT images for various body sites (1 prostate, 1 craniospinal, and 9 HN cases). The prostate data set is from a treatment of the prostate and lymph nodes to a dose of 45 Gy in 25 fractions. The craniospinal data set is from a treatment with the prescription of 39.6 Gy in 22 fractions. The HN cases had several different disease sites: base of tongue, tonsil, nasopharynx, and supraglottic larynx. These cases had prescriptions that were either 70 Gy in 35 fractions or 69.96 Gy in 33 fractions. For each set, a patient image was digitally deformed with ImSimQA, software available from Oncology Systems Limited (OSL), Shrewsbury, Shropshire, UK, to create a target image. It allows the user to manually define the deformation for a small set of control points and then utilizes a thin-plate spline algorithm to define the DVF for the entire volume. The 3 virtual phantoms on 3 different body sites created by Nie et al 21 utilized 30 pairs of anatomical landmarks defined by a physician to simulate anatomical changes in the prostate region due to bladder filling, changes along the cranio-spinal axis due to switching between a prone and supine position, and changes in the HN region due to patient weight loss. The remaining 8 virtual HN cases, created by Pukala et al, 19 simulated anatomy-driven deformations due to mandible translation/rotation as well as tumor and parotid shrinkage. ImSimQA can export the applied deformation, which serves here as the ground-truth deformation for each data set. An additional HN physical phantom set was also used, which was developed by Singhrao et al 17 with a measured ground-truth deformation determined with 891 optical markers. This physical phantom represented deformation from HN flexion. The physical phantom was modeled after an actual patient. The patient’s nasopharynx dose distribution (70 Gy in 35 fractions) was fused to the phantom for the dose analysis performed here.
To demonstrate its effectiveness in actual clinical cases, the workflow was also tested with 3 pairs of lung patient images with 300 identified pairs of landmarks, provided by DIR-LAB 14 (http://www.dir-lab.com). These 3 data sets were chosen at random from the 5, high-resolution (512 × 512 in the axial plane) four-dimensional computed tomography (DCT) data sets available on this site. For each case, the image in inhale breathing cycle was set to be the moving image, while the exhale was set to be the fixed image. Thus, the ground-truth deformations for these cases were the movement of the lungs from exhalation to inhalation. The true mapping between landmarks in the 2 images was provided by the DIR-LAB. As the landmarks were widely distributed throughout the entire lung, we simulated a whole lung treatment for each case. The prescriptions for these cases were 12 Gy in 6 fractions to the patient midplanes, delivered with anterior-posterior (AP)/ posterior-anterior (PA) fields. Because these landmarks are manually identified, their positions are not exact and have an inherent error associated with them. To account for this inherent error, we computed a uniform random variable ranging from −0.5 to 0.5 mm (half of the image resolution in x-, y-directions) for each landmark, multiplied this spatial error by the local dose gradient (Gy/mm), and added this additional dose error to the dose error calculated assuming perfect landmark correspondence.
For this version of AUTODIRECT, the 4 generator algorithms (Ag in Figure 1B) for the simulated deformations consisted of 1 rigid and 3 DIR algorithms. The DIR algorithms were B-spline-based algorithms 26,27 implemented in a research build of Velocity, with a wide range of control point spacings and passes. Thus, the 4 different generator algorithms produced simulated deformations with varying amounts of smoothness and pliability. For the clinical DIR algorithms (Ac in Figure 1), we applied 2 B-spline DIR algorithms: the B-spline multipass from the commercial version of Velocity (version 2.7) and the B-spline method from an open-source software, Plastimatch 27 (http://www.plastimatch.org) (Version 1.6.1). Velocity utilizes mutual information as its similarity metric, whereas mean-square difference was applied here for the Plastimatch DIR algorithm. Thus, 30 comparisons were made between AUTODIRECT-computed uncertainty maps and the true distribution of DIR errors: one comparison for each combination of 2 different clinical DIR algorithms and 15 different test image pairs (11 virtual phantom, 1 physical phantom, and 3 landmark image data set).
The noise scans (N1 and N2 in Figure 1B) were acquired by scanning a water phantom to capture noise and image artifacts, such as ring and nonuniformity artifacts. Two types of noise scans were acquired for this study. The first was from a large pelvic-shaped water phantom for the prostate phantom, and the other was a small cylindrical water phantom for the HN and craniospinal irradiation (CSI) phantom studies.
To assess how well AUTODIRECT modeled the distribution of DIR-related dose errors, the true error and the mean and variance of the test mapping errors for every voxel were calculated by AUTODIRECT for the 30 validation cases. If the AUTODIRECT method is accurate, then the computed t statistic should follow the theoretical t distribution. In addition, AUTODIRECT was used to estimate 50%, 68%, and 95% confidence intervals for the DIR dose errors using Equation 2. The percentage of voxels within the 3 designated confidence intervals was calculated. The spatial distribution of dose mapping errors was also visualized on the axial CT image and in the form of dose–volume histograms (DVHs) of specific structures.
Results
Phantom Studies
Figure 2 illustrates the distribution of dose mapping errors compared to the theoretical t distribution estimated by AUTODIRECT for the B-spline multipass DIR algorithms in Velocity and in Plastimatch. The HN physical phantom yielded a somewhat noisy distribution mainly due to the small number of samples (891 landmarks). The AUTODIRECT-predicted error distributions underestimated the errors for HN phantom 9 with the Velocity B-spline multipass, and slightly overestimated the errors for HN phantom 4 with the B-spline Plastimatch DIR algorithm. For the remaining cases, however, the t statistic estimated from AUTODIRECT closely conformed to the theoretical error distribution closely. The AUTODIRECT-derived confidence values were calculated at 3 different designated levels: 50%, 68%, and 95%, corresponding to k = 0.765, 1.189, and 3.182 in Equation 2, respectively. Figure 3 plots the percentage of voxels of the deformed dose lying within the 3 confidence intervals for the 12 data sets, which resulted in the average values of 48.8%, 66.3%, and 93.8% and of 50.1%, 67.6%, and 93.8%, for the Velocity and Plastimatch algorithms, respectively.

Probability density functions of errors. Comparison of the theoretical t distribution (red, dashed) and the distribution of dose mapping errors estimated from automated deformable image registration evaluation of confidence tool (AUTODIRECT) (black, solid) for 12 test data sets when Velocity B-spline multipass and B-spline Plastimatch clinical deformable image registrations (DIRs) are evaluated.

Percentage of voxels within the corresponding automated deformable image registration evaluation of confidence tool (AUTODIRECT)-predicted confidence interval for 12 phantom cases when the confidence intervals are defined to be 50%, 68%, and 95% with (A) Velocity B-spline multipass clinical deformable image registration (DIR), (B) B-spline clinical DIR from Plastimatch.
Figure 4 displays the examples of the spatial distribution of DIR errors for the prostate, CSI, HN phantom1, and HN phantom 9 phantoms. There is a high degree of correlation between the gradient of the dose distributions and DIR uncertainty. Figure 4 also shows the similarity between the actual dose errors (difference between true and clinical deformations) and the predicted uncertainty (mean of the dose mapping errors as defined in Equation 2) by the AUTODIRECT workflow. These examples demonstrate the ability of AUTODIRECT to capture the dose transfer uncertainty without knowing the actual errors.

Spatial dose mapping uncertainty: True warped dose (first column), actual error between true warped dose and dose warped by 2 clinical deformable image registrations (DIRs; second and fourth columns), and automated deformable image registration evaluation of confidence tool (AUTODIRECT)-predicted dose (third and fifth columns) for prostate, CSI, HN phantom 1, and HN phantom 9 cases, respectively.
The resulting uncertainty is employed to estimate the error bars in the form of the DVHs for critical structures and the target volumes, as seen in Figure 5. The representative DVHs in Figure 5 represent organs at risk that receive relatively high doses in regions of deformations, as well as targets. The predicted error bars (dashed-dotted, red) mostly encompass the true deformed dose (solid, black) for the given structures.

True warped dose (black, solid), dose warped by the clinical deformation (green, dashed) and range of warped dose estimated by automated deformable image registration evaluation of confidence tool (AUTODIRECT) at 95% confidence interval (CI; red, dashed-dotted) for (A, B) prostate and bladder contours in prostate phantom, (C, D) brainstem and spinal cord contours in CSI phantom, and (E, F) planning target volume, (PTV) and parotid gland contours in HN phantom4 data sets.
Lung Landmarked Image Study
The AUTODIRECT workflow with Velocity and Plastimatch clinical DIRs produced the resulting error distributions in Figure 6, respectively, for the 3 lung patient data set with 300 landmarks. As stated earlier, the errors include an estimate of the inherent placement error by simulating uniform random noise multiplied by the dose gradient. Due to the small number of samples, the error distributions were noisy relative to the results of the virtual phantom study. Importantly, however, the outlines tend to be close to the theoretical t distribution for the 3 lung cases with both B-spline clinical DIRs.
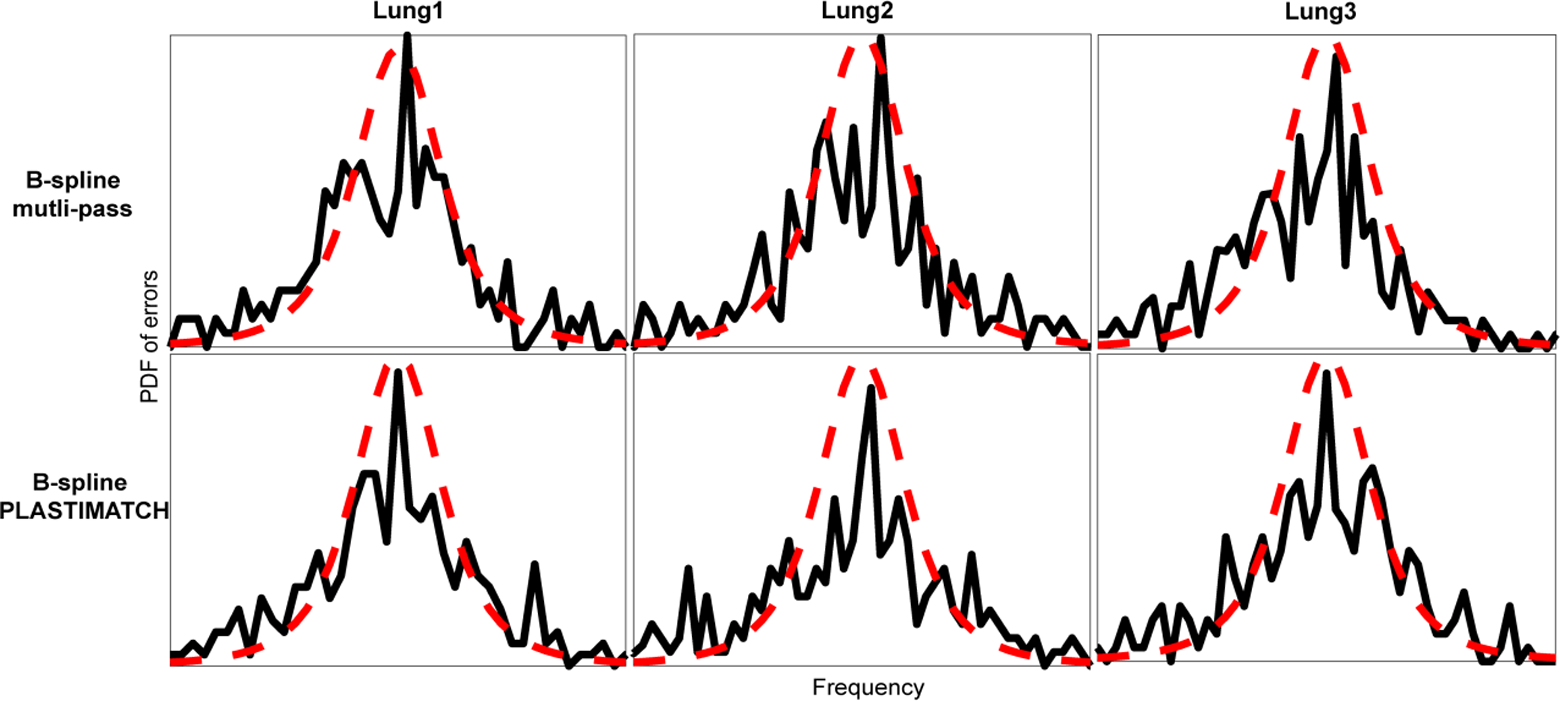
Probability density functions of errors in 3 pairs of real lung images with 300 landmarks from automated deformable image registration evaluation of confidence tool (AUTODIRECT; first row) Velocity B-spline multipass, and (second row) B-spline Plastimatch deformable image registrations (DIRs) were used (dotted in red: t distribution, solid in black: predicted by AUTODIRECT).
Discussion
An AUTODIRECT is an automated software tool that was proposed to predict patient-specific dose mapping accuracy for a clinical DIR. This study verified the accuracy of the dose mapping uncertainty estimates provided by the workflow using 12 virtual/physical phantoms. The workflow was also tested on 3 clinical lung data sets with 300 landmarks. For the virtual/physical phantoms with known deformation, the true dose error distributions closely followed the t distribution predicted by AUTODIRECT. The predictions of the uncertainty for the lung patient data set with 300 landmarks were qualitatively close to the true error distribution. The validation in terms of the proximity of the dose mapping error to the theoretical one is significant, as stated, since the true deformation is not known for prospective patient analysis. The results above demonstrate that our proposed framework may provide clinically important information that is currently missing from existing platforms. In particular, we believe this information could be valuable to physicians evaluating composite dose distributions for patients undergoing retreatment with radiation.
The 4 test deformations (Dt, i) play a crucial role in predicting the spatial uncertainty of the DIRs. The initial proof-of-principal work 24 on AUTODIRECT also used 4 generator algorithms: 2 B-spline-based, 1 demons-based, 28 and 1 rigid registration. The specific demons DIR algorithm used in that study was shown to skew DIR uncertainty predictions, resulting in overestimates. Also, the rigid registration was shown to be a reasonable test deformation, yielding predicted errors that were similar to the actual ones. For this reason, the current version adopted 3 B-spline and 1 rigid registration as the test deformations. The B-spline test deformations captured the essence of the ground-truth warping, with deformations in similar locations and of similar magnitude. This test DIR set is shown here to create accurate dose warping uncertainty estimation, as identified in the 12 phantom studies and the 3 patient data sets. It is important to note that this set of test deformations is not universally optimal for all clinical DIR algorithms. Some additional analyses (results not shown) were also performed using a demons-based DIR as the clinical DIR (Ac). In these cases, the predicted error distributions were also overestimated. These dose uncertainty overestimates were as much as 60% for some of the benchmarks in the initial proof-of-principle work. Thus, it may be important to customize the test DIR algorithms employed by AUTODIRECT for the clinical DIR algorithm being used.
It is important to also address the computation burden of this technique. This burden can be divided into 4 different parts: creating the test deformations, creating the test image sets from these deformations, applying the clinical DIR algorithm to the test image sets, and a final analysis to compute the statistical parameters. For the current implementation of AUTODIRECT, these steps take 140, 180, 140, and 80 seconds, respectively (9 minutes total). This computation was timed for a Windows desktop computer with an Intel Xeon E5-1620 v3 processor and 32 GB of random-access memory, (RAM).
Based on the validation performed in this work, the AUTODIRECT workflow shows promise for estimating DIR dose warping uncertainty when transferring dose from one planning CT to another. There are, however, some limitations to the current validation study. The virtual phantoms were created by manually applying reasonable estimates for typical anatomical deformations that occur in patients. In cases, such as weight loss, there is some uncertainty in the true nature of the underlying anatomical deformation. In cases, such as bladder and rectal filling, the DVF is ill-defined in some regions. In these cases, the validation testing results really are only an indication that AUTODIRECT calculations match well with the assumptions made when creating the virtual phantoms. An additional limitation for the virtual phantom validations is that they were produced with synthetic splines and both the test and clinical DIR algorithms utilized splines for warping. This has the potential to skew the produced DIR error predictions. For this reason, the physical phantom and the lung data sets are crucial to this study. Another limitation of the current AUTODIRECT platform is that the image processing is most appropriate for fan-beam, kilo-voltage CT imaging. Work is ongoing to extend the AUTODIRECT process to imaging typically used during image-guided radiotherapy to enable its use for adaptive therapy applications.
Conclusion
Tested on 12 virtual and physical phantoms and 3 pair of lung images from a real patient, the AUTODIRECT framework was found to reliably estimate the DIR-driven dose mapping errors for 2 widely available B-spline algorithms. Thus, the AUTODIRECT workflow shows promise for providing clinically important information on the uncertainty of a deformed dose distribution.
Footnotes
Abbreviations
Acknowledgments
Prof. Jean Pouliot made vital contributions to the conception and design of this study. The authors would like to thank Oncology Systems Limited for their help.
Declaration of Conflicting Interests
The author(s) declared the following potential conflicts of interest with respect to the research, authorship, and/or publication of this article: H. Kim, J. Chen, and N. Kirby have a pending patent application on the AUTODIRECT technology.
Funding
The author(s) disclosed receipt of the following financial support for the research, authorship, and/or publication of this article: This work was supported by the National Center for Research Resource and the National Center for Advancing Translational Sciences, National Institutes of Health, through the UCSF Clinical and Translational Science Institute (CTSI) Grant Number UL1 TR000004. Its contents are solely the responsibility of the authors and do not necessarily represent the official views of the NIH.