
Abstract
Background:
The clinical significance of miR-141-3p in hepatocellular carcinoma has not been verified. Therefore, we conducted this study to examine miR-141-3p expression and its clinical significance in hepatocellular carcinoma and to investigate the functions of its potential targets.
Methods:
The Cancer Genome Atlas database and the Gene Expression Omnibus database were used to explore the aberrant expression of miR-141-3p in hepatocellular carcinoma. Furthermore, we assessed the miR-141-3p levels in 95 hepatocellular carcinoma tissues with 95 matched adjacent tissues using real-time quantitative polymerase chain reaction. Moreover, a target gene prediction analysis of miR-141-3p, a natural language processing analysis for hepatocellular carcinoma using PubMed, and a gene functional enrichment analysis were conducted to search the potential function of miR-141-3p in the pathogenesis of hepatocellular carcinoma.
Results:
Regarding The Cancer Genome Atlas data, miR-141-3p levels were markedly downregulated in hepatocellular carcinoma tissue compared to para- or nontumor tissue (4.6112 [1.7096] vs 5.3053 [1.4254], P = .045). MiR-141-3p expression was reduced in patients with hepatocellular carcinoma with a low pathologic T stage (P = .006), a low grade (P = .01), elderly hepatocellular carcinoma patients (P = .001), and male patients with hepatocellular carcinoma (P = .01) compared with that in patients with hepatocellular carcinoma with high pathologic T stages, high grades, young patients with hepatocellular carcinoma, and female patients with hepatocellular carcinoma. However, according to the Gene Expression Omnibus database, no significant differences in the expression of miR-141-3p were observed between hepatocellular carcinoma tissue and normal liver tissue (P = .984). Real-time quantitative polymerase chain reaction confirmed a similar trend of decreased miR-141-3p in hepatocellular carcinoma tissue (1.7542 [0.8663] vs 2.5562 [1.7913], P = .001) as observed in The Cancer Genome Atlas. In addition, decreased miR-141-3p levels were detected in the multiple tumor nodes group (P = .004), the metastasis group (P < .001), and the advanced TNM stage group (P = .01), compared to the single tumor nodes group, the nonmetastasis group, and the early TNM stage group. Two hundred eighty-two genes were identified from the overlap between the predicted targets and the natural language processing analysis. Gene ontology and Kyoto Encyclopedia of Genes and Genomes pathway analyses revealed several significant biological functions and pathways related to the pathogenesis of cancers, including hepatocellular carcinoma.
Conclusion:
Downregulation of miR-141-3p might be responsible for the carcinogenesis and aggressiveness of hepatocellular carcinoma. MiR-141-3p may act as an antitumor microRNA, which is essential for hepatocellular carcinoma progression through the regulation of various signaling pathways. Thus, interactions with miR-141-3p may provide a novel strategy for hepatocellular carcinoma treatment in the future.
Introduction
Hepatocellular carcinoma (HCC), a common malignancy in China, has an increased incidence and a poor prognosis. 1,2 Over the past few decades, great progress has been made in the treatment of HCC, including surgery, interventional therapy, radiotherapy, chemotherapy, and molecular target treatment. However, the prognosis of HCC is still unfavorable. 3,4 Therefore, it is necessary to identify highly stable and specific molecular targets to facilitate early diagnosis of HCC and allow targeted therapy to improve the prognosis of HCC.
MicroRNAs (miRNAs), which are approximately 22 nucleotides in length, belong to a large family of noncoding, single-stranded RNAs. Increasing evidence indicates that miRNAs participate in cell growth, apoptosis, and cell proliferation. 5,6 It has been reported that miRNAs contribute to carcinogenesis and the progression of cancers by positive or negative regulation of the hub genes involved in the pathogenesis of cancers. 7,8 Two studies have demonstrated a downregulation of miR-141-3p expression in HCC tissues. 9,10 However, these 2 studies have several limitations—unmatched analysis of miR-141-3p expression in HCC and limited sample size, which may lead to a false-positive conclusion. Therefore, it is necessary to validate the aberrant expression of miR-141-3p in HCC tissue with a matched analysis to eliminate the unrelated parameters.
In this current study, we examined the miR-141-3p level in HCC and its clinical significance for the diagnosis and prediction of prognosis in HCC. Moreover, the prospective mechanisms of the pathogenesis of HCC were analyzed by identifying the potential target genes of miR-141-3p and performing a gene functional enrichment analysis.
Materials and Methods
Patients and Samples
We selected 95 patients with HCC and matched adjacent nontumor tissues from 75 men and 20 women with a mean age of 50. The patients had not received any adjuvant therapy before undergoing surgery between March 2010 and March 2012 at the First Affiliated Hospital of Guangxi Medical University. There were 22 patients with HCC in early TNM stage (I+II) and 73 patients in advanced TNM stage (III+IV). Forty-nine cases existed metastasis, 32 cases had portal vein tumor embolus, 36 cases had vaso-invasion, and 50 cases achieved cirrhosis. Two pathologists independently confirmed all of the pathological diagnoses, and we gained the approval of the use of the patients’ tissue samples for this study.
MiR-141-3p Expression in HCC in The Cancer Genome Atlas
The Cancer Genome Atlas (TCGA) database was used to examine miR-141-3p expression in HCC tissues. In addition, miR-141-3p expression in patients with HCC with various clinicopathological characteristics was also analyzed. In TCGA database, level 3 data of the miRNA profile of HCC were extracted. Meanwhile, the corresponding clinical data for HCC were obtained. Afterward, the miR-141-3p expression was extracted from the miRNA profile, and statistical analyses were conducted to estimate the expression of miR-141-3p in HCC and to explore the relationships between miR-141-3p expression and various clinicopathological factors.
MiR-141-3p Expression in HCC in the Gene Expression Omnibus
In the Gene Expression Omnibus (GEO) database including the GEO data set and GEO profile, we searched for miR-141-3p expression in HCC using the following key words: (1) hepatocellular OR liver OR hepatic OR HCC, (2) malignan* OR cancer OR tumor OR tumour OR neoplas* OR carcinoma, and (3) microRNA OR miRNA OR miR. The microarrays were included to examine miR-141-3p expression in HCC tissues and noncancerous tissues and to explore miR-141-3p expression in different clinicopathological features of HCC.
A meta-analysis was performed with Stata version 12.0, which combined the miR-141-3p expression data from the real-time quantitative polymerase chain reaction (qRT-PCR), the microarray data of the GEO database, and the RNA sequencing data of the TCGA database in different tissues. Standard mean difference (SMD) and a 95% confidence interval (95% CI) were used to assess miR-141-3p expression in different tissues. Moreover, a Q test (χ2 test) and I 2 statistics were performed to estimate the heterogeneity among the eligible studies. A Mantel-Haenszel fixed-effects model was performed if no obvious heterogeneity exists among the pooled studies (I 2 < 50% and P > .1). However, a random-effects model was utilized when obvious heterogeneity was observed among the studies (I 2>50% or P < .1). 11
Real-Time Quantitative Polymerase Chain Reaction
The qRT-PCR protocol has been described previously. A combination of RUN6B and RUN48, which has been shown to be a stable internal control in our previous studies, was used as a reference to detect miR-141-3p levels. 12 –14 The RNU6B, RNU48, and miR-141-3p primers were included in the TaqMan MicroRNA assays (4427975, Applied Biosystems, Life Technologies, Grand Island, New York), and their sequences are as follows: miR-141-3p, UAACACUGUCUGGUAAAGAUGG; RNU6B, CGCAAGGAUGACACGCAAAUUCGUGAAGCGUUCCAUAUUUUU; RNU48, GAUGACCCCAGGUAACUCUGAGUGUGUCGCUGAUGCCAUCACCGCAGCGCUCUGACC. The expression level of miR-141-3p was calculated by formula 2−Δcq.
MicroRNA Target Prediction
Twelve databases were used for the target prediction of miR-141-3p, including miRWalk, Microt4, miRanda, mirbridge, miRDB, miRMap, miRNAMap, Pictar2, PITA, RNAhybrid, Targetscan, and miRWalk2.0. 15 Three databases (miRecords, miRTarbase, and Tarbase) were searched for the validated targets of miR-141-3p. Next, further gene functional enrichment analysis was conducted on a combination of the predicted target genes of miR-141-3p that were reported in more than 4 databases and the validated genes of miR-141-3p that had strong evidence.
Natural Language Processing Analysis of HCC-Related Studies
We searched the PubMed database with the following keywords: (1) hepatocellular OR liver OR hepatic OR HCC and (2) malignan* OR cancer OR tumor OR tumor OR neoplas* OR carcinoma. We extracted all of the related genes in the studies via using Biomedical Named Entity Recognizer (http://pages.cs.wisc.edu/∼bsettles/abner/).
In the natural language processing (NLP) analysis, we counted the frequency of each gene that merged with the eligible studies in PubMed. A greater frequency indicated a higher likelihood of correlation between that particular gene and HCC. In PubMed, the total number of relevant studies was marked as “N,” the frequency of the related genes and HCC in PubMed was marked as “m” and “n,” and the simultaneous occurrence of the disease and a certain gene was marked as “k.” The probability of frequency greater than “k” cocitations was calculated with random conditions through hypergeometric distribution. A P value of less than .01 was considered statistically significant. The formula for the NLP analysis was as follows:

Gene Functional Enrichment Analysis
Gene ontology (GO), including biological process, molecular function, and cellular component, was conducted using DAVID (Database for Annotation, Visualization and Integrated Discovery) database. 16 Cytoscape software (version: Cytoscape 3.3.0) and BINGO plugins were used to generate the graphical display of the GO network. The protein-to-protein network analysis was performed using STRING (version: STRING 10.0). 17 The database of the Kyoto Encyclopedia of Genes and Genomes (KEGG) was also applied to reflect the prospective biological pathways of HCC which the targets of miR-141-3p were involved in.
Statistical Analysis
We performed the statistical analyses using SPSS version 22. We made use of mean (standard deviation [SD]) to present the quantitative data of miR-141-3p expression. Student t tests were performed for the analysis of miR-141-3p expression between 2 groups, and 1-way ANOVA (Analysis of Variance) was employed when more than 2 groups were analyzed. Additionally, we drew receiver operating characteristic (ROC) curves to measure the power of miR-141-3p in HCC diagnosis. Spearman analysis was also conducted to estimate the associations between miR-141-3p and clinical characteristics. A P < .05 was considered statistically different.
Results
MiR-141-3p Expression in HCC Based on TCGA
Regarding TCGA data, lower miR-141-3p levels were detected in 352 HCC tissues compared to 50 adjacent normal liver tissues, but no statistic difference was gained (P = .054). However, when we matched the HCC tissues with corresponding adjacent normal liver tissues (49 pairs), significant downregulation of miR-141-3p levels was observed in HCC tissues (4.6112 [1.7096]), as compared to the adjacent normal liver tissues (5.3053 [1.4254], P = .045; Figure 1A). The P value of the diagnostic power was .003 (area under the curve [AUC] = 0.677, 95% CI: 0.571-0.784; Figure 2A). The relationships between miR-141-3p and the clinicopathological characteristics from TCGA are presented in Table 1.

MiR-141-3p expression in HCC tissues and nontumor liver tissues. A, A comparison of miR-141-3p levels in 49 HCC tissues and 49 nontumor tissues in the TCGA database. P = .045. The expression level of miR-141-3p in TCGA data was normalized using a logarithm. B, A comparison of miR-141-3p levels in 95 pairs of HCC tissues and adjacent nontumor tissues using qRT-PCR. P < .001. HCC indicates hepatocellular carcinoma; qRT-PCR, real-time quantitative polymerase chain reaction; TCGA, The Cancer Genome Atlas.
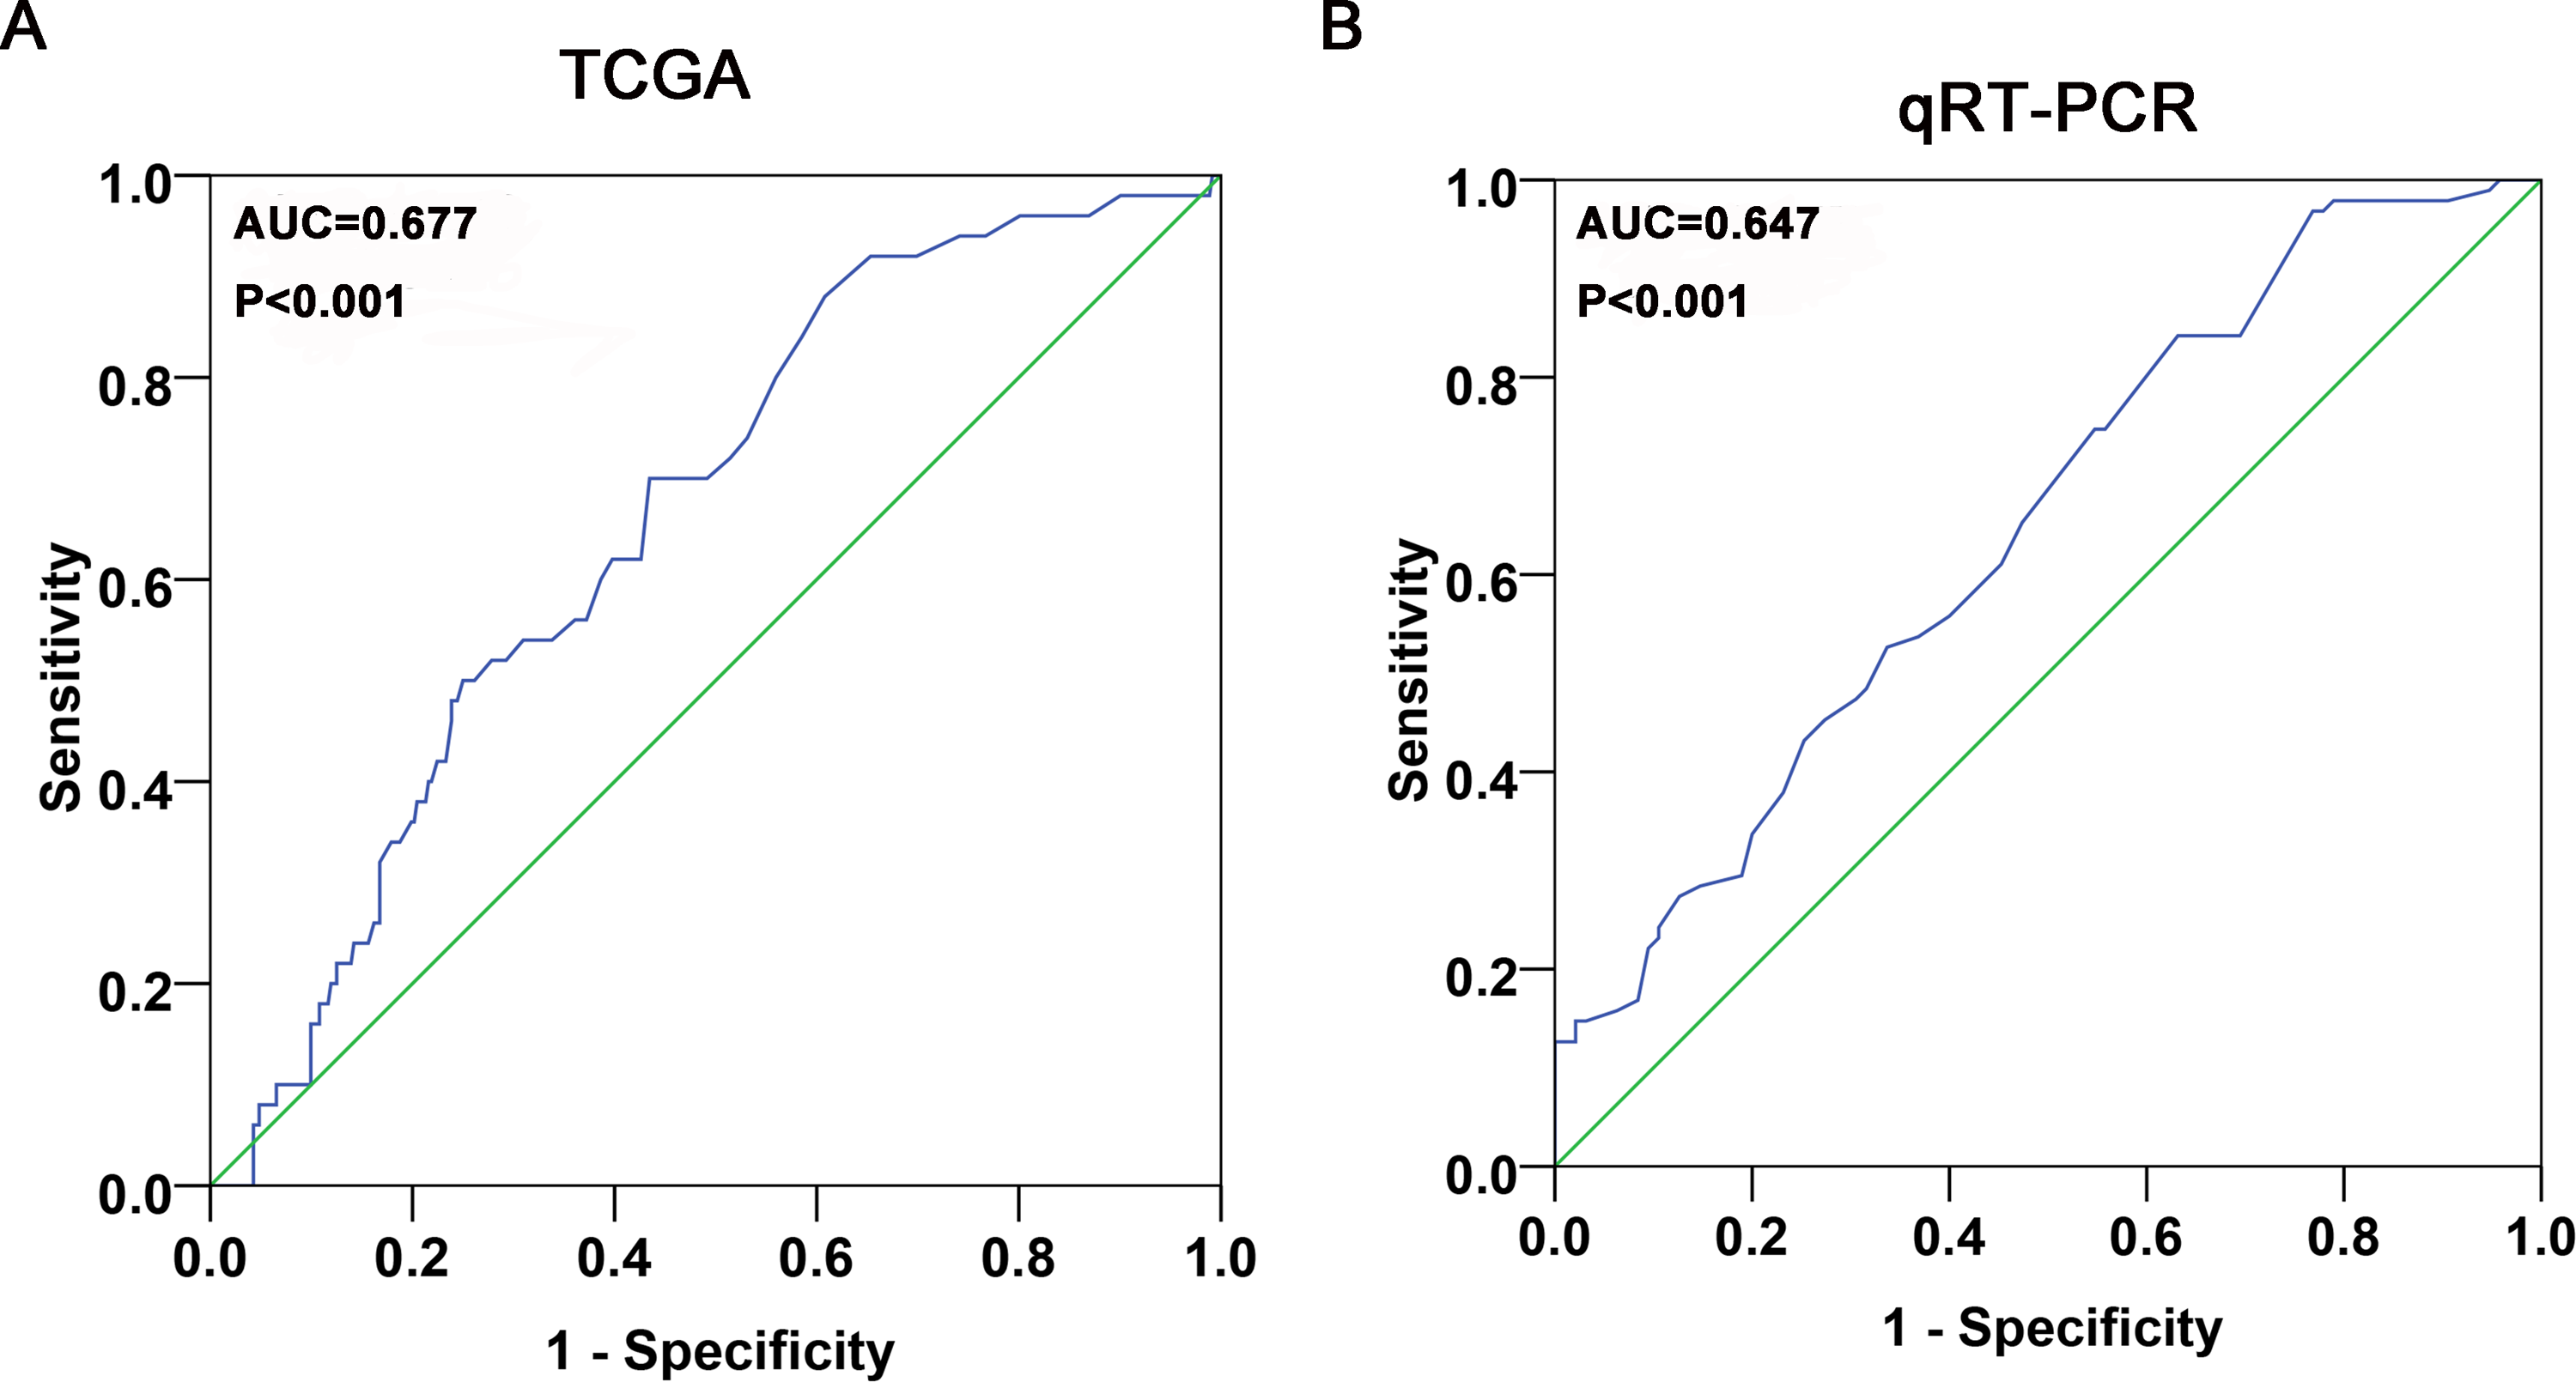
Diagnostic value of miR-141-3p in HCC. A, The ROC curve of miR-141-3p expression was used to assess its diagnostic value in HCC based on TCGA data. AUC = 0.677 (95% CI: 0.571-0.784, P = .003). B, The ROC curve of miR-141-3p expression by qRT-PCR was used to assess its diagnostic value in HCC. AUC = 0.647 (95% CI: 0.570-0.724, P < .001). AUC, area under the curve; HCC indicates hepatocellular carcinoma; ROC, receiver operating characteristic; qRT-PCR, real-time quantitative polymerase chain reaction.
Expression of miR-141-3p and Clinicopathological Parameters in HCC in TCGA.

Abbreviations: AJCC, American Joint Committee on Cancer; HCC, hepatocellular carcinoma; SD, standard deviation; TCGA, The Cancer Genome Atlas.
aOnly 49 pairs were achieved for HCC tissues and corresponding matched adjacent noncancerous liver tissues because of missing data of miR-141-3p expression in a HCC tissue.
bOne-way ANOVA (Analysis of Variance) analysis was performed.
Meta-Analysis of miR-141-3p Expression in HCC
Regarding the differences in miR-141-3p expression between HCC and nontumor liver tissues, 7 studies of microarrays in the GEO database (GSE41874, GSE40744, GSE21362, GSE22058, GSE12717, GSE57555, and GSE6857), which involved 353 HCC with 453 nontumor liver tissues, were included in this meta-analysis. The pooled SMD of miR-141-3p was −0.006 (95% CI: −0.580 to 0.569, P = .984; Figure 3), and the P value of the heterogeneity test was <.001 (I 2 = 90.2%).
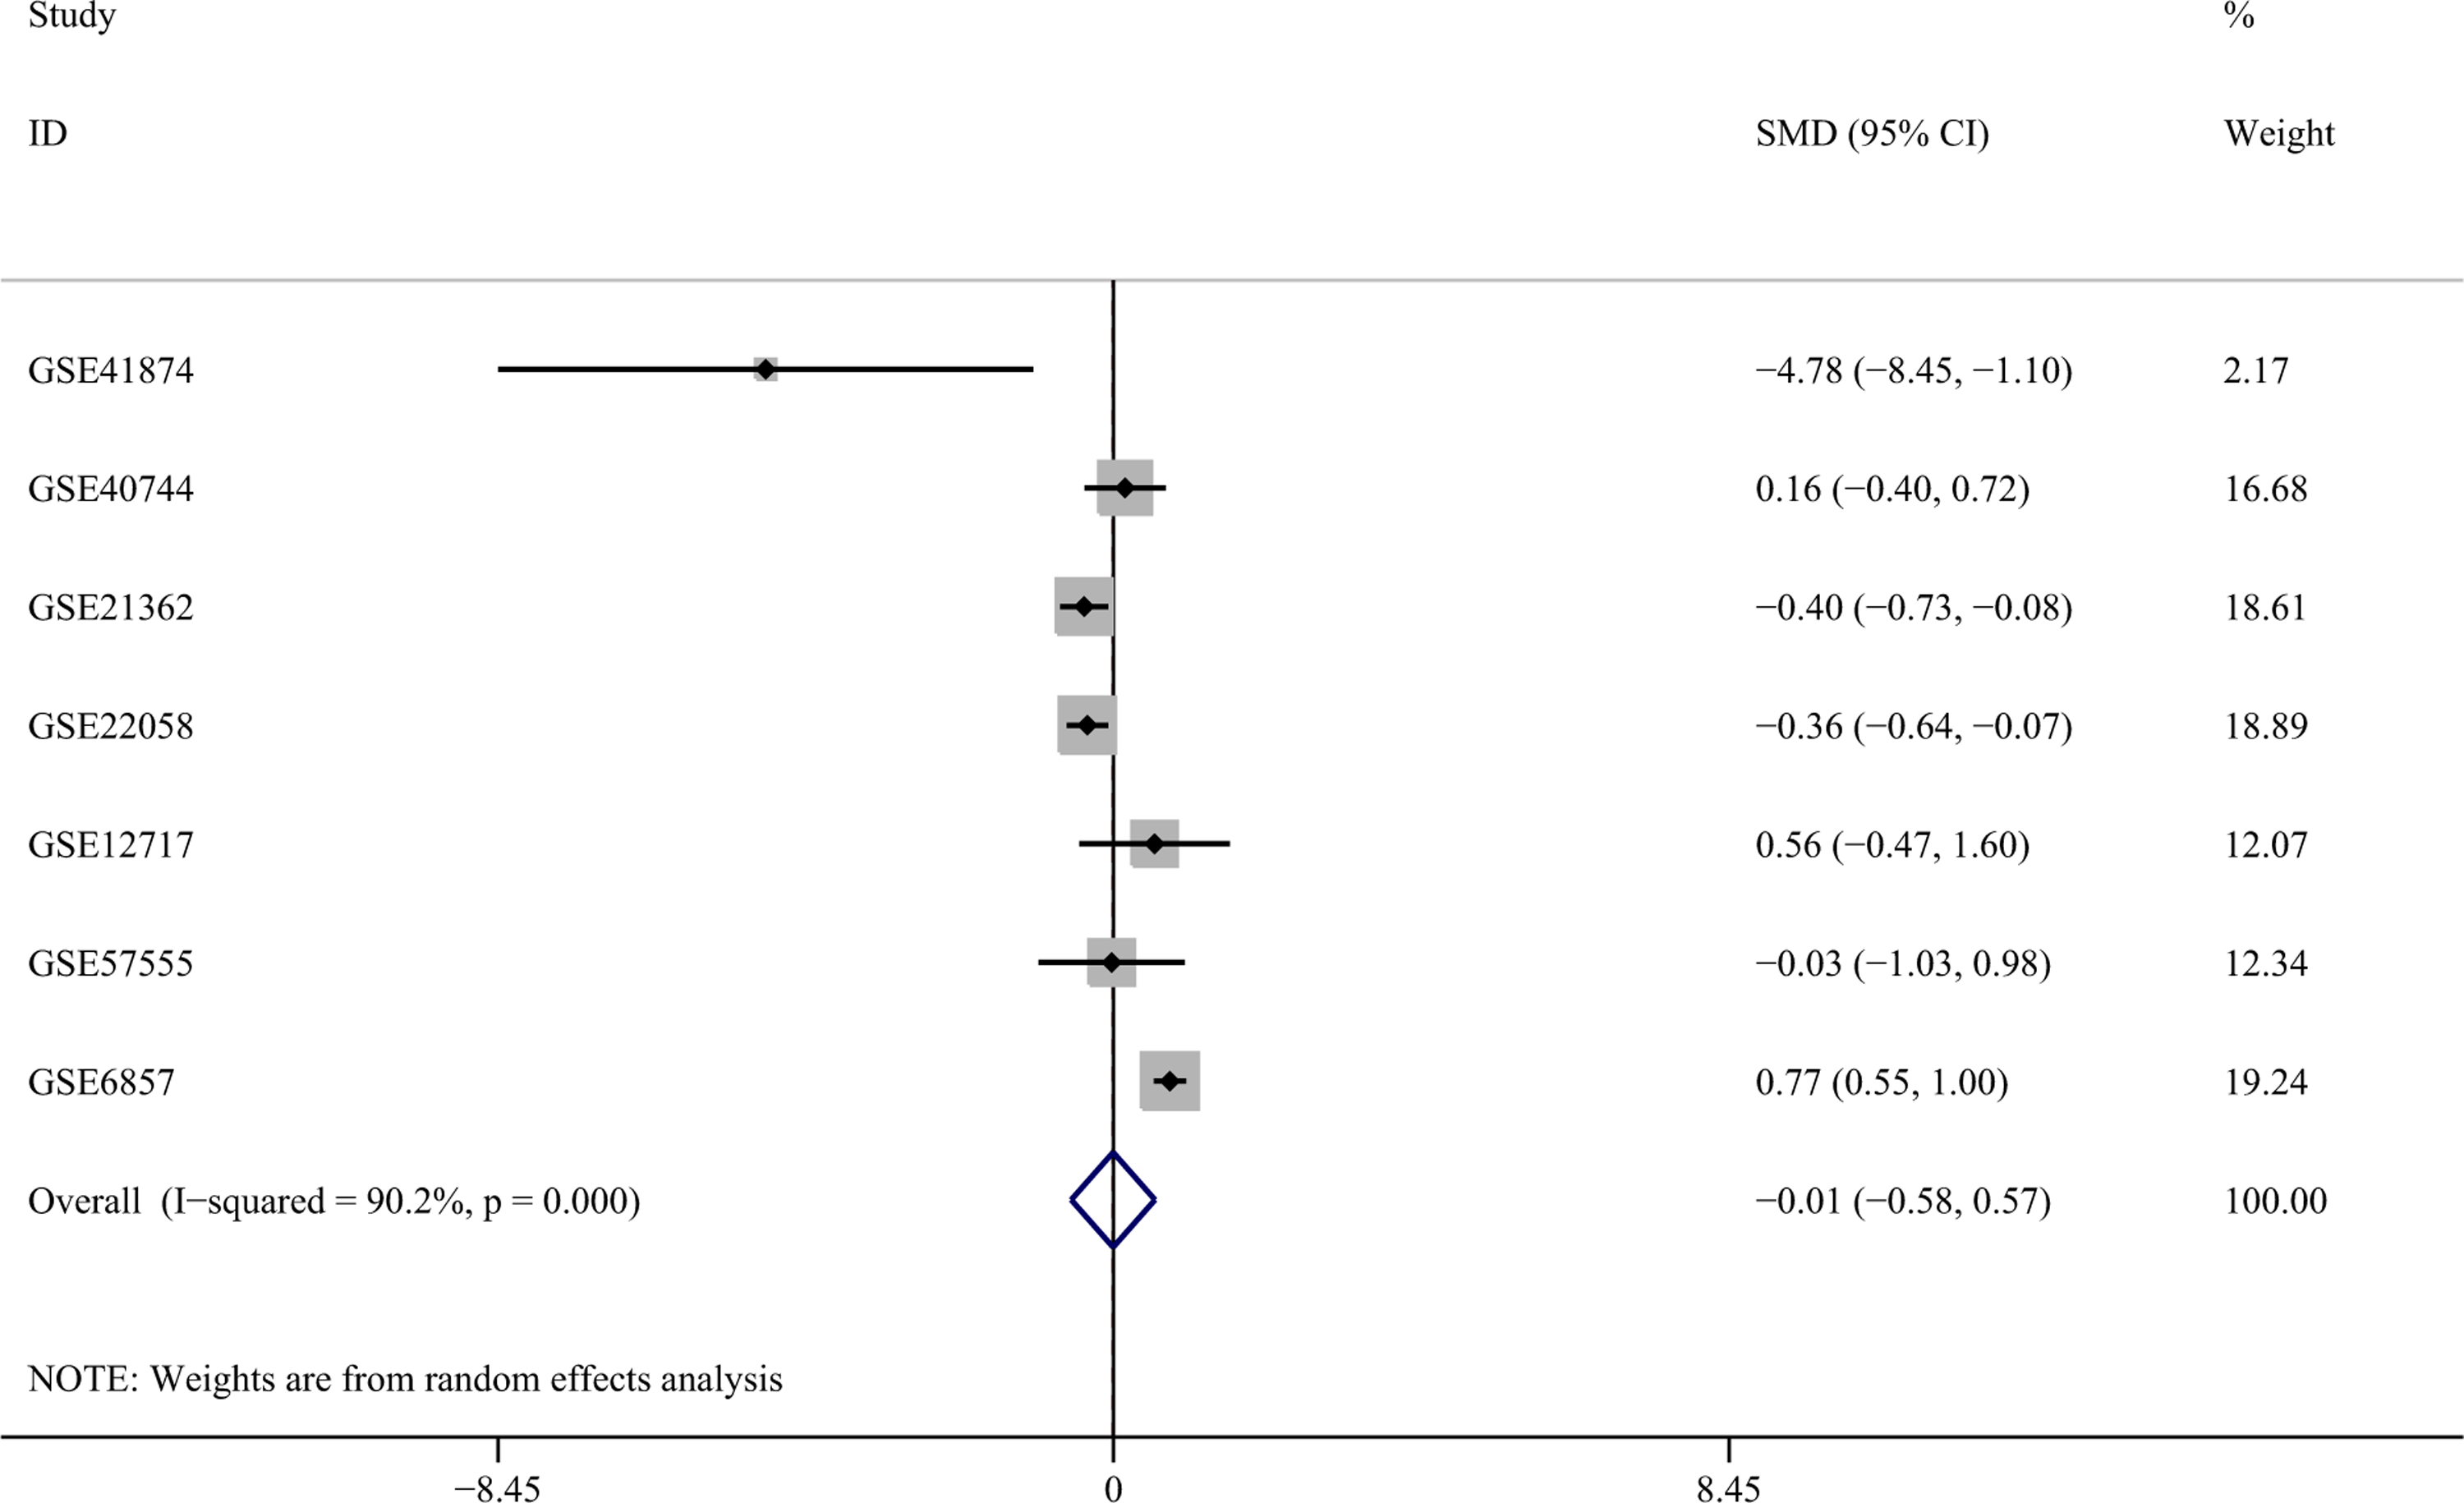
The forest plots of the meta-analysis of miR-141-3p expression in HCC using the GEO database. Seven studies were included in the GEO database, and the pooled SMD was −0.006 (95% CI: −0.580 to 0.569, P = .984) with the random-effects model. CI indicates confidence interval; GEO, Gene Expression Omnibus; HCC hepatocellular carcinoma; SMD, standard mean difference.
MiR-141-3p Expression in HCC Detected by qRT-PCR and Its Clinicopathological Significance
In contrast to the adjacent normal liver tissue (2.5562 [1.7913]), miR-141-3p was significantly underexpressed in HCC tissue (1.7542 [0.8663], P = .001; Table 2, Figure 1B). Meanwhile, based on the ROC curve, the AUC was 0.647 (95% CI: 0.570-0.724, P < .001; Figure 2B).
Expression of miR-141-3p and Clinicopathological Parameters in HCC in the 95 Pairs Detected by qRT-PCR.

Abbreviations: HCC, hepatocellular carcinoma; qRT-PCR; real-time quantitative polymerase chain reaction; SD, standard deviation.
aOne-way ANOVA analysis was performed.
All of the clinicopathological factors are shown in Table 2. Concerning the relationships between miR-141-3p and the clinicopathological characteristics in HCC tissues, we observed lower expression in the multiple tumor nodes group (1.4795 [0.8120]) compared to the single tumor node group (1.9813 [0.8509], P = .004; Figure 4A). Meanwhile, miR-141-3p was expressed at lower levels in tissues with metastases (1.4392 [0.7227]) than in HCC tissues without metastases (2.0898 [0.8873], P < .001; Figure 4B). Moreover, in the III-IV clinical TNM stage group, miR-141-3p was also significantly downregulated (1.6304 [0.8231]) compared to the stage I-II group (2.1650 [0.8978], P < .001, P = .01; Figure 4C). Furthermore, the HCC tissues with a portal vein tumor embolus had lower levels of miR-141-3p expression (2.2669 [1.1827]), while the tissues without a portal vein tumor embolus had higher expression levels of miR-141-3p (3.1146 [1.8511]) with a marginal P value of .05. The rest of clinicopathological characteristics of HCC had no significant correlation with miR-141-3p expression (Table 2).

MiR-141-3p expression detected by qRT-PCR in various clinicopathological states of HCC. A, Tumor nodes. B, Metastasis. C, TNM stage. HCC indicates hepatocellular carcinoma; qRT-PCR, real-time quantitative polymerase chain reaction.
In addition, Spearman analysis was used to assess the relationships between miR-141-3p and the clinicopathological parameters, and negative correlations were discovered between miR-141-3p and tumor nodes (r = −.350, P = .001), metastasis (r = −.418, P < .001), TNM (r = −.343, P = .001), or portal vein tumor embolus (r = −.273, P = .007). However, the correlations were relatively weak. No significant associations between the rest of the clinicopathological factors and miR-141-3p levels were noted.
Potential Target Genes of miR-141-3p
Twelve databases were searched to predict the potential targets of miR-141-3p. A total of 8201 genes were obtained from those databases, and 263 validated target genes were identified in a combination of the miRecords, miRTarbase, and Tarbase databases. Next, the genes reported in more than 4 databases were combined with the validated target genes, and finally, 2335 genes were selected to represent the targets of miR-141-3p. A flowchart of the prediction analysis was presented in Figure 5.

The flowchart of the gene functional enrichment.
Overlap of the Predicted Target Genes of miR-141-3p, the NLP Analysis, and Its GO Analysis
In the NLP analysis, we extracted 1800 significant HCC-related genes. After combining them with the genes of the predicted targets and the validated target genes of miR-141-3p, 282 significant genes were identified, and they were used for further GO analysis. In this 282 identified targets of miR-141-3p in HCC, the Pearson correlative analysis revealed that the expression of 7 targets showed relatively higher negative correlation with miR-141-3p (CES2: r = −.462, MYRIP: r = −.438, PEBP1: r = −.417, BCKDHB: r = −.313, PPARA: r = −.312, GLYATL1: r = −.312, and IRS2: r = −.306, all P < .001; Figures 6 and 7). In the GO analysis, there were 489 significant terms involving biological processes (P < .05). Among them, we observed regulation of cell proliferation, the enzyme-linked receptor protein signaling pathway, the transmembrane receptor protein tyrosine kinase signaling pathway, and response to organic substance (Table 3). Moreover, there were 33 terms involving cellular components (P < .05), and some of them were associated with the membrane-enclosed lumen, organelle lumen, nucleoplasm, nuclear lumen, intracellular organelle lumen, and so on (Table 3). Meanwhile, there were 59 significant terms involving molecular functions (P < .05) including transmembrane receptor protein tyrosine kinase activity, protein tyrosine kinase activity, protein kinase activity, enzyme binding, and so on (Table 3).

The correlation between miR-141-3p and 3 identified targets. A, CES2 (r = −.462, P < .001). B, MYRIP (r = −.438, P < .001). C, PEBP1 (r = −.417, P < .001). CES2, carboxylesterase 2; MYRIP, myosin VIIA and Rab interacting protein; PEBP1, phosphatidylethanolamine binding protein 1.

The correlation between miR-141-3p and 4 identified targets. A, BCKDHB (r = −.313, P < .001). B, PPARA (r = −.312, P < .001). C, GLYATL1 (r = −.312, P < .001). D, IRS2 (r = −.306, P < .001). BCKDHB, branched chain keto acid dehydrogenase E1 subunit beta; PPARA, peroxisome proliferator activated receptor alpha; GLYATL1, glycine-N-acyltransferase like 1; IRS2, insulin receptor substrate 2.
The GO Analysis of the Overlap Between Predicted Target Genes, Validated Targets of miR-141-3p, and NLP.a

Abbreviations: GO, gene ontology; NLP, natural language processing.
aIn the GO analysis of the overlap between NLP and predicted target genes of miR-141-3p, there were 489 available biological processes, 33 cellular components, and 59 molecular functions (P < .05). In this table, the first 5 terms of the GO analysis were shown.
Furthermore, we conducted BINGO analysis of the overlapping 282 genes from the predicted genes and validated target genes of miR-141-3p and the NLP. The results of the GO analysis are shown in Figures 8 to 10. In addition, a hub gene analysis was conducted using the protein–protein interactions, and the results are shown in Figure 11. In the network of the overlapping genes, several genes showed higher connectivity, including PTEN, SRC, PRKCA, PTGS2, and so on.

The BINGO analysis network: BP. Each node represents a biological process. A larger node means that more genes are participating in the process. All colored nodes indicate statistical significance (P < .05). The deeper color indicates a smaller P value for the biological process. White-colored nodes were used to connect the biological processes without statistical significance. In this figure, the terms with a P < 1.0E-09 are presented for better visualization. BP indicates biological processes. BINGO, Biological Networks Gene Ontology.

The BINGO analysis network: CC. Each node represents a biological process. A larger node means that more genes are participating in the process. All colored nodes indicate statistical significance (P < .05). The deeper color indicates a smaller P value for the biological process. White-colored nodes were used to connect the biological processes without statistical significance. CC indicates cellular components. BINGO, Biological Networks Gene Ontology.
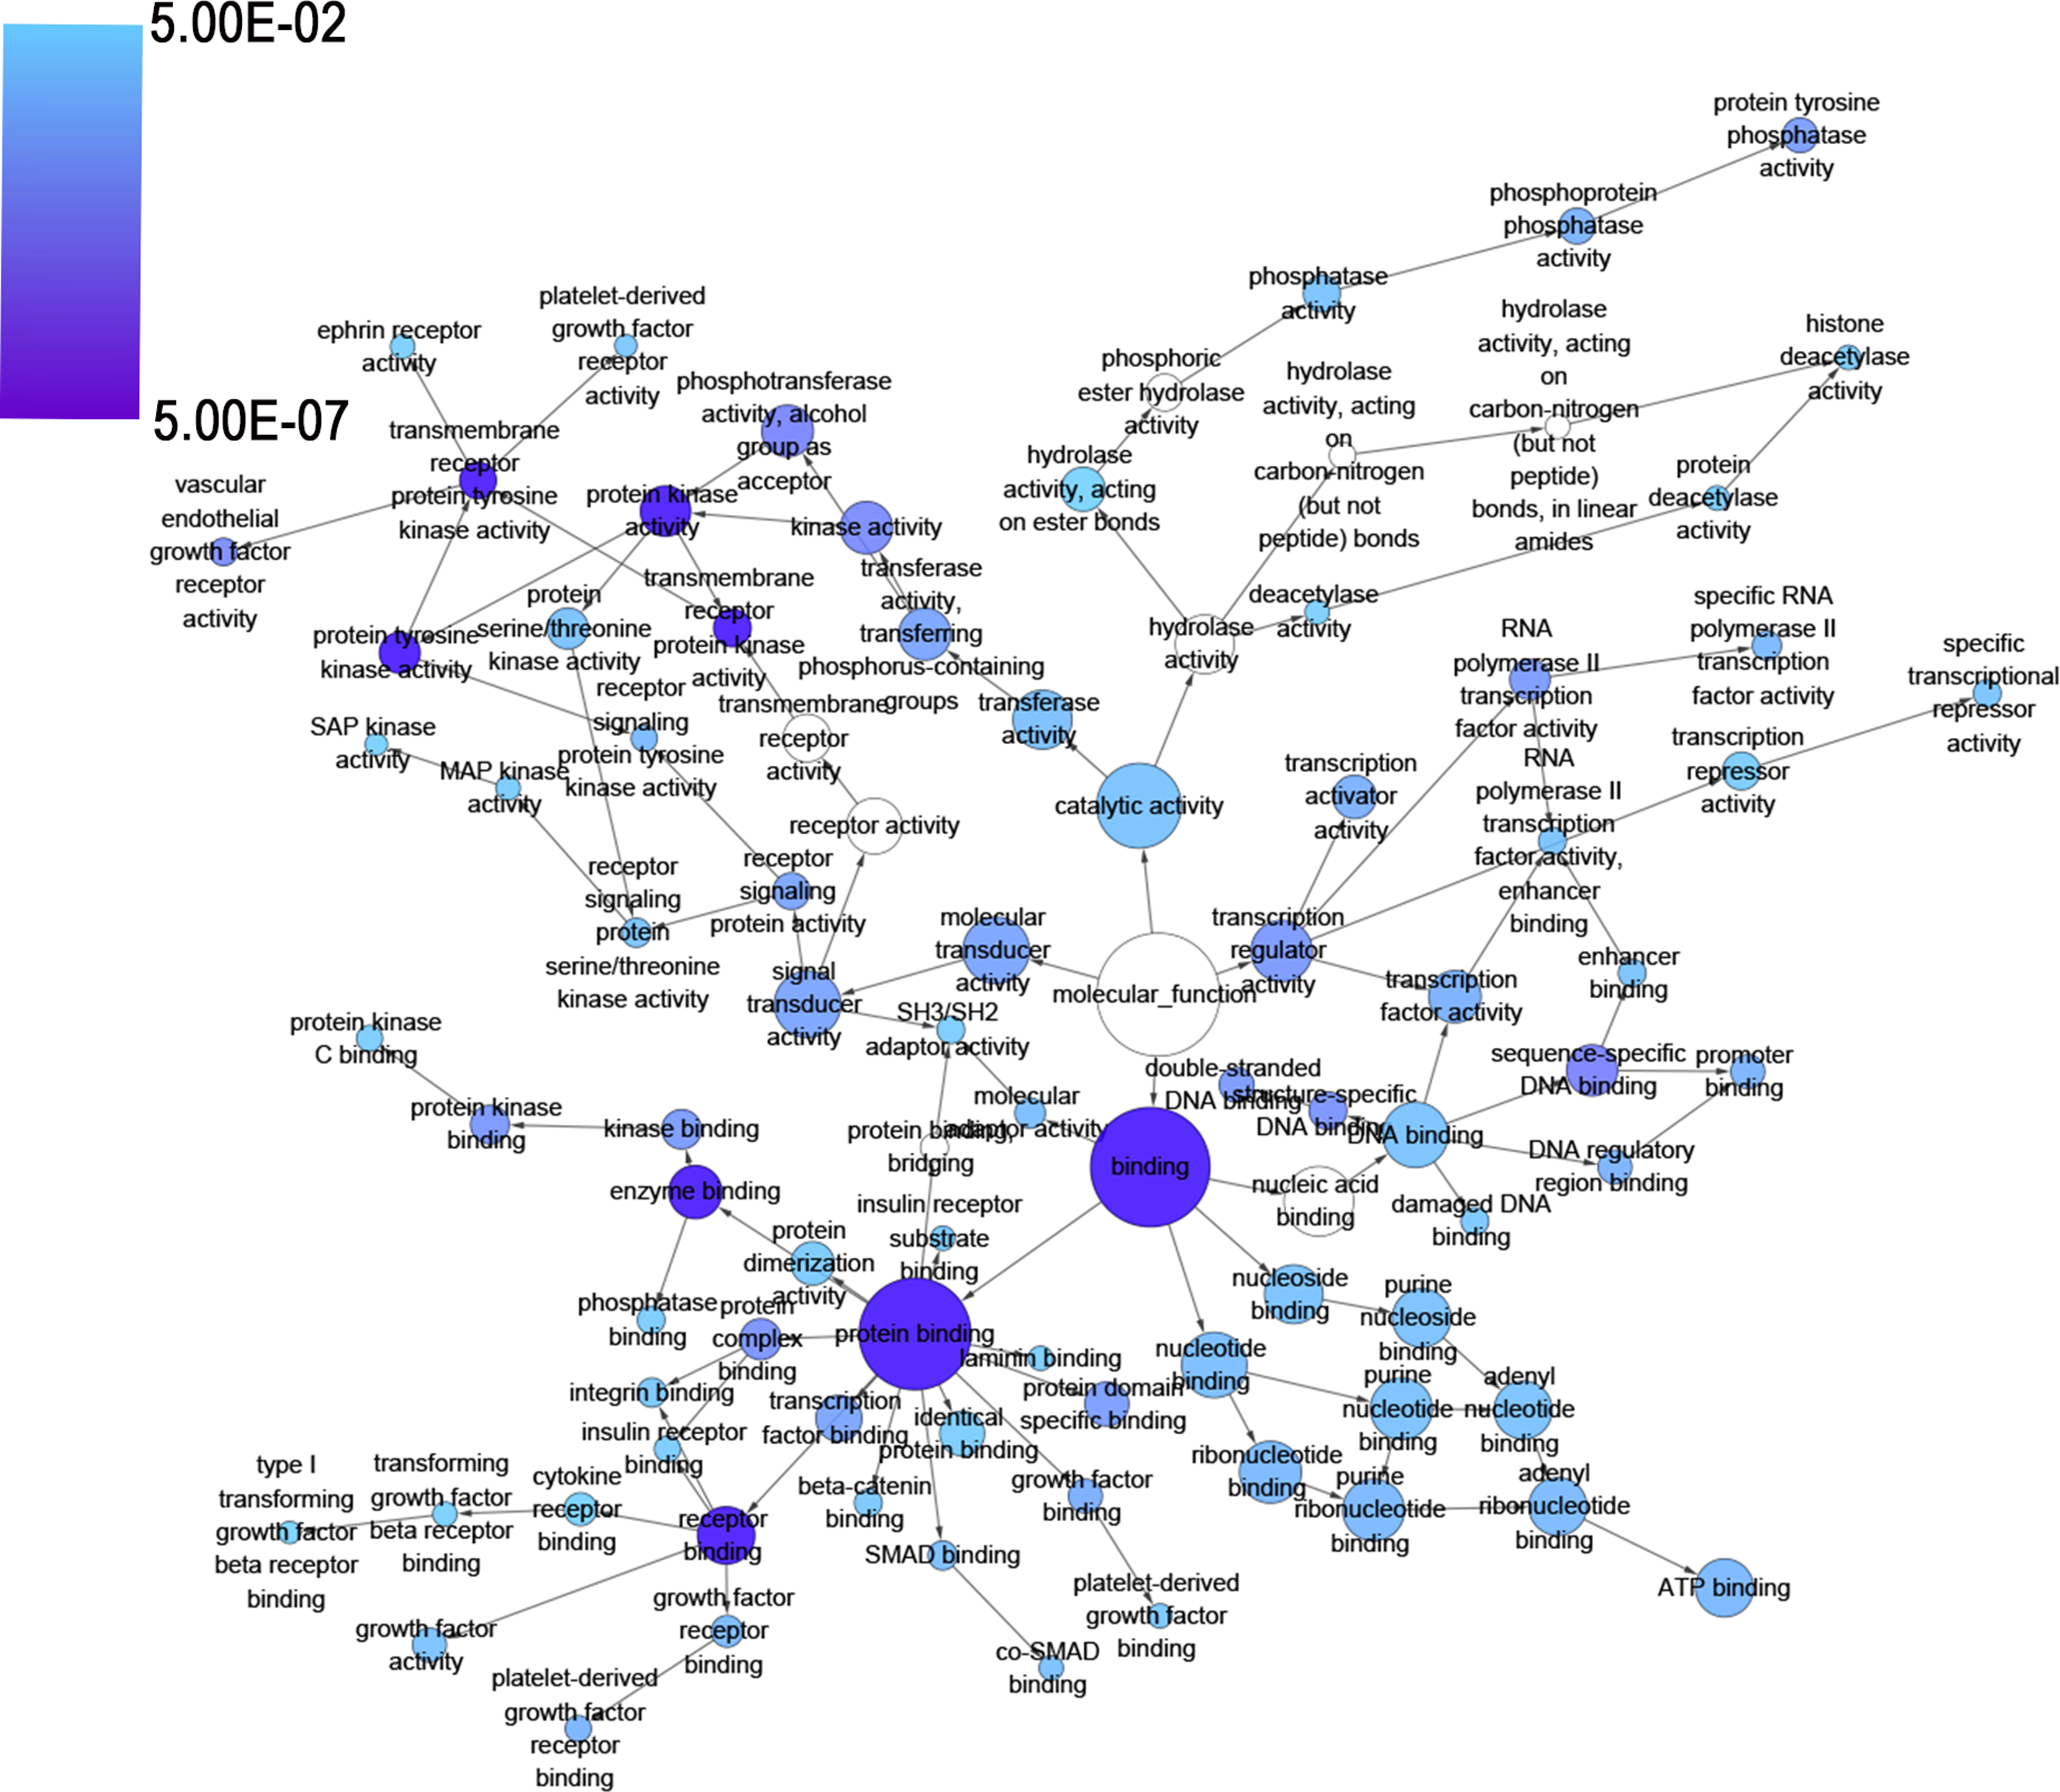
The BINGO analysis network: MF. Each node represents a biological process. A larger node means that more genes are participating in the process. All colored nodes indicate statistical significance (P < .05). The deeper color indicates a smaller P value for the biological process. White-colored nodes were used to connect the biological processes without statistical significance. MF indicates molecular functions. BINGO, Biological Networks Gene Ontology.

Protein–protein interaction of the overlapping genes between the predicted target genes of miR-141-3p and the NLP analysis. The protein-to-protein network analysis of the 178 overlapping genes of the predicted targets of miR-141-3p and the NLP analysis was performed using the STRING website. The nodes represent proteins, and each color corresponds to a cluster. The edges indicate the predicted functional associations, which are colored according to the types of predicted associations using different sets of evidence. The red, green, blue, purple, yellow, light blue, and black lines indicate fusion evidence, neighborhood evidence, co-occurrence evidence, experimental evidence, text-mining evidence, database evidence, and coexpression evidence, respectively. The line thickness indicates the strength of the evidence. NLP indicates natural language processing. STRING, search tool for recurring instances of neighbouring genes.
Pathway Analysis of the Overlapping Genes Between the Predicted Genes, the Validated Target Genes of miR-141-3p, and the NLP in KEGG
The overlapping 282 genes between the predicted genes and the NLP were also used for pathway analysis in KEGG. There were 39 available pathways, and 34 signaling pathways were selected (P < .05; Table 4) including pathways in cancer (FGFR1, E2F3, PTGS2, XIAP, GRB2, PDGFA, NFKBIA, KITLG, GLI2, PTEN, TGFB2, CCNE2, KRAS, ITGAV, AXIN1, EGFR, PRKCA, RET, CTBP2, RALBP1, MSH2, CBL, TGFBR2, CYCS, CDK6, SMAD2, HGF, CTNNA1, CDK2, MAPK1, CRKL, CDKN1B, HDAC2, ITGA6, PDGFRA, MAPK9, PDGFRB, PTCH1, P = 1.45 × 10⁻¹²), focal adhesion (PRKCA, E2F1, MAPK1, E2F3, BRAF, CDK6, CDK4, PTEN, AKT2, P = 1.06E-05), the ErbB signaling pathway (PRKCA, CDC42, MAPK1, CAV1, FLT1, BRAF, XIAP, CCND2, BCL2, ITGAV, RAC1, FIGF, PTEN, FN1, AKT2, P = 1.18E-05), the MAPK signaling pathway (PRKCA, E2F1, MAPK1, E2F3, BRAF, CDK6, CDK4, AKT2, P = 1.88E-05), the cell cycle (E2F1, MAPK1, E2F3, BRAF, CDK4, FIGF, MMP2, P = 2.52E-05), and so on (Table 4).
Pathway Analysis of the Overlap of NLP Analysis, Predicted Target Genes, and Validated Targets of miR-141-3p in KEGG.a

Abbreviations: KEGG, Kyoto Encyclopedia of Genes and Genomes; MAPK1, Mitogen-Activated Protein Kinase 1; NLP, natural language processing.
aThe pathway analysis was performed in KEGG database, and there were 39 available pathways. Among them, 34 signaling pathways were significant (P < .05), and the top 10 pathways are shown in this table.
Pathway Analysis of the Overlapping Genes Between the Predicted Genes, the Validated Target Genes of miR-141-3p, and the NLP in Panther
In the Panther database, 16 available pathways were reported, and 13 signaling pathways were significant (P < .05) including several vital pathways related to carcinogenesis and cancer progression, namely angiogenesis (PRKCA, FGFR1, PDGFA, GRB2, MAP2K4, JAG1, SRC, EPHB1, PTPN11, KDR, NOTCH2, MAPK1, STAT4, EPHA7, CRKL, KRAS, MAPK14, ARHGAP1, PDGFRA, MAPK9, PDGFRB, FRS2, AXIN1, P = 2.60E-05), the p53 pathway (E2F3, CCNG1, CDC25C, PTEN, SIRT1, ATM, CDK2, CDC25A, CCNE2, YWHAG, HDAC2, TNFRSF10B, SERPINE1, THBS1, P = 6.00E-04), the EGF receptor signaling pathway (PRKCA, EGFR, ERBB4, GRB2, CBL, MAP2K4, ATM, MAPK1, YWHAG, STAT4, KRAS, MAPK14, MAPK9, PEBP1, MAP2K7), and so on (Table 5).
Pathway Analysis of the Overlap of NLP Analysis, Predicted Target Genes, and Validated Targets of miR-141-3p in Panther.a

Abbreviations: EGF, epidermal growth factor; FGF, fibroblast growth factor; IGF, insulin-like growth factor; MAP, mitogen-activated protein; NLP, natural language processing; TGF, transforming growth factor.
aThis pathway analysis was performed in Panther database, and there were 16 available pathways. Among them, 13 signaling pathways were significant (P < .05), and the top 10 pathways are shown in this table.
Discussion
As a common cancer, HCC attracts attention from clinicians and researchers worldwide because of the increasing incidence and poor survival despite the advances in diagnosis and therapeutic techniques. 1,2 MiR-141-3p is a member of the miRNA family of noncoding RNA, which can bind to their target mRNAs to inhibit or promote oncogenesis and progression. 18 Thus, it is essential to explore and clarify the function of miR-141-3p in HCC to identify novel potential targets for the diagnosis, prognosis, and treatment of HCC.
MiR-141-3p expression has been detected in several cancers. Lower levels of miR-141-3p were detected in breast cancer, but no significant difference was observed. 19 In gastric cancer, Chang et al observed a significant downregulation of miR-141-3p expression. 20 However, Mei et al illuminated that miR-141-3p was up-regulated in non-small-cell-lung cancer tissue compared with adjacent non-cancerous tissue. 21 Regarding bladder cancer, a similar trend was observed as in NSCLC. 22 These results suggest that there is heterogeneity in miR-141-3p expression in various cancers. Therefore, it is vital to understand the aberrant expression of miR-141-3p in HCC.
There have been only 2 studies that focused on miR-141-3p expression in HCC tissues. 9,10 Xue et al demonstrated that miR-141-3p was underexpressed in 20 HCC tissues compared to 20 corresponding healthy control tissues. 10 Liu et al discovered that miR-141-3p was downregulated in 30 HCC tissues compared to 30 adjacent nontumor samples. 9 According to the 2 aforementioned studies, miR-141-3p expression may be lower in HCC. However, these 2 studies were conducted on small sample sizes, which reduced its reliability. Therefore, further validation of miR-141-3p expression levels in HCC is necessary.
In this current study, we concentrated on miR-141-3p expression in HCC with clinical parameters. Although the meta-analysis based on the microarray data from the GEO showed a negative result (P = .984), we observed a striking reduction miR-141-3p levels in 49 HCC tissues compared to the 49 matched adjacent normal liver tissues in the TCGA database (P = .045). The consistent trend was verified by qRT-PCR (95 pairs, P = .001), and the results were in accordance with the results of Xue et al and Liu et al. Our conclusion, which focused on miR-141-3p expression in HCC, was drawn from the larger sample size and might be more stable and convincing. Moreover, miR-141-3p might be a potential biomarker for HCC diagnosis due to the AUC values of 0.647 in TCGA data (P = .003) and 0.677 in the qRT-PCR validation (P < .001). In other words, the results above confirmed the aberrant expression of miR-141-3p in HCC and its clinical value for HCC diagnosis. However, further in vivo and in vitro investigations are required to clarify the relative mechanisms of alterations in miR-141-3p expression in HCC.
Concerning the clinicopathological characteristics of the development of HCC, such as tumor nodes, metastasis, and TNM stage, we noticed that these clinicopathological factors were negatively correlated with the expression of miR-141-3p. Not surprisingly, several studies have identified various regulatory mechanisms involved in the progression of HCC. Lou et al confirmed that miR-141-3p could influence cell growth and metastasis in HCC through the JNK (c-Jun NH2-terminal kinase) pathway. 23 Consistent with these results, Liu et al found that miR-141-3p could inhibit migration and invasion by targeting Tiam1. 9 Moreover, several other targets of miR-141-3p including ZEB2, which is related to cell apoptosis, proliferation, and invasion, were confirmed to be vital to carcinogenesis and the progression of HCC. 24 –26 Altogether, miR-141-3p may play an antioncogene role in HCC.
To further clarify the potential mechanisms of miR-141-3p in carcinogenesis and the progression of HCC, a gene functional enrichment analysis was performed. In the gene functional enrichment analysis, the NLP analysis was responsible for the HCC-related genes, and the 12 prediction databases and 3 databases for validated targets embodied the miR-141-3p target genes. After combining the 3 analyses, the overlapping genes were identified as genes that might be involved in the regulatory mechanisms of miR-141-3p in HCC. The protein–protein network of the overlapping genes revealed several hub genes, including PTEN, SRC, PRKCA, PTGS2, and so on. In the Pearson correlative analysis, 7 targets of miR-141-3p showed relatively higher correlation with miR-141-3p (CES2, MYRIP, PEBP1, BCKDHB, PPARA, GLYATL1, and IRS2). However, the bioinformatics analysis for identifying targets may produce results with weak evidence. Thus, whether these identified targets of miR-141-3p in HCC were involved in the pathogenesis of HCC needs further validation in future studies. Further in vivo and in vitro experiments are needed to confirm the relationships between miR-141-3p and its identified targets in HCC, especially the hub genes in protein–protein network and the well-correlated targets in Pearson correlative analysis. In the GO analysis of the overlapping genes, some of the target genes were correlated with the regulation of cell proliferation, the enzyme–linked receptor protein signaling pathway, and protein tyrosine kinase activity. These relative functions of the overlapping genes may be essential to the pathogenesis and progression of HCC. 27,28 Further experiments are also necessary to demonstrate the functions of these target genes.
In the pathway analysis, we obtained 34 significant signaling pathways in the KEGG database and 13 noteworthy signaling pathways of the overlapping genes, including the MAPK signaling pathway, the p53 signaling pathway, and the EGFR signaling pathway. Among them, several dysfunctional signaling pathways have been shown to contribute to oncogenesis and the progression of HCC. 28 –30 Further in vitro and in vivo investigations of miR-141-3p functions in those signaling pathways in HCC are necessary to confirm and clarify the regulatory mechanisms of miR-141-3p in HCC.
In conclusion, miR-141-3p may play a tumor-suppressing role in the pathogenesis and development of HCC through the regulation of cell proliferation, the enzyme–linked receptor protein signaling pathway, protein tyrosine kinase activity, and several important pathways involved in carcinogenesis and progression, including the MAPK signaling pathway, the p53 signaling pathway, and the EGFR signaling pathway. Further investigations are necessary to confirm the relationships between miR-141-3p and certain key hub genes (PTEN, SRC, PRKCA, and PTGS2) in the pathogenesis of HCC. Thus, interactions with miR-141-3p may supply an original viewpoint for HCC treatment.
Footnotes
Abbreviations
Declaration of Conflicting Interests
The author(s) declared no potential conflicts of interest with respect to the research, authorship, and/or publication of this article.
Funding
The author(s) received no financial support for the research, authorship, and/or publication of this article.