
Abstract
Existing reports have demonstrated that miR-199a-3p plays a role as a tumor suppressor in a variety of human cancers. This study aims to further validate the expression of miR-199a-3p in HCC and to explore its underlying mechanisms by using multiple data sets. Chip data or sequencing data and quantitative reverse transcription polymerase chain reaction (qRT-PCR) were integrated to assess the expression of miR-199a-3p in HCC. The potential targets and transcription factor regulatory network of miR-199a-3p in HCC were determined and possible biological mechanism of miR-199a-3p was analyzed with bioinformatics methods. In the results, miR-199a-3p expression was significantly lower in HCC tissues compared to normal tissues according to chip data or sequencing data and qRT-PCR. Moreover, 455 targets of miR-199a-3p were confirmed, and these genes were involved in the PI3K-Akt signaling pathway, pathways in cancer, and focal adhesions. LAMA4 was considered a key target of miR-199a-3p. In CMTCN, 11 co-regulatory pairs, 3 TF-FFLs, and 2 composite-FFLs were constructed. In conclusion, miR-199a-3p was down regulated in HCC and LAMA4 may be a potential target of miR-199a-3p in HCC.
Introduction
Hepatocellular carcinoma (HCC) is a major malignant cancer and one of the leading causes of malignancy-associated mortality worldwide. 1 The development of treatment approaches to HCC have improved with the help of large-scale, cancer-related research. 2,3 Nevertheless, HCC evolves rapidly, which results in low survival times. 4,5 Thus, it is urgent to continuously explore the biological mechanisms of HCC in tumorigenesis or progression, and identifying the potential biomarkers or regulators for HCC treatment is imperative.
MicroRNAs (miRNAs) are small, single-stranded, non-coding RNAs of 18 to 25 nucleotides in length that are transcribed by DNA 6 (31557962) MicroRNAs can combine to target a gene’s 3’UTR region and function to control the expression of the target gene in post-transcription. According to the degree of sequence complementarity, miRNAs could cause the reduction of the target gene or inhibit the translation of mRNA, thus interfering protein synthesis. 7,8 Published studies have shown that miRNA is an important regulator of functional gene expression and reveal a crucial function in the occurrence and evolution of diseases. 9,10 Existing reports have documented that miRNAs may participate in the occurrence and evolution of multiple cancers and may offer a new strategy for cancer screening, diagnosis, prognosis, and treatment. 11,12 In HCC, numerous miRNAs have been reported to be aberrantly expressed and the dysregulation of these miRNAs has been reported to exist potential clinical values. 13 -15
One miRNA, miR-199a-3p, has been reported to function in several tumors, such as esophageal cancer, 16 prostate cancers, 17 and papillary thyroid cancer. 18 The dysregulation of miR-199a-3p in HCC in particular has aroused our concern. It has been reported that miR-199a-3p can function as a new marker for the diagnosis and treatment of HCC patients. 19,20 Moreover, miR-199a-3p inhibits HCC growth through modulating MTOR and PAK4 pathway. 21 In addition, miR-199a-3p was found to inhibit the tumorigenesis, growth, migration, invasion, and angiogenesis of HCC by targeting multiple targets, such as PUMA or ZHX1, 22 VEGFA, VEGFR1, VEGFR2, HGF, MMP2, 23 YAP1, Jagged1, Notch signaling, 24 and CD151. 25 Although previous studies have tried to verify the expression of miR-199a-3p in HCC, small sample data may reduce the reliability of the results.
In the current study, chip data or sequencing data and quantitative reverse transcription polymerase chain reaction (qRT-PCR) were integrated to assess the expression of miR-199a-3p in HCC. We also screened the potential targets and transcription factor regulatory network of miR-199a-3p in HCC and analyzed the possible biological mechanism of miR-199a-3p with bioinformatics methods (Figure 1).

The flow chart represents the main design of this study. The study is divided into 3 parts, including the evaluation of miR-199a-3p expression in HCC by integrating multiple data sets, the identification of the potential targets of miR-199a-3p in HCC, and the construction of the transcription factor and miR-199a-3p regulatory network.
Materials and Methods
HCC Tissue Sample Collection
In this study, 26 pairs of HCC tissue samples and adjacent tissue samples were collected from 26 patients diagnosed and undergoing surgery in our unit from March 2010 to December 2011. Some of the clinical or pathological information of these patients was also collected, including age, gender, clinical stage, tumor size, and vascular invasion.
RT-qPCR
Total RNA was detected in FFPE sections using the miRNeasy FFPE Kit, and the concentration of RNA was identified with NanoDrop 2000. The real-time quantitative PCR was conducted by utilizing the Applied Biosystems 7900HT Fast Real-Time PCR System, and the miRNA expression was detected based on the operation guide of the merchant. The formula 2-ΔCt was exploited to calculate the expression data of miR-199a-3p.
Data Collection
The data sets of miR-199a-3p expression in HCC tissues and healthy tissues were screened in the Sequence Read Archive (SRA), the Gene Expression Omnibus (GEO), the ArrayExpress Archive of Functional Genomics Data, The Cancer Genome Atlas (TCGA) database, and Oncomine with the following search strategy: (miR OR miRNA OR microRNA) AND (cancer OR tumor OR carcinoma) AND (hepatocellular OR liver OR hepatic OR HCC). The screening strategy was as follows: First, each data set should contain human HCC tissue samples and normal tissue samples. Second, liver cirrhotic tissue samples were not included in our non-tumor group. Third, the miRNA expression data could be obtained from all included data sets. The miR-199a-3p expression data for each data set were collected and divided into HCC groups and normal groups. The HCC sequencing data of the TCGA database were downloaded from UCSC Xena (https://xena.ucsc.edu/), which included the sequencing data for 371 HCC and 48 normal tissues. The data were processed as microarray data. The HCC-related clinical parameters, including gender, grade, age, TNM stage, and survival data, were also extracted from the TCGA database.
Differentially Expressed Analysis
HCC mRNA-related chip data or sequencing data were searched in the GEO database using the keywords (cancer OR tumor OR carcinoma) AND (hepatocellular OR liver OR hepatic OR HCC). The included data set must meet the following conditions: First, the mRNA expression profiles in HCC tissues or normal tissues could be achieved. Second, more than 3 tumors and controls were included in the study. The microarray data of included data sets were produced by multiple platforms and normalized by using the RMA algorithm provided by the Linear Models for Microarray Data (Limma) package (http://bioconductor.org/packages/limma/). The sva package of R software was exploited to remove the batch effect. Finally, the Limma package of R was used to perform the differentially expressed analysis, and the differentially expressed gene of each platform was calculated. P-value < 0.05 and |fold change(FC)|>1 were regarded as significant.
Potential Target Genes of miR-199a-3p
GSE110216 was a microarray that included miR-199a-3p overexpressed and untreated HCC cell lines. GEO2 R was used to carry out a differentially expressed analysis between miR-199a-3p overexpressed and untreated HCC cell lines, and logFC <−1 was regarded as significant. MiRWalk2.0 was used to predict the targets of miR-199a-3p. MiRWalk 2.0 is a collection of predictive tools that includes 12 online predicted tools. Genes predicted by more than 3 tools were accepted. The overlapped genes of upregulated differentially expressed genes (DEGs) of HCC, downregulated genes from differentially expressed analysis of overexpressed and untreated HCC cell lines, and predicted targets of miR-199a-3p were considered as possible targets of miR-199a-3p in HCC.
GO and KEGG Analysis
Gene ontology and KEGG analysis were carried out in the Database for Annotation, Visualization and Integrated Discovery (DAVID) (https://david.ncifcrf.gov/) to decipher the functions of target genes. The STRING database (https://string-db.org/) was used to perform protein-protein interaction (PPI) analysis. Based on the results of enrichment analysis and PPI analysis, the hub target genes of miR-199a-3p were confirmed.
Validating the Expression Level and Clinical Role of Hub Genes
The mRNA expression of hub genes were assessed via a meta analysis by integrating the GEO microarray data or TCGA RNA-seq data, while the protein expression of hub genes was assessed based on the immunochemistry data of The Human Protein Atlas (https://www.proteinatlas.org/). In addition, a summary receiver operating characteristic (sROC) curve was produced to provide a further assessment of the potential of hub genes to differentiate HCC tissues from normal tissues. The prognosis-related GEO data and TCGA RNA-seq data were collected, and a prognosis meta-analysis was performed for the hub genes.
Construction of Transcription Factor Network
CMTCN (http://www.cbportal.org/CMTCN/) is an online tool for exploring cancer-specific miRNAs and transcription factor regulatory networks. Four types of miRNAs and transcription factor regulatory models were provided in CMTCN, included co-regulatory pairs, TF-FFLs, miRNA-FFLs, and composite-FFLs. We constricted miR-199a-3p-related transcription factor regulatory networks in this web.
Statistical Analysis
The software packages Stata 12 and SPSS 19 were used for our statistical analysis. First, RT-PCR, chip data, or sequencing data was calculated with an independent sample t-test or a paired sample t-test in SPSS 19 to assess the expression of miR-199a-3p in HCC and normal tissue samples. The relationship of miR-199a-3p expression and clinicopathological parameters were assessed by t-test or variance analysis. Second, Stata 12 was used to integrate the results of the t-tests based on RT-PCR, chip data, or sequencing data through a meta-analysis. The fixed effects model was used for the initially and the random effects model was used when I2 >50%, which identified the existence of heterogeneity. Third, ROC curves based on included data were drawn to assess the reliability of miR-199a-3p in distinguishing HCC and normal tissue samples. An sROC was also performed via a meta-analysis.
Results
MiR-199a-3p Expression in HCC Tissues
MiR-199a-3p expression was initially evaluated in HCC tissues and healthy tissues based on the GEO data sets. A total of 13 GEO data sets, which included both HCC tissues and healthy tissues, were collected in our study. Downregulated miR-199a-3p was observed in 11 data sets, whereas no significant differences were found in the other 2 GEO data sets (GSE57555 and GSE40744). Under-expressed miR-199a-3p was also found in 372 HCC tissues (8.9839 ± 1.82456) compared with 48 adjacent non-cancerous HCC tissues (11.3066 ± 0.51513, P < 0.001) based on the TCGA sequencing data (Figure 2, Table 1). Significant downregulated miR-199a-3p was found in HCC tissues by integrating all the included GEO data sets and The Cancer Genome Atlas (TCGA) sequencing data (SMD = −1.22; 95% CI, −1.59 to −0.85; P < 0.001) with heterogeneity using the random effects model (P < 0.001, I2 = 85.5%) (Figure 3A-B). Moreover, downregulated miR-199a-3p was also found in our qRT-PCR based on the 26 pairs of clinical HCC tissues and normal tissues, and the corresponding SMD of the random effects model was −1.17 (−1.52, −0.83) with I2 = 84.5% (Figure 3C-D). MiR-199a-3p could be a valuable marker to distinguish HCC tissues from normal tissues with an area under the curve (AUC) of 1.00 based on HCC chip data (GSE69580, GSE41874, GSE31383). Additionally, the ROC based on the TCGA sequencing data and the qRT-PCR also indicated that miR-199a-3p has the potential to be a marker for distinguishing HCC from normal tissue samples, with the AUC being 0.8856 and 0.8395, respectively (Figure 4, Table 2). The sROC calculated based on HCC chip data and sequencing data was 0.91 (0.88, 0.93) with a pooled sensitivity and specificity of 0.72 (0.62, 0.80) and 0.97 (0.90, 0.99), respectively (Figure 5A-B). The corresponding sROC based on the HCC chip data, sequencing data, and qRT-PCR was 0.91 (0.88, 0.93) with a corresponding sensitivity and specificity of 0.72 (0.63, 0.80) and 0.96 (0.90, 0.98), respectively (Figure 5C-D). In addition, no significant differences were found in the other clinical features (Tables 3 and 4).
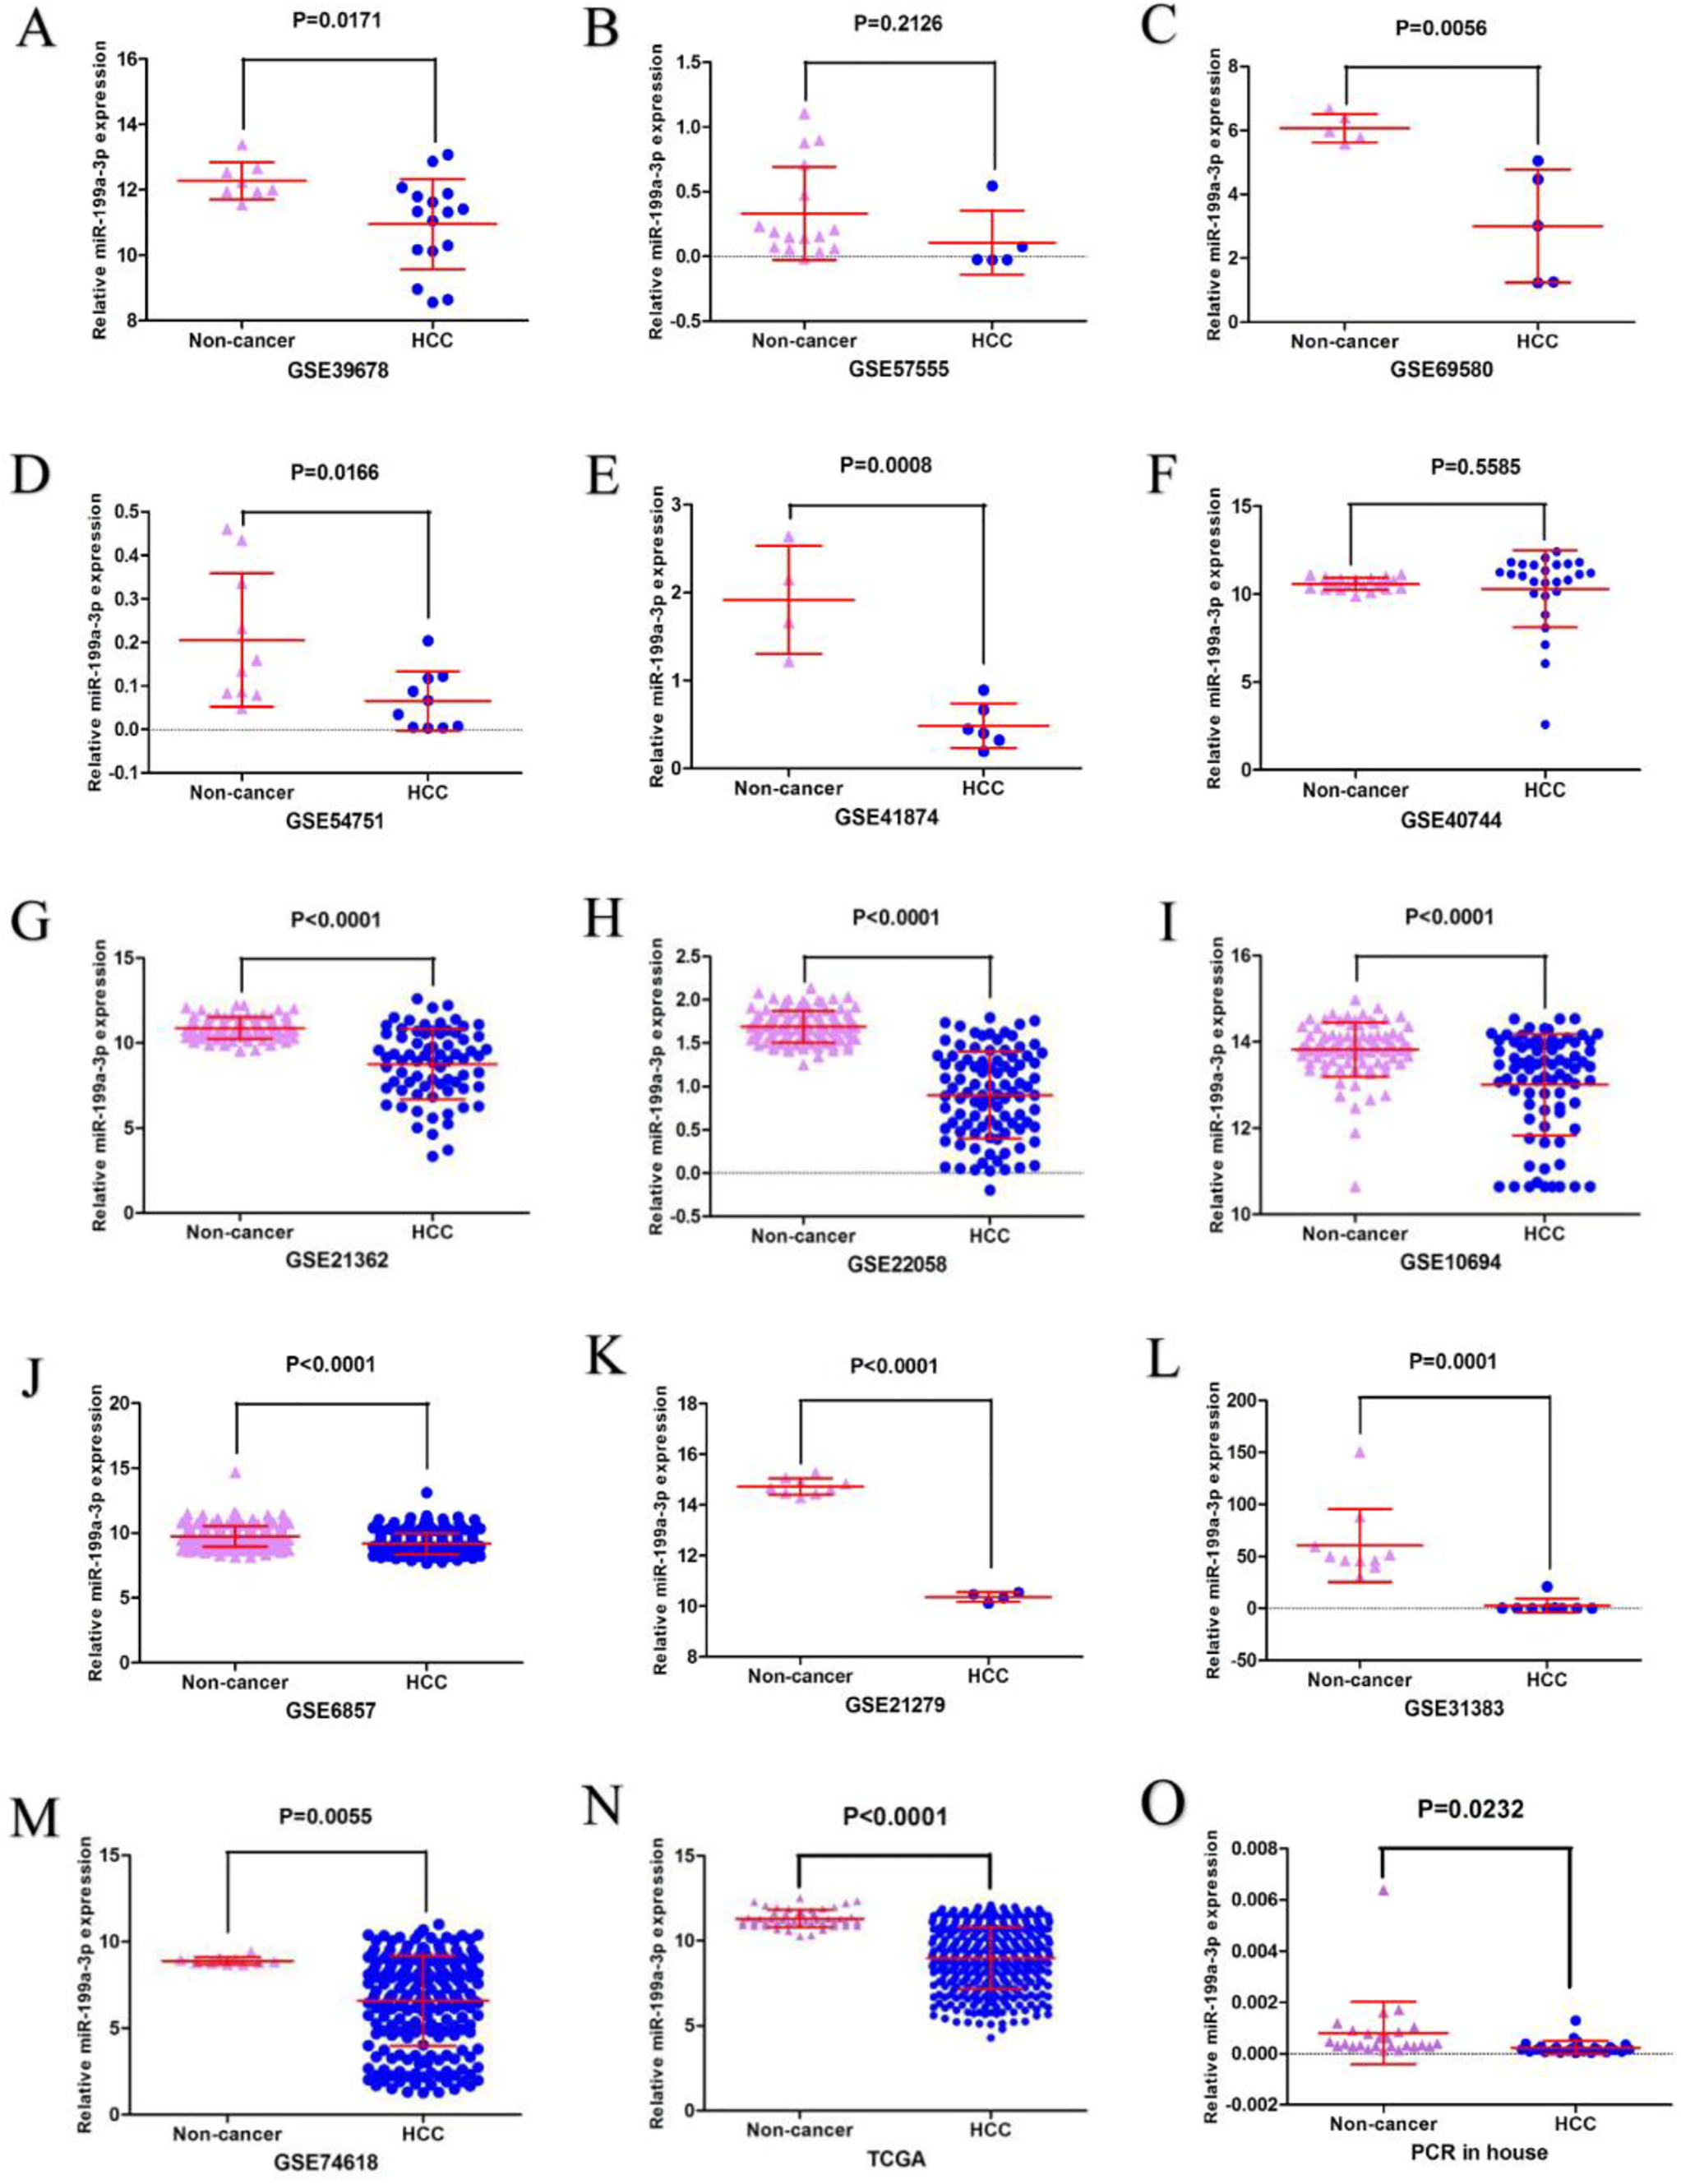
The evaluation of miR-199a-3p expression in HCC based on HCC chip data and sequencing data and qRT-PCR. A: GSE39678, B: GSE57555, C: GSE69580, D: GSE54751, E: GSE41874, F: GSE40744, G: GSE21362, H: GSE22058, I: GSE10694, J: GSE6857, K: GSE21279, L: GSE31383, M: GSE74618, N: TCGA, O: qRT-PCR.
The Evaluation of miR-199a-3p Expression in HCC Based on HCC Chip Data and Sequencing Data and qRT-PCR.


The evaluation of miR-199a-3p expression in HCC with meta-analysis based on HCC chip data and sequencing data and qRT-PCR. A: the forest plot based on HCC chip data and sequencing data; B: the funnel plot based on HCC chip data and sequencing data; C: the forest plot after adding qRT-PCR data; D: the forest plot after adding qRT-PCR data.

The receiver operating curve (ROC) based on HCC chip data and sequencing data and qRT-PCR data. A: GSE39678, B: GSE57555, C: GSE69580, D: GSE54751, E: GSE41874, F: GSE40744, G: GSE21362, H: GSE22058, I: GSE10694, J: GSE6857, K: GSE21279, L: GSE31383, M: GSE74618, N: TCGA, O: qRT-PCR.
The Potential of miR-199a-3p in Differentiating HCC Tissues From Normal Tissues.

TP: true positive; FP: false positive; FN: false negative; TN: true negative.

The sROC based on HCC chip data and sequencing data and qRT-PCR. A: the sROC based on HCC chip data and sequencing data; B: the corresponding sensitivity and specificity; C: the sROC after adding qRT-PCR data; D: the corresponding sensitivity and specificity after adding qRT-PCR data.
The Relationship Between miR-199a-3p Expression and Clinicopathological Features Based on TCGA Data.

The Relationship Between miR-199a-3p Expression and Clinicopathological Features Based on qRT-PCR Data.

Identification of miR-199a-3p Targets
In total, 68 groups of HCC mRNA-related microarrays and RNA-seq data were screened. These data sets are divided into 8 platforms, and data from the same platform was merged and removed the batch effects. The differentially expressed analysis was performed based on each of these 8 platforms. A total of 3006 upregulated genes intersected by more than 3 platforms were accepted. P-value < 0.05 and |fold change (FC)|>2 were regarded as significant. After differential expression analysis between miR-199a-3p overexpressed and untreated HCC cell lines based on GSE110216, a total of 6434 downregulated genes were obtained. Meanwhile, a total of 9600 targeted genes of miR-199a-3p were predicted in miRWalk 2.0. Finally, 3006 upregulated DEGs of HCC, 6434 downregulated genes from differentially expressed analysis of overexpressed and untreated HCC cell lines, and 9600 predicted targets of miR-199a-3p overlapped, and 455 overlapped genes were considered possible targets of miR-199a-3p in HCC (Figure 6A, Supplementary Figure 1).

The enrichment analysis based on target genes of miR-199a-3p. A: the potential targets of miR-199a-3p in HCC; B: biological process; C: cell component; D: molecular function; E: KEGG pathways.
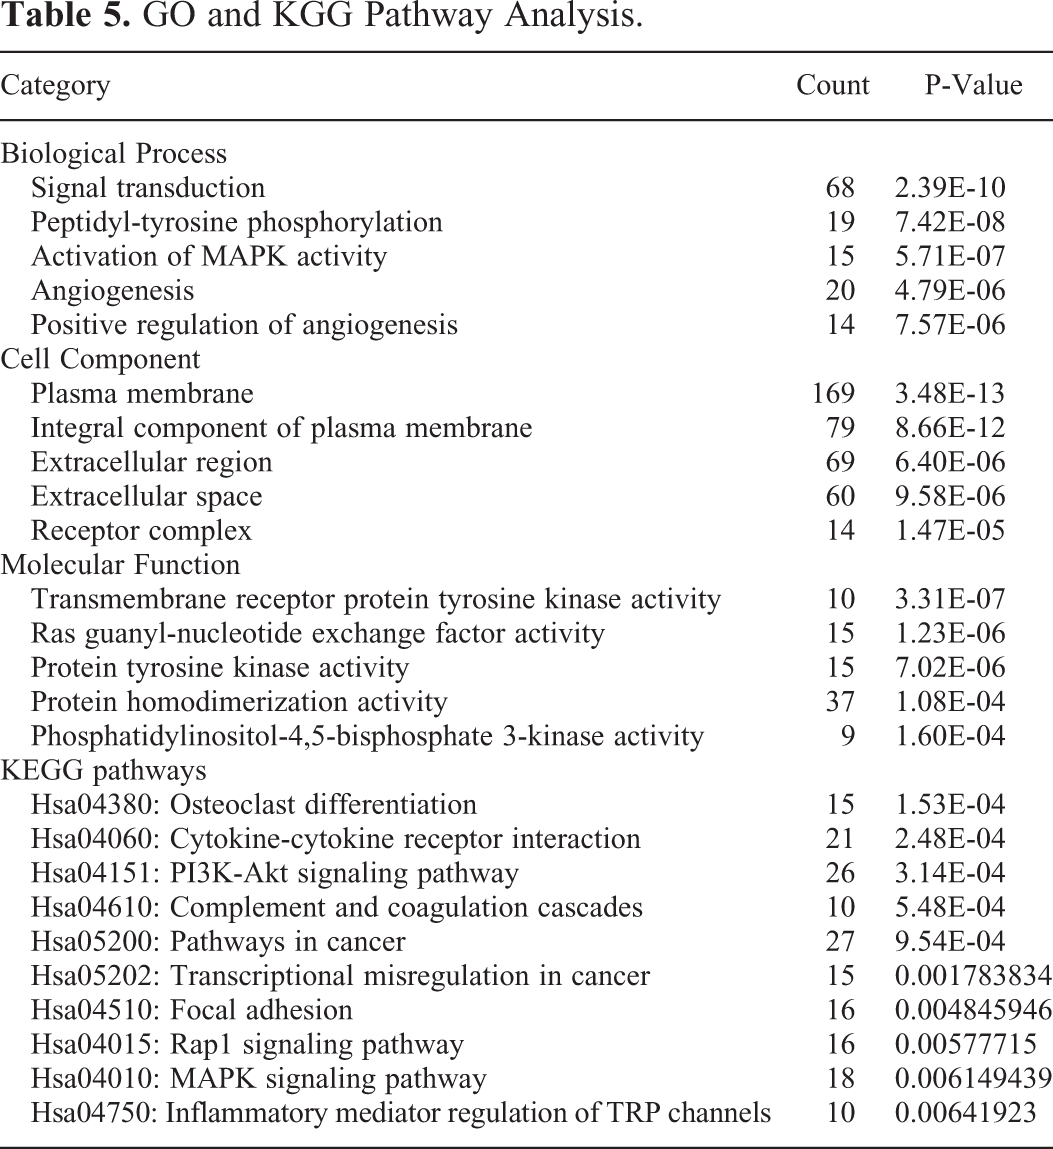
Functional Analysis of the Targets of miR-199a-3p in HCC
First, the functional roles of 455 potential target genes in GO enrichment analysis were identified. The analysis indicated that numerous target genes were related to signal transduction, plasma membrane, and transmembrane receptor protein tyrosine kinase activity (Table 5, Figure 6B-D). The KEGG pathways revealed some important pathways, such as the PI3K-Akt signaling pathway, pathways in cancer, and focal adhesion (Table 5, Figure 6E).
GO and KGG Pathway Analysis.
The PPI Network and Verification of Hub Target Genes
The genes that were enriched in the PI3K-Akt signaling pathway, pathways in cancer, and focal adhesion were overlapped (Figure 7A-C). A total of 5 genes (BCL2, COL4A4, IGF1, LAMA4, and PDGFRA) were obtained, and these genes were considered hub targets (Figure 7D). A comprehensive meta-analysis was achieved by integrating 20 chip data and 1 sequencing data to assess the expression of these hub genes in HCC. The results indicate that only the LAMA4 gene was obviously upregulated in 1616 HCC tissues compared with 901 normal tissues (SMD = 1.18; 95% CI, 0.98 to 1.38; P < 0.0001) with heterogeneity using the random effects model (P < 0.001, I2 = 70.7%) (Table 6, Figure 8A). The protein expression of LAMA4 was assessed based on the immunochemistry data obtained from The Human Protein Atlas. The results indicate that LAMA4 was medium positive in HCC tissues and was negative in normal tissues (Figure 8B). In addition, the sROC curve indicates that LAMA4 has the potential to differentiate HCC tissues from normal tissues, with the AUC being 0.86. The corresponding sensitivity and specificity were 0.92 (0.86, 0.95) and 0.71 (0.64, 0.78), respectively (Table 7, Figure 8C, Supplementary Figure 2). The prognosis value of LAMA4 was determined in our prognosis meta-analysis, with the HR being 2.64 (2.06, 3.36).

Identification of the hub target genes of miR-199a-3p in HCC. A: the PPI network based on the gene enriched in PI3K-Akt signaling pathway; B: the PPI network based on the gene enriched in pathways in cancer; C: the PPI network based on the gene enriched in focal adhesion; D: the hub target genes of miR-199a-3p.
The Evaluation of LAMA4 Expression in HCC Based on HCC Chip Data and Sequencing Data.


Validation of the hub target gene of miR-199a-3p. A: the evaluation of LAMA4 expression in HCC based on HCC chip data and sequencing data; B: the protein expression level of LAMA4 in HCC based on The Human Protein Atlas; C: SROC to assess the potential of LAMA4 in differentiating HCC tissues from normal tissues; D: prognosis-related meta-analysis to assess the prognostic value of LAMA4 based on multiple data sets.
The Potential of LAMA4 in Identifying HCC Tissues From Normal Tissues.

TP: true positive; FP: false positive; FN: false negative; TN: true negative.
Transcription Factors and the miR-199a-3p Co-Regulatory Network
A total of 15 TF-miR-199a-3p regulatory axes were identified in CMTCN, which included 11 co-regulatory pairs, 3 TF-FFLs, and 2 composite-FFLs (Table 8). The transcription factor and the miR-199a-3p co-regulatory network were constructed with Cytoscape 5.3.0 (Figure 9). In the network, several hub genes were found, including GATA2, SP1, SOD1, and PTGS2. Further verification was still needed.
The Regulatory Network Between Transcription Factor and miR-199a-3p in HCC.
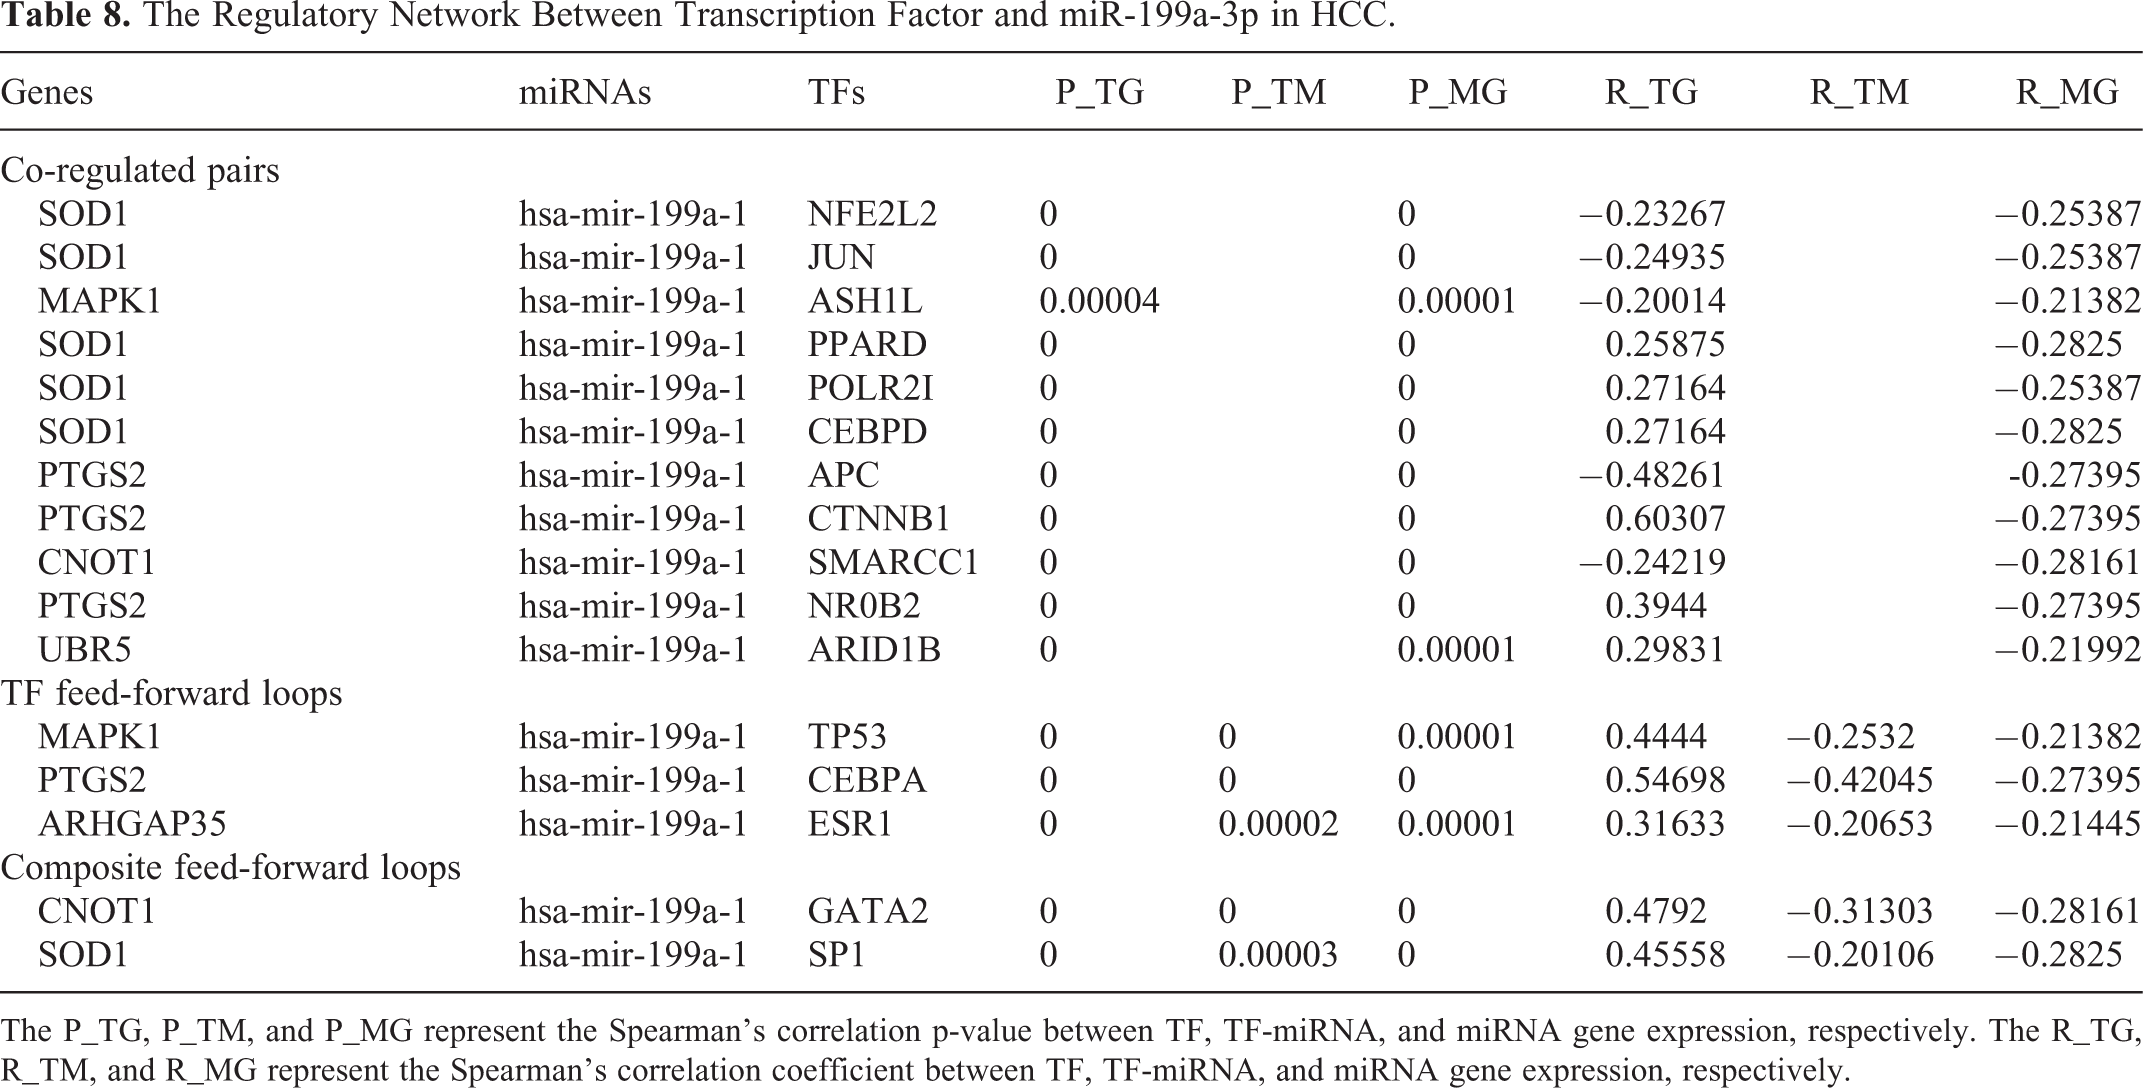
The P_TG, P_TM, and P_MG represent the Spearman’s correlation p-value between TF, TF-miRNA, and miRNA gene expression, respectively. The R_TG, R_TM, and R_MG represent the Spearman’s correlation coefficient between TF, TF-miRNA, and miRNA gene expression, respectively.
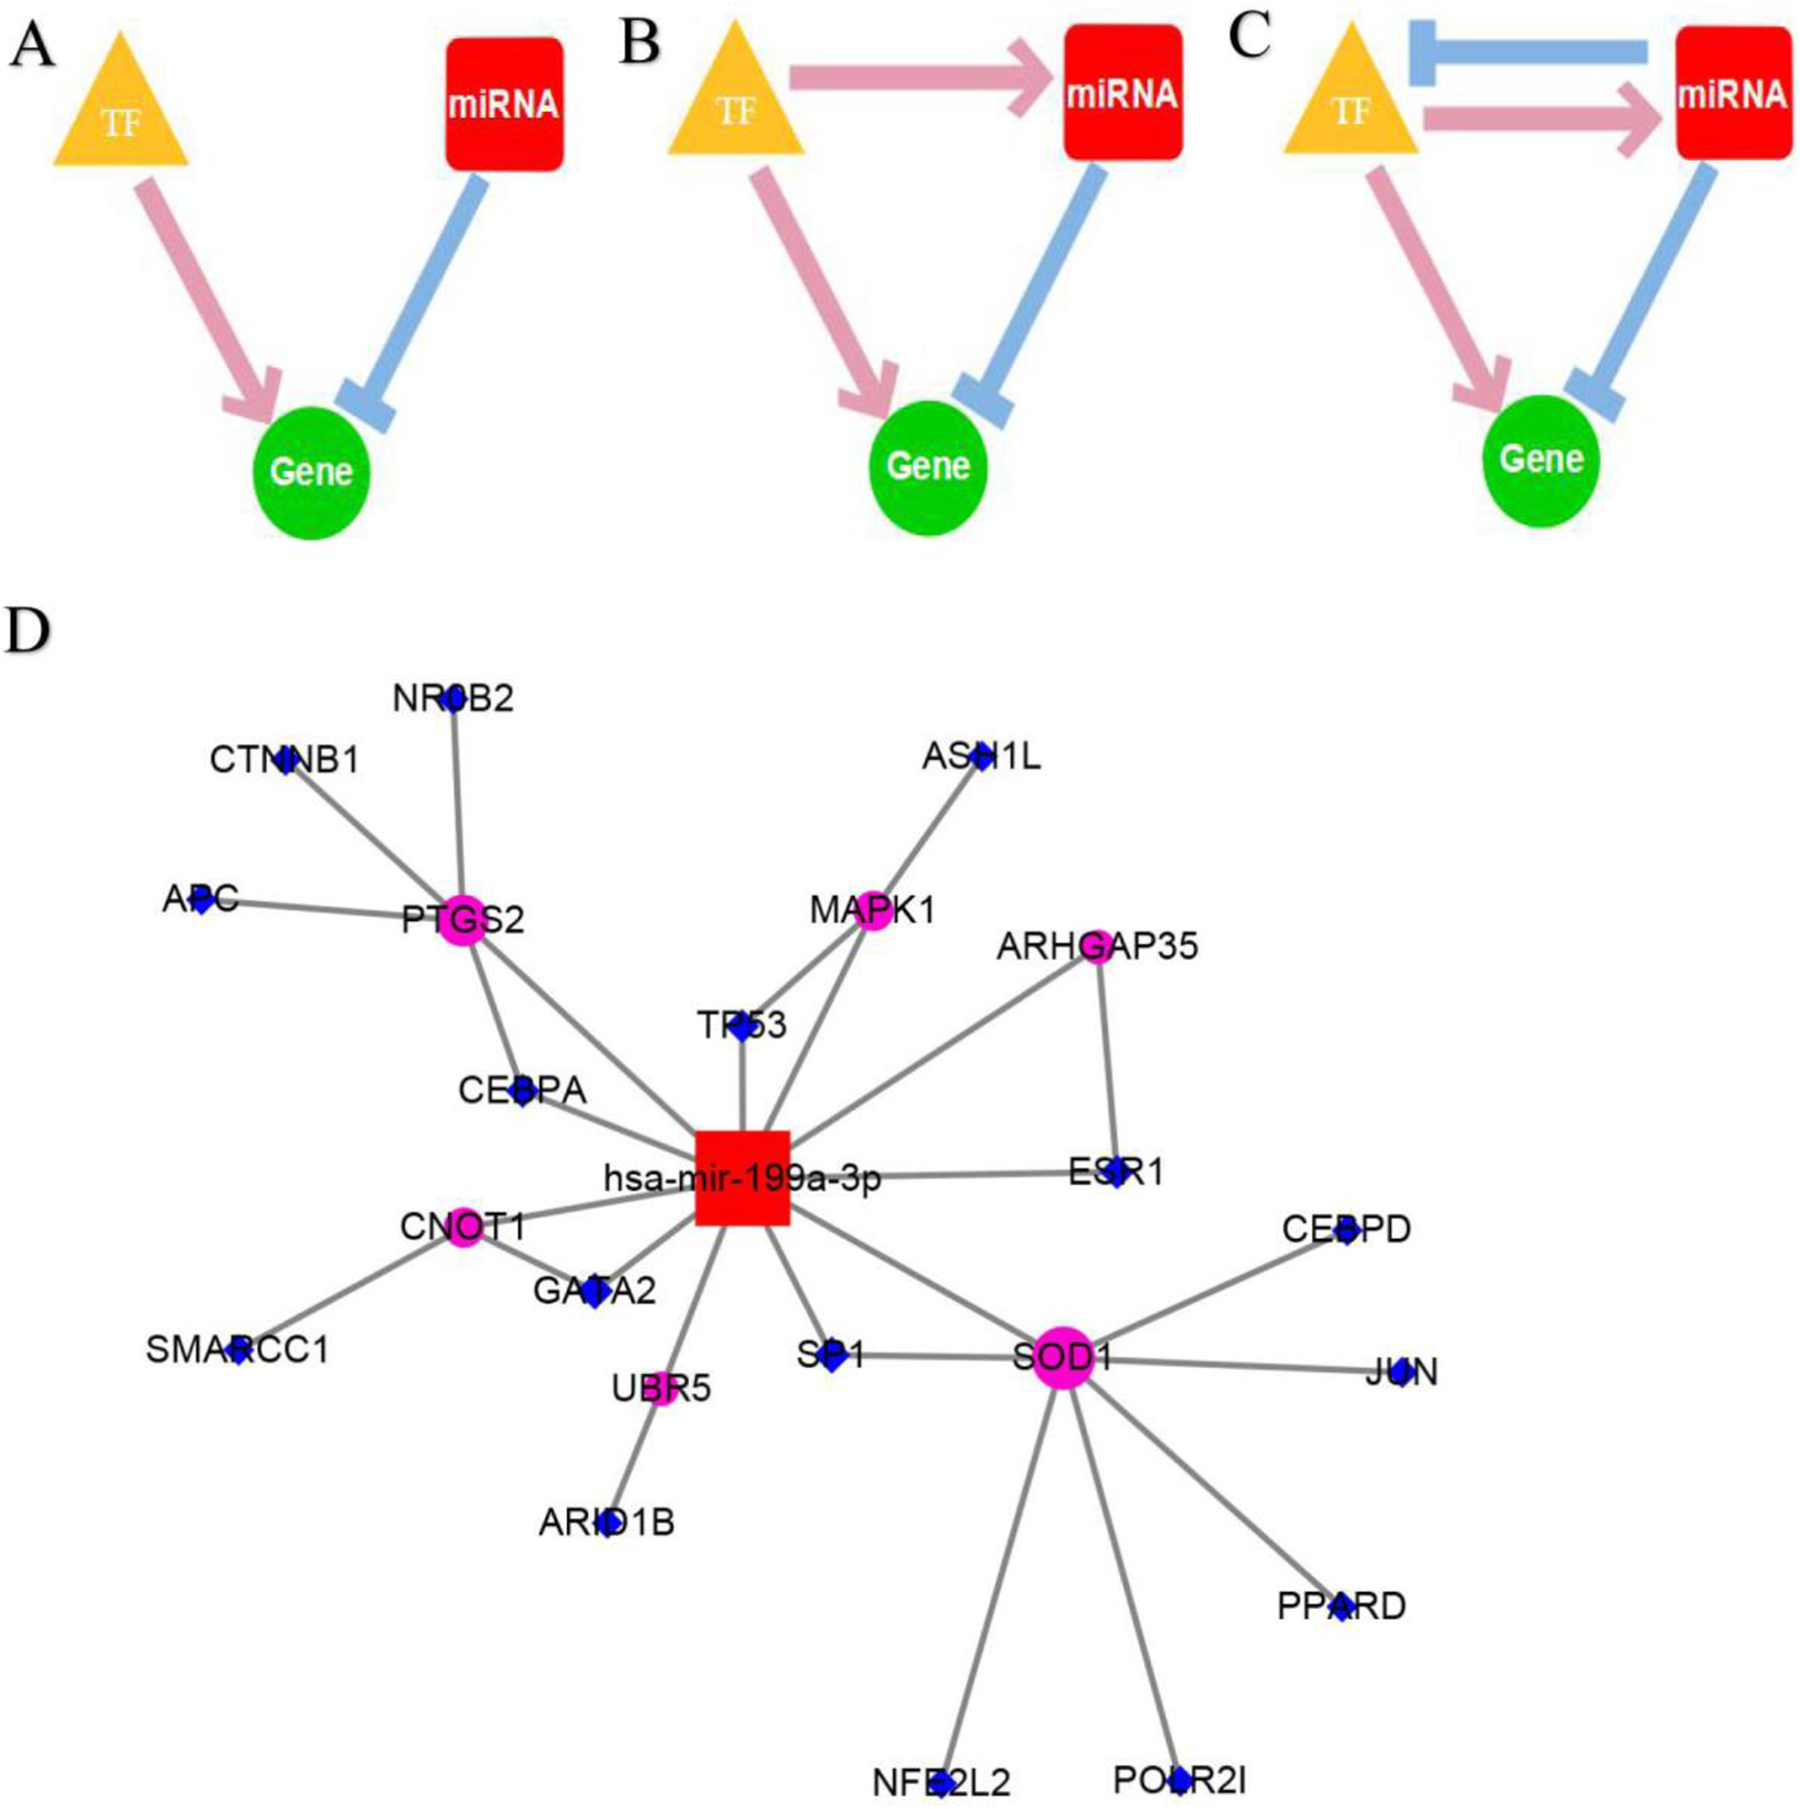
Construction of the transcription factor and miR-199a-3p regulatory network. A: the model of co-regulatory pairs; B: the model of TF-FFLs; C: the model of composite-FFLs; D: the regulatory network of transcription and miR-199a-3p.
Discussion
In this study, downregulated miR-199a-3p was identified in 1190 HCC tissues compared with 663 normal human tissues based on HCC chip data and sequencing data and qRT-PCR. MiR-199a-3p may serve as a biomarker for identifying HCC tissues and normal tissues. Additionally, we discovered a new potential target for miR-199a-3p that was associated with the regulation of key biological processes in HCC through enrichment analysis. Furthermore, a transcription factor and a miRNA regulatory network were constructed to further clarify the molecular mechanism of miR-199a-3p in HCC.
Downregulated miR-199a-3p can be observed in multiple cancers, such as esophageal cancer, 16 papillary thyroid carcinoma, 18 melanoma, 26 glioma, 27 testicular germ cell tumor, 28 prostate cancer stem cells, 29 renal cell carcinoma, 30 and osteosarcoma. 31,32
Many studies have documented the potential for clinical applications of miR-199a-3p in multiple cancers. The diagnostic value of serum miR-199a-3p has been concerned with lung cancer 33,34 and glioma. 35 In addition, the prognostic value of miR-199a-3p has been reported in bladder cancer, 36 ovarian cancer, 37 and testicular tumor. 38 Moreover, miR-199a-3p may serve as a therapeutic target in pancreatic cancer, 39 testicular tumor, 38 and renal cell carcinoma. 30 Furthermore, miR-199a-3p reduced drug resistance or improved chemotherapy sensitivity in ovarian cancer, 40,37 breast cancer, 41,42 osteosarcoma, 43 and cholangiocarcinoma. 44
In HCC, it has been shown that miR-199a-3p can act on multiple targets to inhibit the growth, migration, invasion, and angiogenesis of HCC cells. For example, the latest study reports that abnormal expression of miR-199a-3p in liver cancer can target CDK7 and TACC2 and contribute to the occurrence and development of liver cancer. 45 Another study identified the potential feasibility of miR-199a-3p in the diagnosis and treatment of liver cancer by detecting the expression of miRNA in 18 pairs of HCC and matched non-tumor tissues. 19 A study based on mouse liver cancer models showed that miR-199a-3p could inhibit the growth of liver cancer by regulating MTOR and PAK4 pathways. 21 It has also been noted that miR-199a-3p can target E-cadherin and Notch1, 20 thus providing a new strategy for the treatment of liver cancer. In addition, some studies have shown that PUMA or ZHX1, 22 VEGFA, VEGFR1, VEGFR2, HGF and MMP2, 23 YAP1, Jagged1 and Notch signals, 24 and CD151 25 may be the target genes of miR-199a-3p.
In short, the abnormal expression of miR-199a-3p in a variety of human malignant tumors may be an important molecular target for the clinical diagnosis and treatment of tumors, especially in HCC. However, the existing studies have only used small samples or a single experiment to evaluate the expression of miR-199a-3p in hepatocellular carcinoma, which greatly reduces the reliability of the conclusions. Moreover, the relevant molecular mechanisms have not yet been clarified. Our study combined a large number of samples and qRT-PCR data from multiple databases, and it further confirmed that miR-199a-3p is underexpressed in HCC. Additionally, the targets of miR-199a-3p were confirmed by integrating upregulated differentially expressed genes of HCC from multiple platforms, downregulated genes from miR-199a-3p overexpressed and untreated HCC cell lines, and predicted targets of miR-199a-3p. This should greatly improve the accuracy of the target genes. Furthermore, we found that these target genes were mainly enriched in the PI3K-Akt signaling pathway, pathways in cancer, and focal adhesion. These pathways have been documented as being closely related to the growth, migration, and invasion of multiple cancers, including HCC.
A recent study reported that upregulation of CFHR3 inhibited proliferation and increased apoptosis of HCC cells by suppressing the PI3K/Akt/mTOR signaling pathway. 46 The inhibition of SOCS5 can induce autophagy and reduce migration in HCC cells via the PI3K/Akt/mTOR pathway. 47 Anemoside B4 induces apoptosis of cancer cells by inhibiting the PI3K/Akt/mTOR pathway in HCC. 48 Pathways in cancer is a cancer-related pathway and has been reported to be a key pathway in multiple cancers, such as colorectal cancer 49 and thyroid cancer. 50 He et al. reported that overexpression of RBAK in lung cancer may increase cell migration and invasion via focal adhesion. 51 Lu et al. discovered through integrative analysis that focal adhesion is a pathway in pancreatic cancer. 52 Lou et al. indicated that focal adhesion is an HCC-related pathway and is closely involved in the invasion and metastasis of HCC. 53
According to the prediction of the online database, the 3’UTR of LAMA4 can be combined by miR-199a-3p. Additionally, the miR-199a-3p and LAMA4 expression data from the same patients of TCGA showed that miR-199a-3p was significantly lower in HCC, while LAMA4 was significantly higher in HCC. We identified LAMA4 as a potential target of miR-199a-3p in HCC in this study. So far, several studies have reported the important role of LAMA4 in multiple cancers. Li et al. verified that miR-200b was suppressed tumor metastasis in renal cell carcinoma by directly reducing LAMA4 expression.
54
A study by Wang et al. indicated that highly expressed LAMA4 was an independent, prognosis-related biomarker in gastric cancer.
55
Yang et al. suggested that LAMA4 plays a vital role in tumor evolution and may be a key target in the treatment of triple-negative breast cancer.
56
Regarding HCC, Huang et al. reported that highly expressed LAMA4 in human HCC was identified in Chinese patients and has a strong correlation with tumor invasion and metastasis.
57
Conclusion
In summary, the target of miR-199a-3p was involved in some important cancer-related pathways, and the hub target gene, LAMA4, has been reported to be closely associated with invasion and metastasis of HCC. Therefore, we conclude that down-miR-199a-3p is a crucial tumor suppressor in HCC.
Supplemental Material
Supplemental Material, Supplementary - Downregulation of miR-199a-3p in Hepatocellular Carcinoma and Its Relevant Molecular Mechanism via GEO, TCGA Database and In Silico Analyses
Supplemental Material, Supplementary for Downregulation of miR-199a-3p in Hepatocellular Carcinoma and Its Relevant Molecular Mechanism via GEO, TCGA Database and In Silico Analyses by An-gui Liu, Yu-yan Pang, Gang Chen, Hua-Yu Wu, Rong-Quan He, Yi-wu Dang, Zhi-guang Huang, Rui Zhang, Jie Ma and Li-hua Yang in Technology in Cancer Research & Treatment
Footnotes
Abbreviations
Author Contributions
An-gui Liu, B.Med., Yu-yan Pang, M.D Contributed equally.
Acknowledgments
The authors would like to thank all members of the Molecular Oncology Group of the First Affiliated Hospital of Guangxi Medical University (Nanning, Guangxi Zhuang Autonomous Region 530021, China) for their professional suggestions. At the same time, thanks to GEO, SRA, TCGA, Human Protein Atlas and other websites for providing valuable data.
Ethics Approval and Consent to Participate
This research programme was approved by the Ethics Committee of The First Affiliated Hospital of Guangxi Medical University (2019-KY-NSFC-101, 2019-KY-NSFC-113). All participants signed informed consent forms.
Declaration of Conflicting Interests
The author(s) declared no potential conflicts of interest with respect to the research, authorship, and/or publication of this article.
Funding
The author(s)disclosed receipt of the following financial support for the research, authorship, and/or publication of this article: The study was supported partly by the Funds of Natural Science Foundation of Guangxi, China (2018JJA140409, 2017GXNSFAA198026, 2015GXNSFBA139157), Youth Science Foundation of Guangxi Medical University (GXMUYSF201624), Guangxi Degree and Postgraduate Education Reform and Development Research Projects, China (JGY2019050), 2019 Guangxi Medical University Education and Teaching Reform Project (2019XJGZ04), Future Academic Star of Guangxi Medical University (WLXSZX19077). Project of Science and Technology Innovation Training Program of the First Clinical Medical College of Guangxi Medical University(2018YFYB08).
Supplemental Material
Supplemental material for this article is available online.
References
Supplementary Material
Please find the following supplemental material available below.
For Open Access articles published under a Creative Commons License, all supplemental material carries the same license as the article it is associated with.
For non-Open Access articles published, all supplemental material carries a non-exclusive license, and permission requests for re-use of supplemental material or any part of supplemental material shall be sent directly to the copyright owner as specified in the copyright notice associated with the article.