
Abstract
Objective:
The difference in the resonance frequency of water and methylene moieties of lipids quantifies in magnetic resonance spectroscopy the absolute temperature using a predefined calibration curve. The purpose of this study was the investigation of peak evaluation methods and the magnetic resonance spectroscopy sequence (point-resolved spectroscopy) parameter optimization that enables thermometry during deep hyperthermia treatments.
Materials and Methods:
Different Lorentz peak-fitting methods and a peak finding method using singular value decomposition of a Hankel matrix were compared. Phantom measurements on organic substances (mayonnaise and pork) were performed inside the hyperthermia 1.5-T magnetic resonance imaging system for the parameter optimization study. Parameter settings such as voxel size, echo time, and flip angle were varied and investigated.
Results:
Usually all peak analyzing methods were applicable. Lorentz peak-fitting method in MATLAB proved to be the most stable regardless of the number of fitted peaks, yet the slowest method. The examinations yielded an optimal parameter combination of 8 cm3 voxel volume, 55 millisecond echo time, and a 90° excitation pulse flip angle.
Conclusion:
The Lorentz peak-fitting method in MATLAB was the most reliable peak analyzing method. Measurements in homogeneous and heterogeneous phantoms resulted in optimized parameters for the magnetic resonance spectroscopy sequence for thermometry.
Introduction
Regional deep hyperthermia treatments are applied to patients with deep-seated tumors (usually tumors inside the pelvis or in the lower extremities) by heating the tumor to temperatures between 40°C and 43°C 1 while sparing the normal tissues. Heating is induced by steered electromagnetic radiation in the range of radio frequency transmitted by antennas in an applicator that is coupled to the patient via a water bolus.
Since boundaries between muscle, fat, and bone can lead to unwanted hot spots, 2 treatment planning, temperature simulations, 3 and particularly thermometry are essential tools to protect the surrounding healthy tissue from overheating and to offer the option of optimal temperature control in the target/tumor tissue. Thermistors with plastic high-resistance leads, called Bowman probes 4 or fiber-optic sensors, 5 –7 reliably measure absolute temperatures only locally. They are invasive techniques, especially if the probe is positioned interstitially. Clinical standard is an intraluminal placement, for example, inside bladder, cervix, rectum, and/or rima ani. The “thermal mapping” technique, 8,9 in which the probe is pulled along the catheter, allows measuring a string of points, but the Bowman probe temperature measurement still remains a local measurement technique.
Magnetic resonance (MR)-guided hyperthermia offers a noninvasive option for temperature control combined with the advantage of acquiring 3-dimensional (3D) temperature distributions. 10 Different techniques of temperature measurement with an MR system have been reported. 11 –15 Methods such as the longitudinal and transverse relaxation time, the diffusion coefficient, or the proton density measurement are extremely dependent on tissue specifications. For that reason, the potential of online imaging and tumor control during treatments, i.e., good linearity and high temperature sensitivity, 13 let the proton resonance frequency (PRF) shift method being currently preferred for magnetic resonance imaging (MRI)-based temperature measurements. 14,16,17 However, it allows only determination of relative temperature changes. Absolute temperature values are only possible after calibration measurements, since the established PRF shift method calculates the temperature change ΔT for every voxel in the MR image by considering the phase change Δϕ at 2 time steps 18 :

γ is hereby the gyromagnetic ratio, the echo time is indicated by T E, and the magnetic flux density by B0. α indicates the strength of the temperature dependence influenced by the tissue material and is usually given in ppm/°C. This α-factor describes the strength of variation in hydrogen bonds, with the temperature of the considered material. The hydrogen bonds influence the configuration of water molecules and hence the shielding of the magnetic field. As a consequence, the measured resonance frequency varies. The α-factor of pure water has a value of αwater ≈ .01 ppm/°C. 11,12,19 Also, for animal and human tissues, the α-factor fluctuates around αtissue ≈ .01 ppm/°C depending on the experimental setup, the kind of tissue, and the internal, temperature-independent reference, 11,13,20 that is, the N-acetylaspartate (NAA), choline (Cho), creatine (Cr), or lipid signal. Missing reference temperatures in the region of interest for absolute calibration, organ motion, or field inhomogeneities during the measurement are hereby disadvantages of the PRF shift method. Motion and field inhomogeneities are relevant in a hyperthermia setting, since MR images are acquired at different times over an almost 2-hour period, leading to uncertainties in phase differences. 21 A local drift of the static magnetic field, which occurs during the treatment time and influences the temperature determination, has to be corrected by reference phantoms with an almost temperature-independent phase shift. 22 –24 But involuntary patient movement and motion of internal organs lead to spatial mismatch between reference voxel at t 0 and the same voxel at ti (t 0 < t i < 2 hours).
Another option for absolute temperature information is the temperature-induced proton chemical shift measured by MR spectroscopy. This method uses the PRF shift effect as well but does not use the phase image information. Since only the intensity plot of the measured resonance frequency inside 1 investigated voxel is analyzed, the method is known as “single voxel spectroscopy” (SVS). The difference between the resonance frequency of a temperature-dependent material (eg, water) and a temperature-independent material (eg, NAA, Cho, Cr, and methylene of fat signal) can thus be calculated. 18 –20,25 –28
2The importance of analyzing water and a temperature-independent material peak difference can be explained by introducing the chemical shift δ. δ is built up of a tissue-specific chemical shift δ0 and a temperature-dependent term. The strength of a tissue’s temperature dependence is influenced by the α-factor of the tissue:

Due to αfat = .00018 ppm/°C 29 being appreciably smaller than αwater ≈ .01 ppm/°C, the chemical shift δfat can be considered temperature independent. Thus, the difference in the measured temperature-dependent water peak and temperature-independent methylene of the fat signal contains the information about the absolute temperature value (see Figure 1). Small frequency drifts, slow organ motion components, or magnetic field inhomogeneities are no longer a source of uncertainties in the MR thermometry because the peak difference is measured in the same voxel at the same time.

The difference in fat and water peak yields information about the temperature inside the investigated voxel: measured power spectrum (green) and fitted power spectrum (blue).
Feasibility studies of using SVS for temperature information in animal 27,28,30 or in human brain 31,32 are reported. Investigating the applicability of SVS for thermometry in deep hyperthermia treatments at the University Hospital Erlangen was started by Bauchowitz and Mueller. 33,34
The purpose of this study is the identification of optimized SVS sequence parameters and data analysis algorithms to enable temperature measurements during deep hyperthermia treatments in clinical routine. First, different peak fitting methods were analyzed by comparing the resulting difference between methylene and water resonance frequency. Subsequently, parameters used for the MR thermometry sequence were investigated by measurements in different phantoms of mayonnaise and pork.
Materials and Methods
Devices and Phantoms
The BSD-2000/3D/MR system (Pyrexar formerly BSD Medical Corporation, Salt Lake City, Utah) that is combined with a Magnetom Symphony 1.5-T MRI scanner (Siemens, Erlangen, Germany) was used for all phantom measurements (see Figure 2). This device uses dipole antennas that transmit steered radio frequency at 100 MHz, resulting in a heated target region of 5 to 15 cm dependent on the propagated tissue, the wavelength, and the antenna parameters. Different phantoms, which were not especially adjusted to in vivo conditions regarding T1 and T2, were used for the measurements: Two mayonnaise phantoms each consisting of a 1000-mL bottle filled with salad mayonnaise with 50% rapeseed oil (Delique, Germany), one of them with 4 catheters filled with air and with a diameter of 2 mm to allow Bowman probe measurements. One of the mayonnaise phantoms was used first in each parameter study due to its homogenous mixture of fat and water (see Figure 3). In addition, a phantom with heterogeneous material and numerous tissue transitions was needed to more closely mimic the patient setting. Pork slabs, bought from a local butcher for each experimental series, were chosen for this purpose. The different tissue regions, consisting of varying amounts of fat and water, closely resemble human tissue but do not model organ motion influence. Three or 4 Bowman thermistors (Pyrexar formerly BSD Medical Corporation) were interstitially placed in catheters inside the investigated material for reference temperature measurements. Afterward the phantom was positioned inside the hyperthermia applicator Sigma30 (Pyrexar formerly BSD Medical Corporation), which was placed inside the MRI scanner. The Sigma30 consists of 1 ring, which contains 4 dipole antennas for the radio frequency heating.

The hyperthermia treatment device BSD-2000/3D/MR (Pyrexar formerly BSD Medical Corporation, Salt Lake City, Utah) combined with a Magnetom Symphony 1.5-T MRI scanner. MR indicates magnetic resonance; MRI, magnetic resonance imaging.
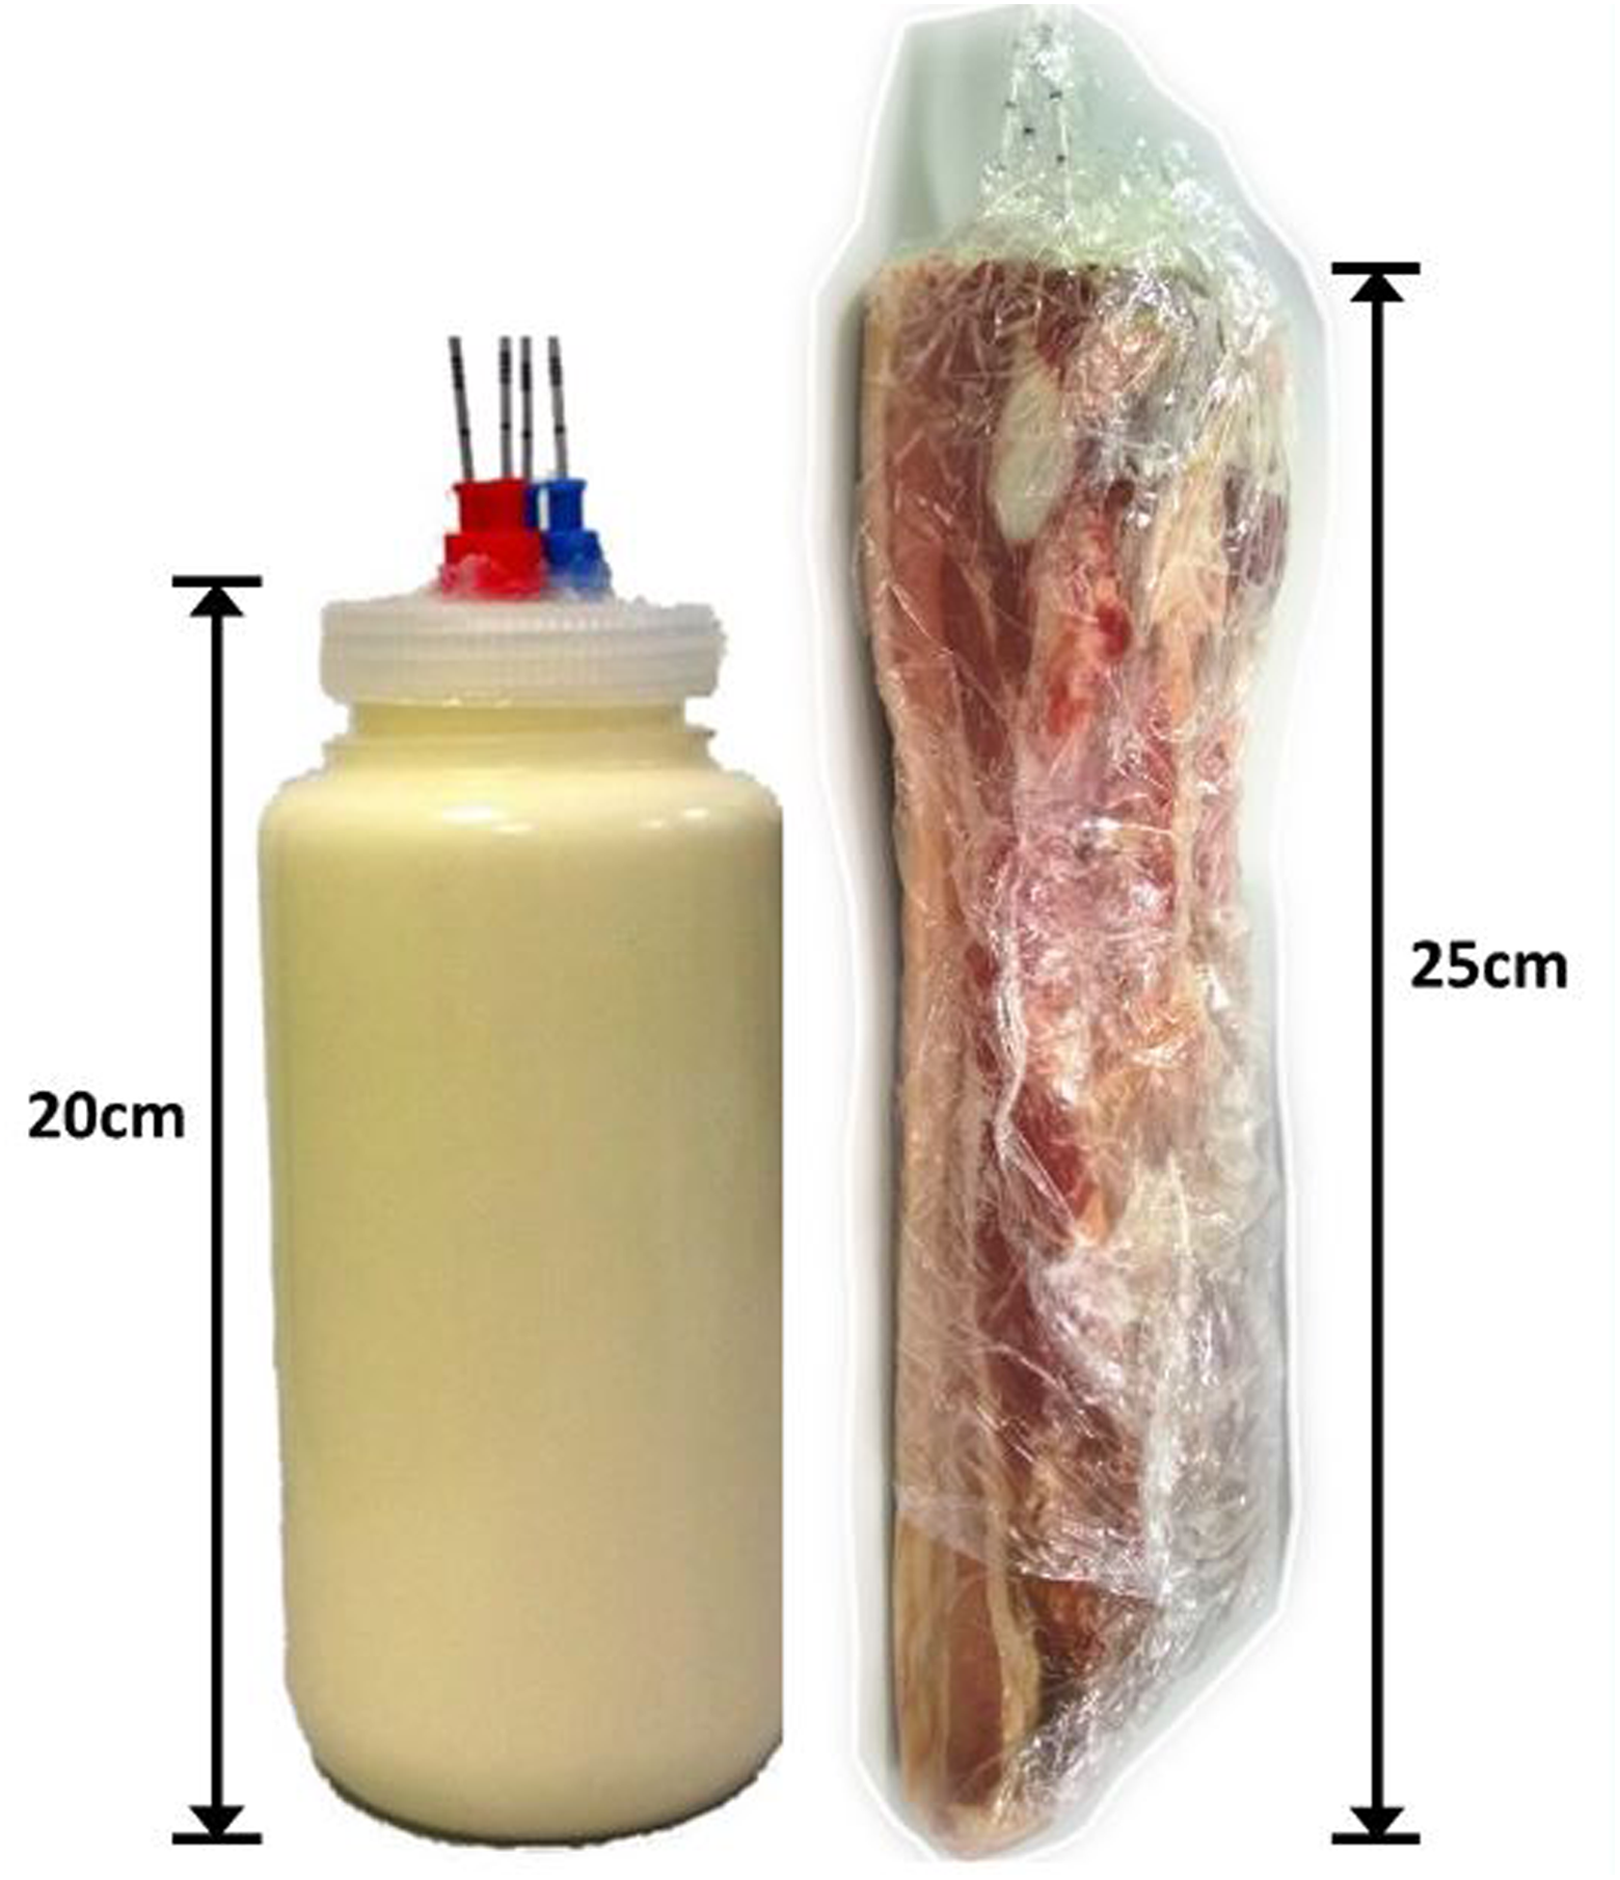
Mayonnaise and pork phantom with catheters for Bowman probes.
Description of MR SVS Sequence and Investigated Parameters
The single voxel technique was applied for the 1H MR spectroscopy temperature measurement method using a point-resolved spectroscopy (PRESS) sequence. The application of stimulated echo acquisition mode was considered but excluded due to a halved signal-to-noise ratio (SNR) in the stimulated echo. 35 A precise description of the theory of these sequences and the required signal analysis achieving the frequency spectrum is given in. 36 A typical measured spectrum in the frequency domain after Fourier transformation of the free induction decay (FID) signal is shown in Figure 1. The abscissa is stated dimensionless in parts per million and describes the chemical shift of each substance inside the investigated voxel. Generally speaking, if there is a sufficient amount of fat and water inside the single voxel, the temperature can be determined by evaluating the difference in chemical shift of water and one of the fat peaks, which appear as the highest peaks in such spectra. The fat signal frequency spectrum consists theoretically of 6 spectral peaks, 37 but the methylene peak was chosen for this study due to highest intensity (in liver fat 70% 38 ) and best detectability with the available MR hyperthermia system. Another individual peak of the lipid signal (α-carboxyl or methyl type) could directly be determined only in a few measurements.
First, 1 measurement of the FID signal was implemented in each sequence. A voxel size of 64 cm3, a flip angle of 30°, a repetition time of T R = 1500 milliseconds, an echo time of T E = 135 milliseconds, a bandwidth of 1000 Hz, a vector size of 1024, 4 preparation scans, 1 acquisition per measurement, and no water or fat suppression were chosen initially as applied in the first trials of investigation of thermometry applicability at the University Hospital Erlangen. The intensity of methylene of the fat signal is greatly influenced by the echo time T E. Signals with strong coupling spin systems can be measured well with lower echo time, but the absolute intensity of the water and methylene signal is decreasing.
In the study, parameters were varied (for details see the subsequent section) in order to determine the temperature of the investigated voxel as accurately, precisely, and robustly as necessary for deep hyperthermia treatments with a temperature range of 36°C to 44°C. Currently, a temperature resolution of 0.1°C can accurately be measured by 3 to 4 small (diameter: 2 mm) intraluminally/intracavitary placed Bowman probes. The catheters containing the Bowman probes were identifiable with MRI as signal nulls 8 due to slight susceptibility artifacts. The voxel for MR-based thermometry can be positioned arbitrarily in the region of interest, and an accuracy of 1°C was desirable. 11 One of the prerequisites is the amount of fat and water in the voxel that is sufficient for quantifying a precise peak position. Also, the measurement time of the spectroscopy sequence had to be considered. Supervision of the heating process requires temperature measurements every 10 minutes, and every measurement should not take longer than 2 minutes, since other acquisitions such as those based on Bowman probes and patient feedback have to be realized between the measurements. The SNR, which was chosen as the best quality factor for the evaluation of the peak quality, was calculated by division of peak intensity and standard deviation of noise. The standard deviation of noise was calculated from the frequency spectrum intensities between −11 and −8 ppm, deducting intensities of line of best fit of this frequency range.
Peak Analysis Methods
Before starting parameter optimization, the quality of different peak detection algorithms should be verified. For temperature calculation, precise determination of both methylene and water peaks was necessary due to the subtle temperature dependency of the chemical shift. For that reason, the following peak analysis methods were compared. The first method models peaks by Lorentz curves fitted to the resonance frequency spectrum (Lorentz peak fitting method [LPFM]). Different software packages using nonlinear least squares fits were compared for the Lorentz curve approach (R, 39 Gnuplot 40 using the Levenberg-Marquardt-algorithm, and MATLAB ([R2013a] [Mathworks, Natick, Massachusetts] using the Nelder-Mead simplex algorithm).
The application of established MR spectroscopy analysis packages such as jMRUI (linear combination of model spectra www.jmrui.eu, 41 ) or LCModel (http://s-provencher.com/pages/lcmodel.shtml, 42 ) was taken into consideration. However, since an operator-independent and automated analysis method starting with the measured Digital Imaging and Communications in Medicine (DICOM) data was required, the in-house developed approach seemed to be most appropriate.
Before analysis, zero padding of the spectrum equal to the number of original data points was applied to stretch the signal data in the Fourier space resulting in interpolation in the frequency spectrum. Two smoothing methods were investigated to flatten the frequency spectrum—a baseline smoothing and the Savitzky-Golay smoothing. 43 The first approach subtracted the mean intensity of the first 5 data points from the frequency spectrum. The second method, also referred to as digital smoothing polynomial, applied a second-degree polynomial fit over 5 data points. This smoothing method reduces noise but keeps the shape and height of the peaks constant. 43
Two fitted Lorentz peaks should represent the expected resonance frequency spectrum with the peak position of fat (methylene signal) and water. As a similar method, we used the spectroscopy peak fitting tool integrated in an additional package of the syngo MR A35 software (Siemens, Erlangen, Germany). Finally, a singular value decomposition (SVD) of a Hankel matrix according to Laudadio et al 44 was evaluated. After the peak finding process, the peak difference between methylene and water peaks was calculated.
Analyses were conducted independently to identify 3 peaks (water, methylene, and a varying third peak) in the frequency spectrum. The third peak was detectable only in some voxels, as its visibility depends upon the underlying tissue. The intensity of the third peak was generally lower than the intensity of water and methylene. If the third peak was detected, it could be assigned to a specific position in the frequency spectrum but was only utilized to improve the stability of the peak fitting process.
Heating processes of the mayonnaise phantom were used to investigate different peak analysis methods with initial parameters using an adjusted voxel volume of V = 8 cm3 and a flip angle β = 90°. For such measurements, the mayonnaise phantom was heated from room temperature to 38°C, verified by 4 Bowman probes positioned inside the phantom. Data analysis compared the determined peak difference in the analyzed voxel to the absolute temperature measured by the respective Bowman probe by linear regression.
Parameter Optimization
Sequence parameters such as echo time T E (30-160 milliseconds in steps of 5 milliseconds and 160-290 milliseconds in steps of 10 milliseconds), flip angle β (10°-180° in 10° steps), and voxel volumes (1-64 cm3 with 1 mm steps in voxel side length between 10 and 20 mm and with 5 mm steps otherwise) were investigated to achieve frequency spectrums with less noise so that water and methylene peaks exhibit sufficient SNR, respectively, and are well analyzable with a Lorentz peak shape. Aside from these limits, the main aims remain, that is, short measurement time and high spatial resolution, that is, smallest voxel volume at sufficiently high SNR.
Investigations were performed in the homogeneous mayonnaise phantom positioned inside the Sigma30 applicator. No radio waves of the antennas were transmitted to heat the phantom in these measurements. The water bolus temperature was equivalent to the phantom and room temperature. For a precise positioning of the single voxel, gradient recalled echo 2-dimensional fast low-angle shot sequences were used for each spatial direction. The spectroscopy measurement was performed using the “advanced” shim mode.
Influence of Heterogeneous Temperature Distribution on Voxel Volume
In a further measurement, the mayonnaise phantom was locally heated to show the influence of inhomogeneous temperature distributions inside the investigated voxel to the peak difference in water and methylene peaks. The heat was transmitted by radio waves of the applicator antennas until all reference Bowman probes inside the phantom showed a temperature of ∼37°C. Room air and water bolus showed a temperature of 20°C. The smallest voxel volume with acceptable SNR was determined by varying the voxel volume (1, 8, 27, and 64 cm3). For each volume, 3 measurements were performed in each session within 1 minute.
Influence of Heterogeneous Tissue on Parameter Choice
Parameter analysis of flip angle, echo time, and voxel volume was repeated inside inhomogeneous pork phantoms. Also, these measurements were conducted at room temperature in the Sigma30 applicator. Thirty-two acquisitions per measurement were chosen.
Benchmarking the Optimized Sequence Parameters
Finally, the optimized sequence parameters were benchmarked against the initial values in thermometry measurements. A heterogeneous pork phantom was locally heated by the Sigma30 applicator to verify and compare the newly chosen sequence parameters in 4 single voxels. Bowman probes were placed to determine a reference temperature in these voxels. Probe positioning was verified by a computed tomography (CT) using a Sensation Open CT scanner (Siemens Healthcare, Erlangen, Germany). The pork phantom, the water inside the bolus, and the room air were initially adjusted to a temperature of 20°C. The phantom was heated until a temperature of 42°C was reached as measured by the Bowman probes. The 4 voxels of interest, each located at the same positions as the Bowman probes, were investigated by the spectroscopy sequence twice for every 2°C temperature increase alternating the initial parameters and the new chosen parameters. Data were analyzed by comparing the resulting peak differences in water and methylene peak in relation to the absolute temperature of the respective Bowman probe.
The measurements of the heated pork phantom were analyzed with the LPFM in Gnuplot, R, and MATLAB and with the Hankel matrix SVD to verify the chosen peak finding method for the adjusted sequence parameters.
Results
Peak Analysis Methods
Heating processes of the mayonnaise phantom were used to investigate different peak analysis methods at V = 8 cm3 and β = 90°. The 4 Bowman probes in the mayonnaise phantom showed a temperature of 20.4 (0.2)°C before and 37.7 (1.6)°C after 140 minutes of heating. The peak finding process located 2 and 3 peaks for nearly all measurements with the LPFM in MATLAB and with the Hankel matrix SVD method. The Gnuplot and R LPFM failed for some frequency spectra. The peak fitting tools showed deviations between different analysis methods and between resulting peak differences in 2 and 3 analyzed peaks (see Figure 4). The depicted Bland-Altman plot shows the comparison of the 2- and 3-peak analysis methods. The largest variations occurred for the peak differences analyzed by the LPFM in Gnuplot (95% confidence interval [CI]: ±0.25 ppm), followed by the results evaluated by the LPFM in R (95% CI: ±0.24 ppm). The smallest variation in the peak difference resulted with the LPFM in MATLAB (95% CI: ±0.03 ppm). Consequently, the LPFM in MATLAB was the most stable method in relation to the number of fitted peaks.
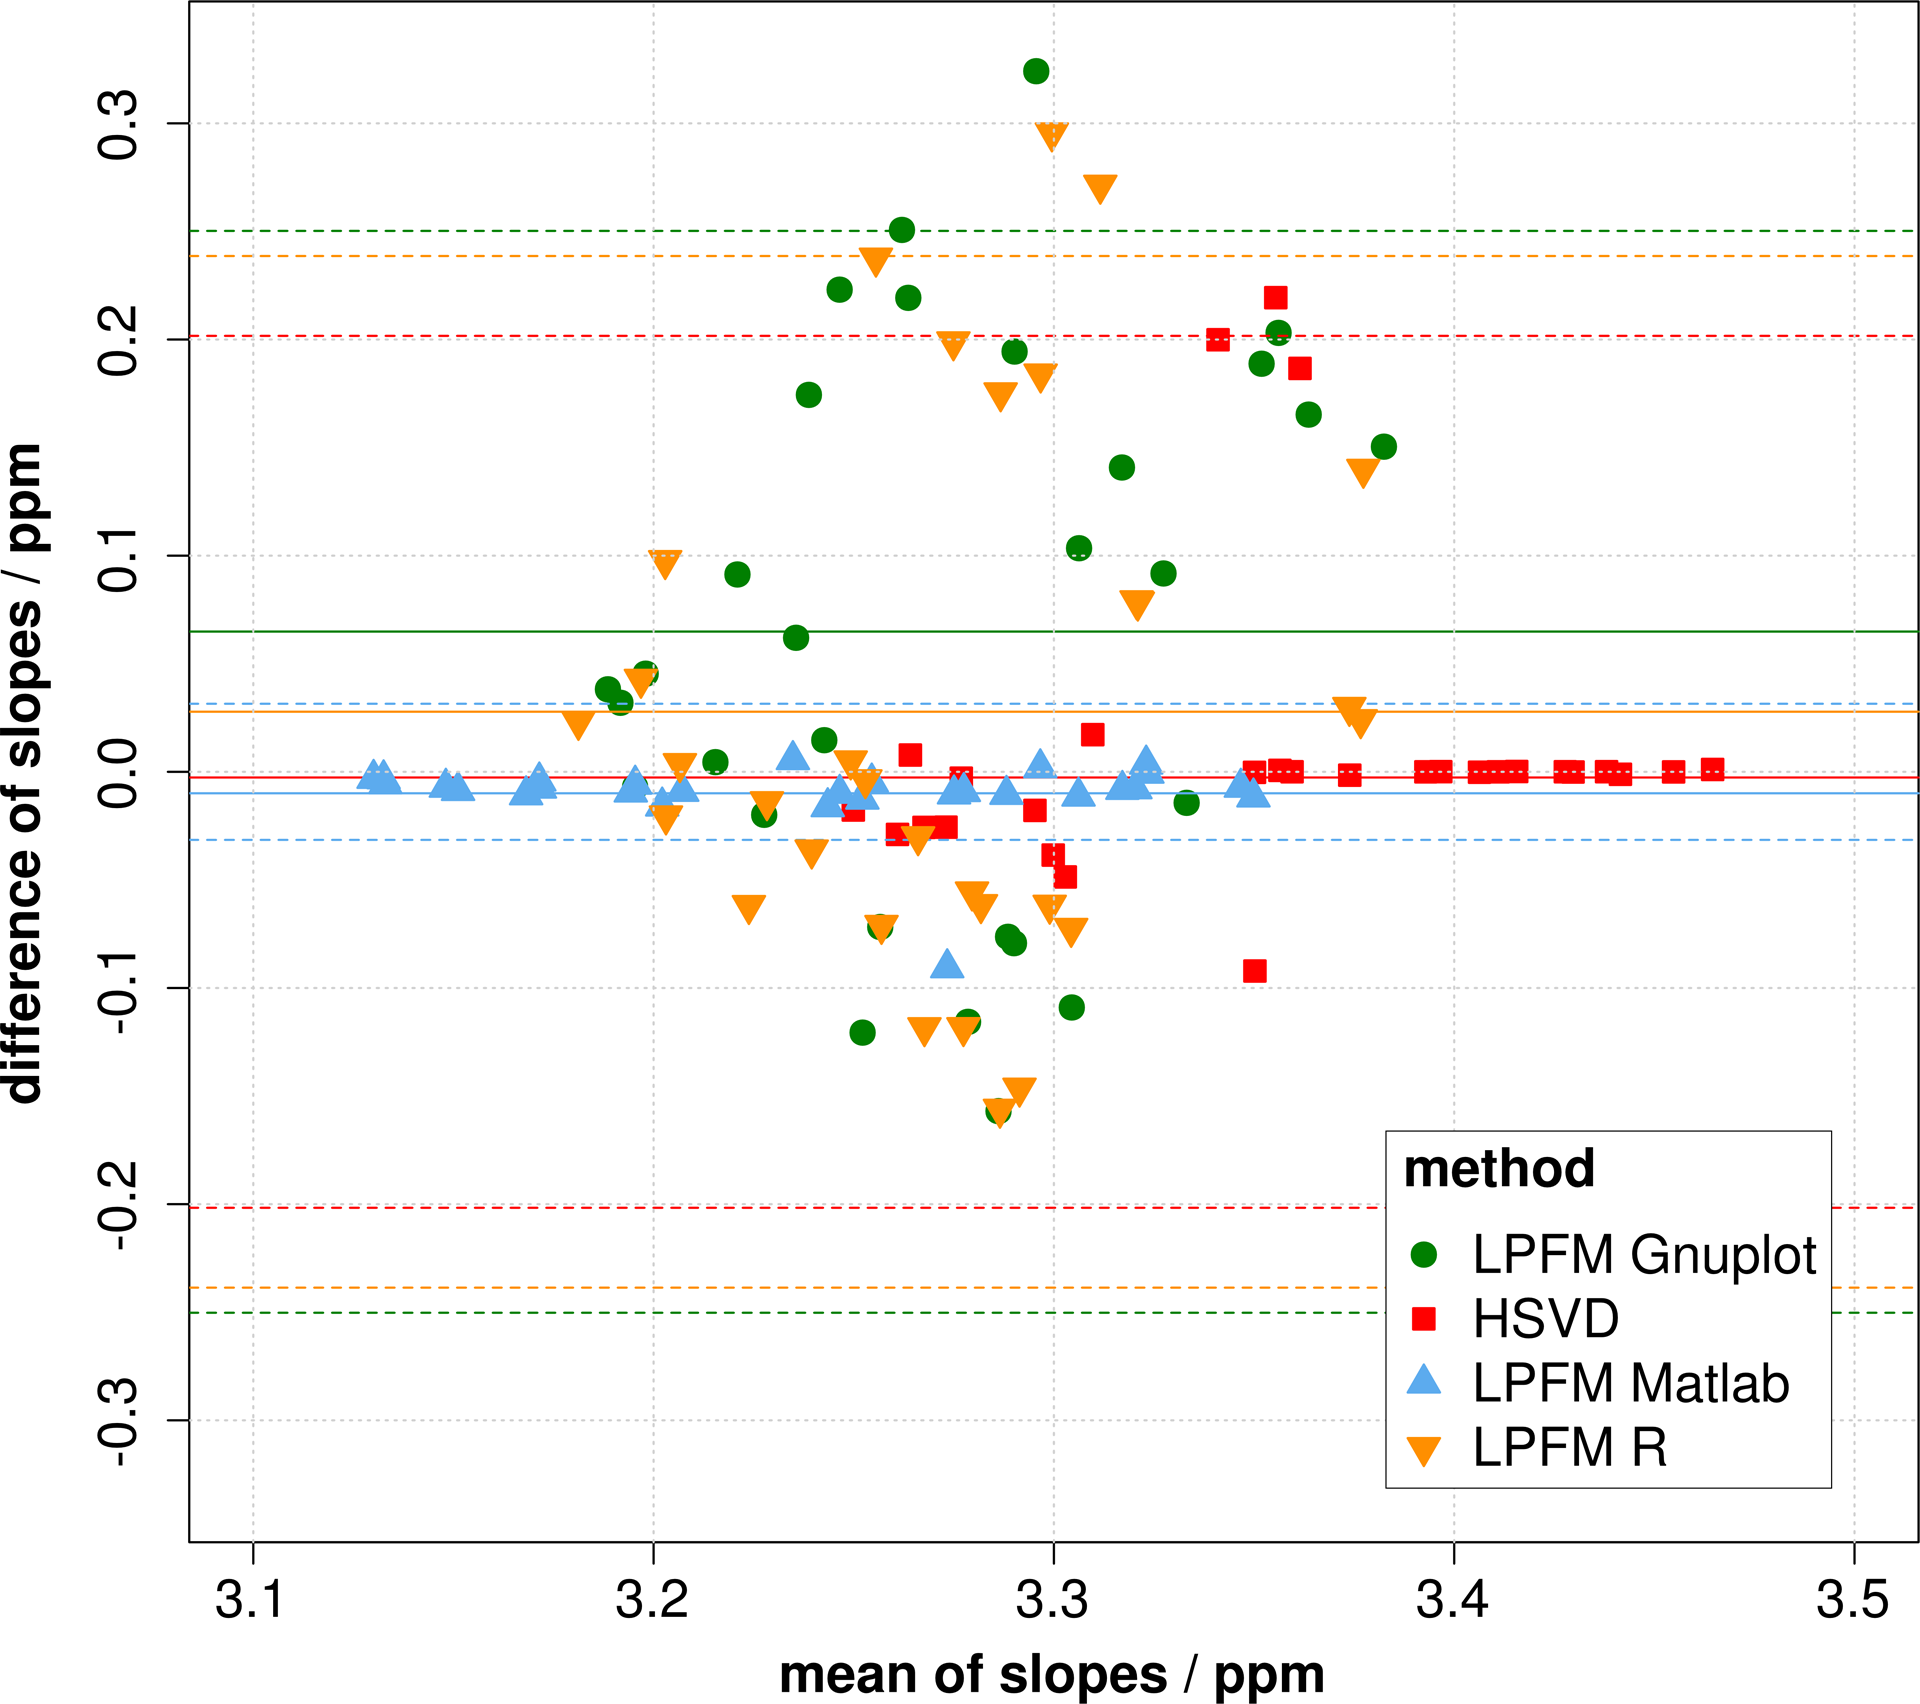
Bland-Altman plot: Comparison of 2- and 3-peak analysis methods for the LPFM in MATLAB, Gnuplot and R, and for the Hankel matrix singular value decomposition (SVD) method (difference against mean of slopes determined by the 2- and 3-peak methods)—mean of differences (solid line), 95% limits of agreement (dashed line).
Only the 2 peak analysis was performed with the syngo software tool. Although the resulting peak positions of the syngo software tool gave only 1 decimal digit, the resulting slope was comparable to the other methods. But the absolute, evaluated peak difference was always the highest (see Figure 5A). Yet, the handling of the syngo software tool is tedious. Each spectrum has to be loaded manually, and the analysis result has to be saved one at a time. It therefore does not offer a solution compatible to the clinical workflow.
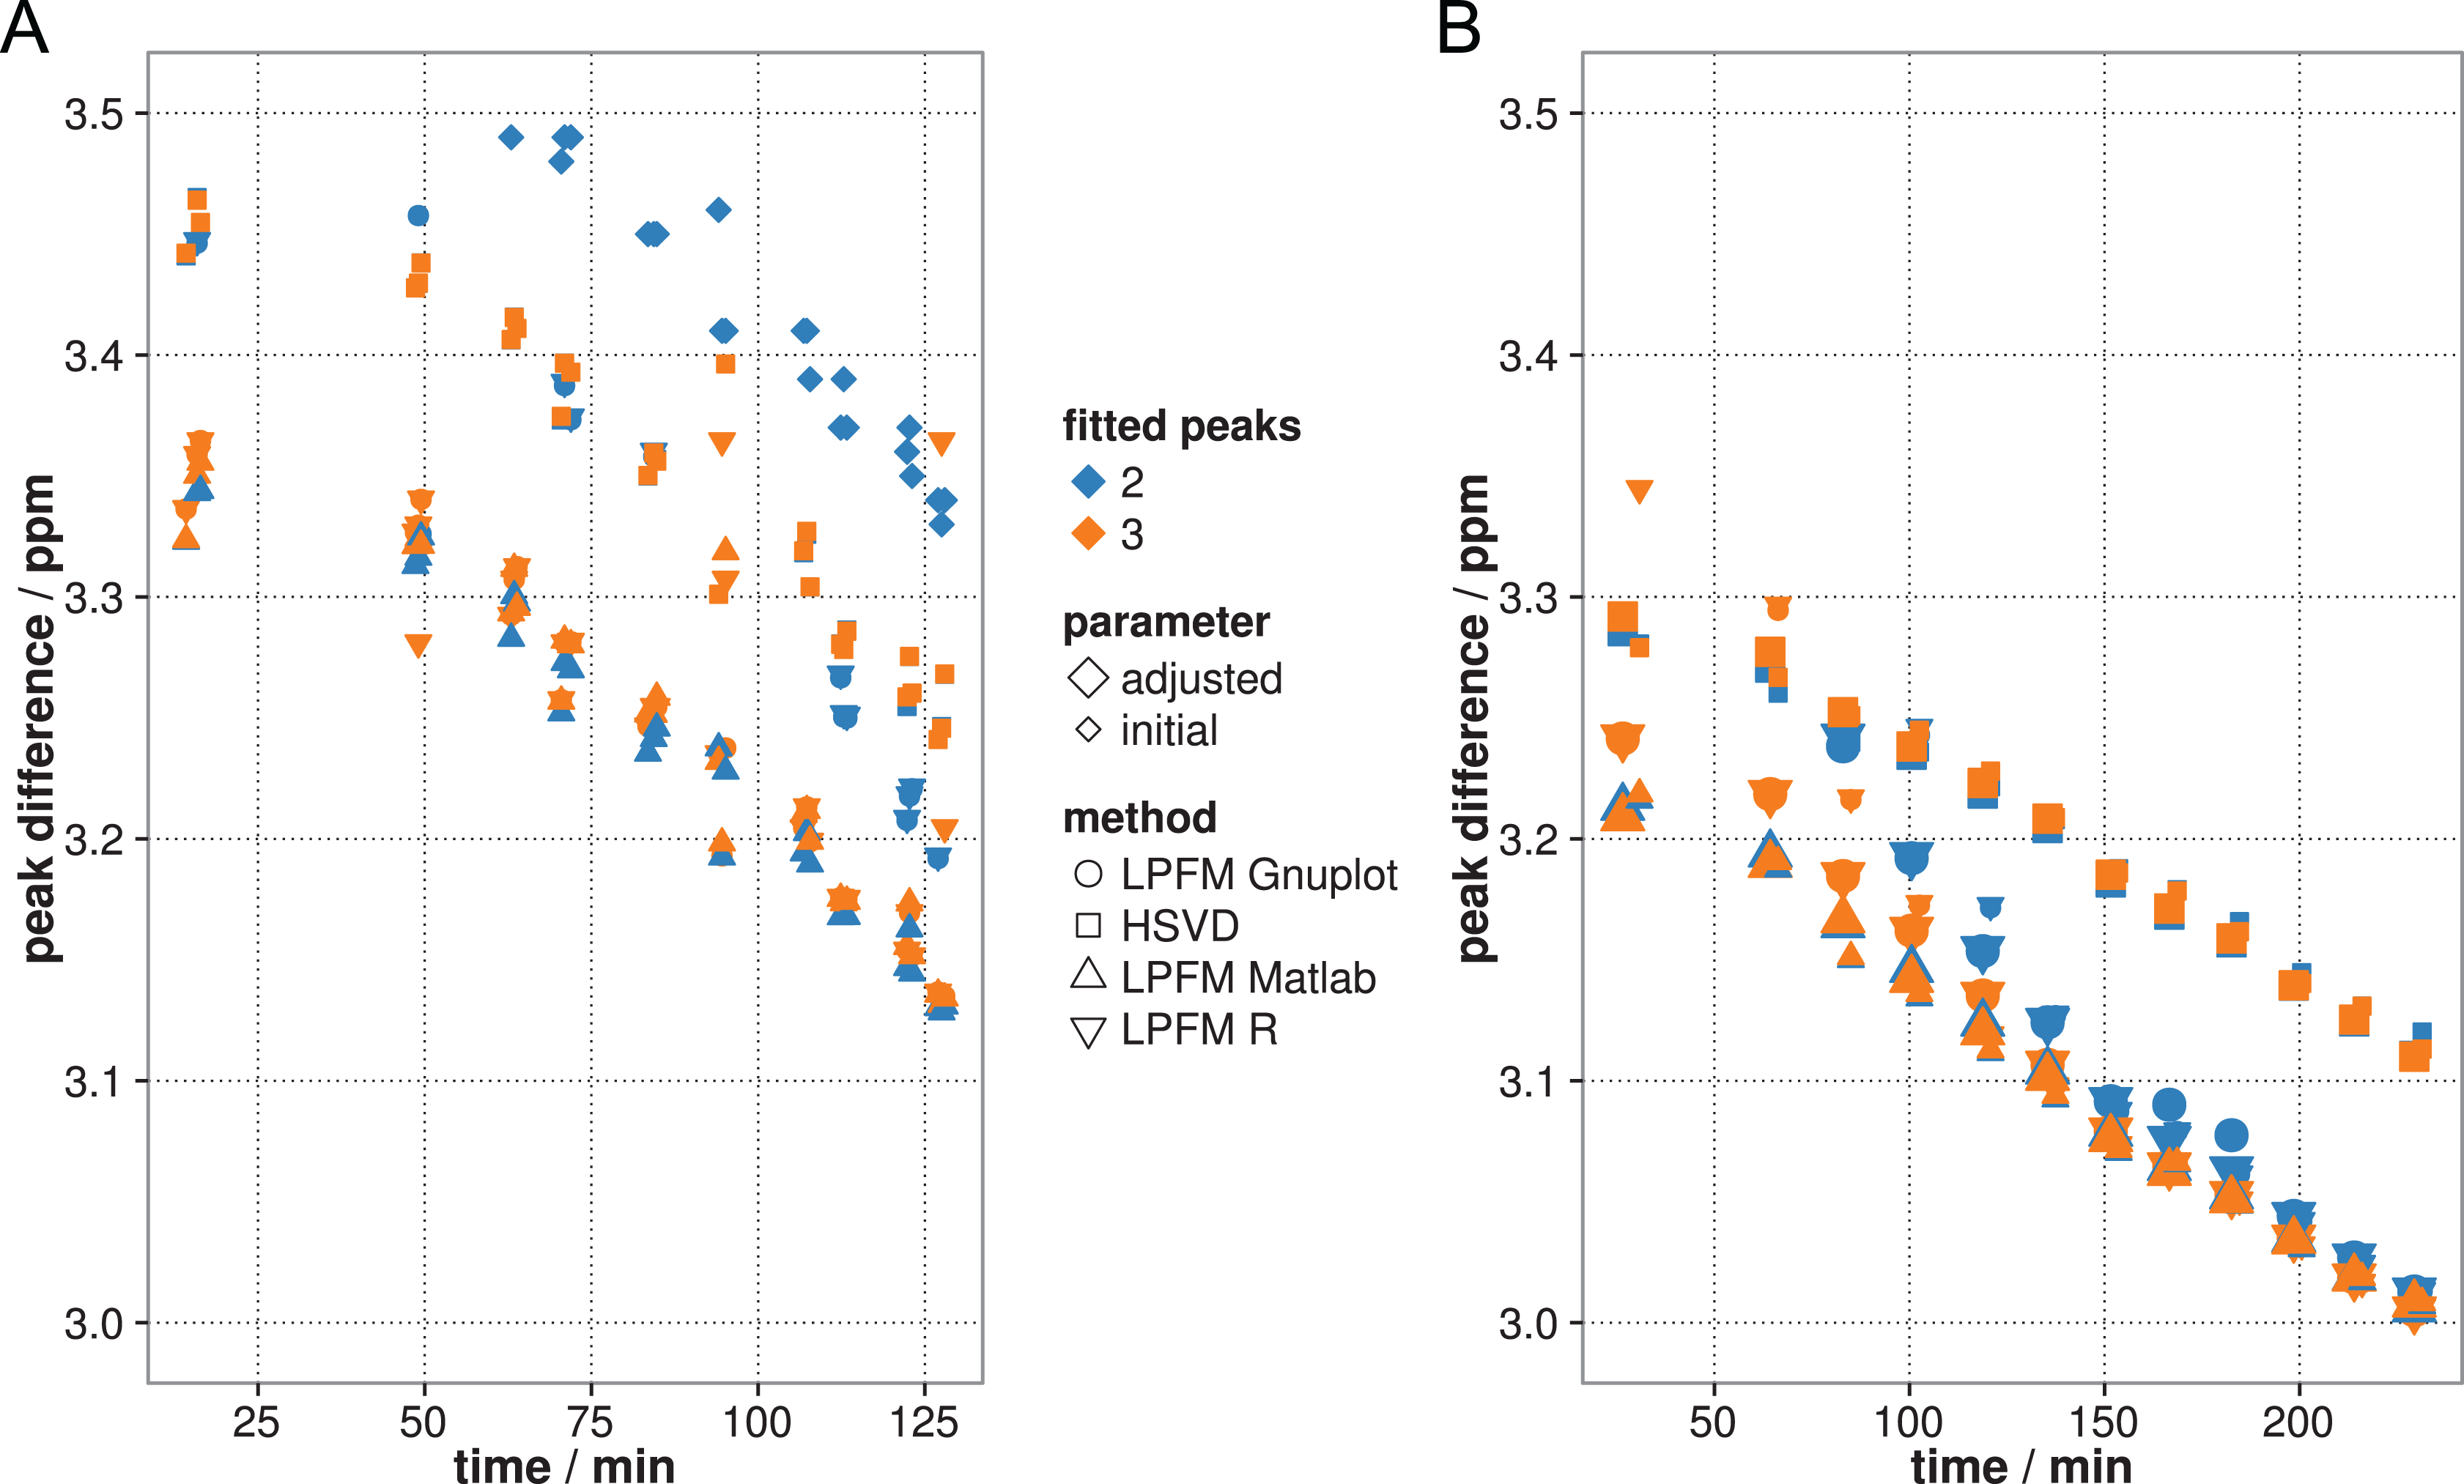
Peak analysis methods comparison: Lorentz fit method with MATLAB, Gnuplot and R, peak finding with the Hankel matrix singular value decomposition (SVD) and peak fitting of syngo MR A 35 method (only in the mayonnaise phantom [A]). Measurements were performed in 1 voxel inside a mayonnaise phantom (A) and inside a pork phantom (B). Initial and adjusted parameter measurements are shown in (B). The specified time indicates the instant of measurement during heating process.
Peak differences were compared regarding slope similarity for the MATLAB LPFM and for the Hankel matrix SVD method. A linear model of the pairwise differences in the peak differences was calculated for the 2-peak and 3-peak analysis, respectively. Both calculations resulted in a P value > .6 for the slope parameter, which indicated no significant difference in slopes (see Figure 5A). Peak analysis with the LPFM in Gnuplot or R showed nearly identical peak differences for the 2- and 3-peak analyses. The peak differences (mean [standard deviation]) were 0.0012 (0.0005) ppm for the 2-peak analysis and 0.00005 (0.00009) ppm for the 3-peak analysis, respectively. The P value of the slope of the linear model of the calculated differences again showed no significant difference. The LPFM using the MATLAB tool proved to be the most reliable tool, as it has the best stability and least uncertainty between 2 and 3 fitted peaks, especially for methylene peaks with a low intensity. It was thus used for all peak analyses needed in the remainder of the study.
Optimization of Echo Time TE
Measurements for the parameter optimization began with the homogeneous mayonnaise phantom. Water bolus and phantom both were at room temperature (20°C). A variation in echo time T E directly affects the measured spectrum. Peak intensities differed by 14% water peak intensity and by 7% methylene peak intensity comparing frequency spectra measured with T E = 135 milliseconds and with TE = 30 milliseconds, respectively (see Figure 6). Also, the detectable peaks next to the methylene peak changed. In this study, the respective detectable peak close to the methylene peak is called “varying third peak.” The methyl peak at 0.9 ppm was only detectable in the frequency spectrum of T E = 135 milliseconds measurements, while the α-carboxyl peak at −2.1 ppm was instead detectable in frequency spectrum of measurements with T E = 30 milliseconds 38 (see Figure 6). Signal-to-noise ratio decreases with higher T E. Both peak SNRs were almost zero in the measurement with an echo time of T E = 250 milliseconds (see Figure 7A). The SNR of water was always higher than the SNR of methylene. Because data showed a water SNR maximum close to T E = 60 milliseconds and a methylene SNR maximum close to T E = 40 milliseconds, measurements with T E = 55 milliseconds were performed more precisely in the inhomogeneous pork phantom in addition to those with an initial echo time T E = 135 milliseconds (see section “Influence of heterogeneous tissue on parameter choice”).

Measurements inside mayonnaise phantom: Frequency power spectrum comparison of measurements of different echo times with 32 acquisitions. The dot in each spectrum indicates the determined peak position.

Measurements inside the mayonnaise and pork phantom: Variation in different parameters regarding signal-to-noise ratio (SNR) of water end methylene peak. The frequency spectrums measured inside the mayonnaise phantom were analyzed after Savitzky-Golay smoothing; the frequency spectrums measures inside the pork phantom without the smoothing. The echo time T E (A) was investigated between 30 and 290 milliseconds inside the mayonnaise phantom. Inside the pork phantom (B), the echo time T E was varied in 2 different voxel volumes between 30 and 135 milliseconds. The flip angle (C) was varied between 10° and 180° in 10° steps for T E = 55 milliseconds and T E = 135 milliseconds measured inside the mayonnaise phantom, separately. The voxel size (D) was investigated with an echo time of T E = 135 milliseconds and was varied between 10 and 20 mm voxel side length in 1 mm steps, firstly, and secondly, voxel size was varied between 10 and 40 mm voxel side length in 5 mm steps. The voxel size measurements were also performed inside the mayonnaise phantom.
Optimization of Flip Angle β
The flip angle investigation with measurements in 10° steps between 10° and 180° was already performed using optimized parameters (V = 8 cm3, 32 acquisitions, T E = 55 milliseconds and T E = 135 milliseconds). The SNR of water and methylene peak increased with the flip angle until 90°, and between 90° and 180°, the resulted SNR was nearly constant (see Figure 7C). The measurements resulted in an optimal flip angle of β = 90°. However, a decrease in the SNR was expected for flip angles over 90° as discussed by Gonzalez-Castillo et al. 45 Also, T E = 55 milliseconds had higher SNR than T E = 135 milliseconds.
Optimization of the Voxel Volume V
The influence of voxel size on MR spectroscopy measurements is shown in Figure 7D for the homogeneous mayonnaise phantom at room temperature. As expected, the peak intensity increased with larger voxel volumes. However, the theoretically expected linearity between SNR and voxel volume could not be shown in the complete range of measured voxel side lengths. Influence of voxel volume on SNR is more pronounced for water than for methylene.
Influence of Heterogeneous Temperature Distribution on Voxel Volume
Local heating of the mayonnaise phantom resulted in partial volume effects in temperature and showed the importance of spatial resolution and thus the preference of choosing smaller voxel sizes. The V = 64 cm3 voxel displays the region with the highest peak difference; the region of smaller investigated voxels contained only lower peak differences and displays, hence higher temperatures. A 20-mm voxel side length, a voxel volume of V = 8 cm3, was chosen as the best voxel side length: A preferably high water and methylene SNR was achieved and still the voxel volume remained quite small.
Influence of Heterogeneous Tissue on Parameter Choice
For a phantom closer to human tissue, parameter optimization measurements were repeated partly inside pork phantoms because of heterogeneous tissue and tissue transitions. General observations included that positioning of the voxel using the primary acquired images of the phantom was much more difficult since the fat content is much lower, resulting in a lower methylene peak. The measured area was more homogeneous in tissue composition and temperature when the voxel volume was decreased.
The results of quantifying the influence of T E are shown in Figure 7B. Although absolute numbers changed compared to the findings of parameter optimization using the mayonnaise phantoms, the conclusions do not. Thus, a T E of 55 milliseconds remains to be the optimum choice.
Benchmarking the Optimized Sequence Parameters
Peak differences and resulting regression lines of measurements inside the locally heated pork phantom are depicted in Figure 8A. Only 3 investigated voxels could be evaluated due to missing temperature information on the fourth Bowman probe. Results of the linear regression are shown in Table 1. A Levene test showed that the residuals of the linear regression of initial and optimized parameters varied significantly (P < .001). Evaluation of the separated linear regressions resulted in a higher variability in residuals of the initial parameter measurements compared to the adjusted parameter investigations (see Figure 8B). Mean and standard deviation of intercept and slope (see Equation 2) of linear regressions of the measurements with the adjusted parameters resulted in an intercept of 3.550 (0.117) ppm and a slope of α = −0.010 (0.001) ppm/°C.

(A) Comparison of peak differences measured with the initial parameters (points) or with the adjusted parameters (triangles) inside 1 of the 3 voxels (orange, green, and blue) inside the pork phantom against absolute temperature measured with the respective Bowman probe. (B) Boxplot (minimum, lower quartile, median, upper quartile, maximum) of residuals of the linear regressions. Ini1-3 and adj1-3 indicated the 3 voxels each for the initial and adjusted spectroscopy settings, respectively.
Results of Linear Regression of Locally Heated Pork Phantom Measurements Investigated in 3 Different Single Voxels.

The verification of peak finding methods for measurements with adjusted MR sequence parameters for one of the investigated voxel is shown in Figure 5B. According to linear regression analysis, determined peak differences in Gnuplot and R LPFM showed the highest variation in R 2, whereas LPFM in MATLAB and the Hankel matrix SVD methods are similar for all used parameters (R 2 ∼ .99).
Discussion
In this study, MR spectroscopy parameters and data analysis algorithms regarding peak finding were optimized with respect to measuring absolute temperatures in phantoms in a deep hyperthermia setting. This dedicated application results in boundary conditions that are uncommon compared to typical use of MR spectroscopy in diagnostics. With respect to hardware, the combined use of MR and hyperthermia allows using the MR body coil only because additional coils do not fit—combined with the hyperthermia applicator—into the MRI bore. The fact that the hyperthermia applicator could induce magnetic field inhomogeneities influencing the precise pulses of the applied PRESS sequence was not taken into consideration due to possibility of clinical imaging application proved by the manufacturer. The hyperthermia workflow further requires in 10-minute intervals precise temperature measurements (∼1°C as it could be achieved with the PRF shift method in a 3-T MRI 46 ) with a spatial and temporal resolution of about 1°C/1 cm3/1 min according to Kuroda, 11 imposing precision measurements in the order of the second decimal digit of the difference in water and methylene peak position in ppm. Kuroda 11 recommended the application of SVS for thermometry in only 1 discrete spatial position.
Peak finding methods allowed for detecting 2 or 3 peaks (water, methylene, and a varying third peak). Most of the analysis problems occurred during the application of LPFM implemented in R and Gnuplot: Peak positions could not be determined or peak differences in water and methylene peaks varied substantially for fits of 2 and 3 peaks. Other fitting methods for 2 peaks, that is, LPFM in MATLAB, syngo software tool analysis, and Hankel matrix SVD method, yielded reliable peak positions. The constant shift between the results of the Hankel matrix SVD method and LPFM (MATLAB and syngo software tool) needs to be investigated in more detail in order to understand the bias. However, only the determined slope of the subsequent regression line/calibration curve needs to be equal and stable for an experimental campaign or the treatment of a patient. The combination of stability, reliability, and ease of use yielded to the decision to use MATLAB’s LPFM for all further analyses. In no case, the analysis method should be changed during a single evaluation. Similar findings were reported by Zhu et al who investigated the usage of MR spectroscopy thermometry in rat brains with NAA, Cho, and Cr as the temperature-independent reference peaks. 27 Also, these authors decided to apply an LPFM analysis using MATLAB.
A single voxel inside the investigated tissue region was used for spectroscopy. The best results during the parameter optimization could be achieved with a repetition time of T R = 1500 milliseconds, 1024 data points, 32 acquisitions and with adjusted parameters such as an echo time of T E = 55 milliseconds, a flip angle of β = 90°, and a voxel volume of V = 8 cm3.
Since only the body coil can be applied due to limited space, the applicator inside the field of view is in part composed of metal, and a bolus of deionized water is needed to couple the transmitted electromagnetic radiation of the antennas to the patient, and thermometry with MR spectroscopy techniques has to cope with a low SNR. Therefore, attempts were made to increase the SNR by optimizing the spectroscopy parameters.
Despite advantages of increased resolution, a voxel volume smaller than V = 8 cm3 was not applicable due to the decreasing SNR. For homogeneous tissues with constant temperatures like the mayonnaise phantom, an increase in voxel size could be advantageous regarding SNR. But even in case of homogeneous temperatures, large voxel sizes are not recommended for heterogeneous tissues since a larger voxel volume inevitably include heterogeneous temperatures, variations in tissue composition inside the voxel, and hence the tissue-specific spectrum. Also, a shimming with high precision would be more difficult. Investigated tissues with temperature gradients influenced water and methylene peak distance in the frequency spectrum depending on the voxel volume. Since sequence parameter optimization aimed for temperature measurements inside patients during hyperthermia treatments, heterogeneous tissues with temperature gradients are considered to represent the general case so that small but well-positioned voxels should be used. The flip angle of β = 90° resulted in the highest intensity. Larger flip angles did not change the intensity noticeably as expected theoretically 45 but would increase the measurement time. An increasing number of acquisitions would optimize the SNR. During hyperthermia treatments, yet, there is not enough time for MR spectroscopy measurements longer than 2 minutes, and uncertainties due to patient movement and organ motion cannot be neglected. Hence, the compromise of 32 acquisitions for each measurement, which takes ∼1 minute, was made.
The variation in echo time had a strong influence on SNR but also leads to a tissue-specific response, that is, echo time-dependent accentuation of peaks next to the methylene peak. These could perhaps be used for a temperature evaluation method based on multiple temperature-independent peaks to reduce thermometry uncertainty with only 1 reference peak.
With all sequence parameters and methods for peak analysis, the difference in water and methylene peak could be calculated. First calibration curve investigations inside the pork phantom resulted in α = −0.010 (0.001) ppm/°C. This slope is compatible with the determined slope of McDannold et al 47 of αMcDannold = 0.00893 (0.00002) ppm/°C. They correlated the calculated chemical shift of a line scan echo planar spectroscopic imaging sequence of a 1.5-T MRI with an absolute temperature measured by a thermocouple measured inside a mayonnaise/lemon juice phantom. Corbett et al 25 investigated the use of MR spectroscopy to analyze the temperature inside a swine brain by calibration measurements inside a model solution. Measurements of the resonance frequency difference between water and NAA in a 4.7-T MRI scanner using a dedicated surface coil resulted in a slope of αCorbett = −0.0103 (0.00006) ppm/°C. Covaciu et al 31 tried to analyze the temperature inside a human brain with MR spectroscopy of a 1.5-T MRI and with a head coil, using metabolite aqueous solutions such as NAA, glycerol-phosphocholine, and Cr for the necessary calibration curve. They determined for the NAA analysis a slope of αCovaciu = −0.0103 (0.00008) ppm/°C. Compared to our investigation, all reported studies benefit from a combination of higher field strengths, additional coils, and the missing hyperthermia applicator. Measurements were thus achievable at reduced uncertainty. Possible strategies to improve measurement precision in a hyperthermia setting are increasing the MR field strength, for example, using a diagnostic 3-T rather than 1.5-T scanner. In addition, first studies show that the development of a combined MR coil/hyperthermia antenna for 7-T MRI is feasible. 48
A disputable point is the dependency of the determined slope on the kind of investigated tissue. Potentially, calibration curves are object specific, that is, calibration curves for mayonnaise phantoms, pork phantoms, and patients should be established, analyzed, and applied separately. Alternative approaches include the determination of either a single calibration curve (equal for all tissues) or calibration curves dependent on fat amount and composition, potentially even differentiating the studied object. Then, several calibration curves would be essential for different tumor entities and accordingly different treatment regions due to various tissue compositions. Conclusive answers on the tissue-type dependence of calibration curves will require more investigations on phantoms, animals, and patient data.
Along the applicability of a specific calibration curve, the accuracy of 1 single measurement has to be evaluated. Since a thermometry precision of 1°C was aimed for, the slope and the peak difference consequently had to be clearly defined minimally up to the second decimal value. As shown in Figure 8B, residuals of linear regression of peak difference against the Bowman probe temperature measurement resulted in a standard deviation of 0.016 ppm with the initial parameters . On the contrary, a residual standard deviation of 0.005 ppm was achieved with adjusted parameters and thus an increased precision in determined temperature of ±0.5°C, assuming that 0.01 ppm peak difference corresponded 1°C. This uncertainty is larger than the 0.2°C uncertainty in phantom experiments of Childs et al 49 with a single voxel MR spectroscopy method. However, Childs et al achieved this uncertainty in a 3-T MRI.
Another argument concerns the effects of ion concentration 50 and pH value regarding the water chemical shift. Corbett et al 25 could not show an influence of the pH value in the measured range of 5.5 to 7.6, and Cady et al 20 excluded a dependence of their applied chemical shift references due to a proven independence of these substances for pH values between 6 and 8, which covers the pH value range of their investigated tissue. However, both Cady et al 20 and Lutz et al 51 were unsure to neglect an influence completely. In the present study, neither the effects of ion concentration and pH value nor the effects of macromolecular concentration were under consideration. But they should be kept in mind as possible source of uncertainties during temperature measurements in future investigations and in particular in hyperthermia patient treatments.
Apart from an application in deep hyperthermia, for which a high precision is an essential yet challenging task, the proposed MR spectroscopy-based thermometry could also be an interesting option for other thermal therapies with less requirements in temperature accuracy due to much higher temperature differences. For example, a temperature rise of over 40°C can be achieved during high-intensity focused ultrasound treatments. 52
Conclusion
Nearly all peak analyzing methods were suitable to detect water and methylene peaks in the measured frequency spectrum. The most stable and reliable method was the LPFM in the MATLAB tool, independent of the number of fitted peaks. Parameter optimization study showed that the spectroscopy sequence could determine the resonance frequency spectrum with the lowest uncertainty and thereby best analyzability of the resonance frequency difference for measurements in inhomogeneous materials with a small voxel volume of V = 8 cm3, an echo time of T E = 55 milliseconds, and a flip angle of β = 90°. These results form a good basis for clinical studies with noninvasive absolute thermometry by MR spectroscopy during hyperthermia treatments.
Footnotes
Abbreviations
Acknowledgments
The authors thank the whole medical physics research group for all helpful ideas and discussions. The present work was performed in fulfillment of the requirements for obtaining the degree Dr. rer. biol. hum. of the Friedrich-Alexander-Universität Erlangen-Nürnberg (FAU).
Declaration of Conflicting Interests
The author(s) declared no potential conflicts of interest with respect to the research, authorship, and/or publication of this article.
Funding
The author(s) disclosed receipt of the following financial support for the research, authorship, and/or publication of this article: The University of Mannheim, the FAU Erlangen-Nürnberg, and the Dr. Sennewald Medizintechnik GmbH, Munich, are currently cooperating in a public funded project (“Gefördert durch: Bundesministerium für Wirtschaft und Energie aufgrund eines Beschlusses des Deutschen Bundestags”, Grant KF2137110TS4) that is related to hyperthermia but not directly to the work presented in this manuscript.