
Abstract
Although not yet ready for clinical application, methods based on Raman spectroscopy have shown significant potential in identifying, characterizing, and discriminating between noncancerous and cancerous specimens. Real-time and accurate medical diagnosis achievable through this vibrational optical method largely benefits from improvements in current technological and software capabilities. Not only is the acquisition of spectral information now possible in milliseconds and analysis of hundreds of thousands of data points achieved in minutes, but Raman spectroscopy also allows simultaneous detection and monitoring of several biological components. Besides demonstrating a significant Raman signature distinction between nontumorigenic (MCF-10A) and tumorigenic (MCF-7) breast epithelial cells, our study demonstrates that Raman can be used as a label-free method to evaluate epidermal growth factor activity in tumor cells. Comparative Raman profiles and images of specimens in the presence or absence of epidermal growth factor show important differences in regions attributed to lipid, protein, and nucleic acid vibrations. The occurrence, which is dependent on the presence of epidermal growth factor, of new Raman features associated with the appearance of phosphothreonine and phosphoserine residues reflects a signal transduction from the membrane to the nucleus, with concomitant modification of DNA/RNA structural characteristics. Parallel Western blotting analysis reveals an epidermal growth factor induction of phosphorylated Akt protein, corroborating the Raman results. The analysis presented in this work is an important step toward Raman-based evaluation of biological activity of epidermal growth factor receptors on the surfaces of breast cancer cells. With the ultimate future goal of clinically implementing Raman-guided techniques for the diagnosis of breast tumors (e.g., with regard to specific receptor activity), the current results just lay the foundation for further label-free optical tools to diagnose the disease.
Introduction
Important factors in improving the overall survival (OS) rate for cancer include earlier, reliable disease detection and diagnostics by unequivocal data so that treatment can be applied and progress monitored thereafter. The most commonly used clinical diagnosis methods for breast cancers are X-ray mammography, ultrasonography, magnetic resonance imaging (MRI), and positron emission tomography (PET). 1 –8 Due to well-known sensitivity and specificity limitations, especially with young patients (i.e., high breast density), X-ray mammography is not an accurate screening method for differentiating between benign and malignant tumors, leading to as high as 75% and 34% of false-positive and false-negative results, respectively. 1 –3 Ultrasonography, too, has low spatial resolution. 4 While MRI offers good contrast between soft tissue and bone, its long duration and the high cost of the instrument and medical procedure are some of the method’s drawbacks. It may also cause side effects in patients such as hyperthermia or kidney problems related to the use of gadolinium for contrast. 5 The PET and the recently developed use of positron emission mammography for improving PET low resolution and contrast are engaging complementary methods, with the drawback of high random exposure. 6 –8
Although not yet clinically implemented, more accurate and rapid imaging results can be achieved using optical methods such as diffuse optical tomography, 9 fluorescence mediated tomography, 10,11 photoacoustic imaging, 12 acoustic–optical imaging, 13 and confocal fluorescence microscopy. 14 Optical methods present other advantages and benefits, as they are based on nondestructive, nonionizing radiation (i.e., noninvasiveness in the context of safety). Of all the optical methods, fluorescent microscopic analyses such as histopathological and confocal measurements are commonly used for tumor visualization. However, fluorescence microscopy has the main disadvantage of limited multiplexing capability due to the broad emission profile of fluorophores (e.g., difficulty in deconvoluting mixtures of signals).
Traditional cancer classification is based on the morphologic appearance of tissue (histology). Since these morphologic changes are accompanied by chemical composition modifications, we proposed here an alternative method for more precise and faster tumor cell detection, an alternative based on Raman spectroscopy. The attractiveness of this technique arises from its capability of providing well-defined, narrow vibrational peaks that are associated with specific biochemical signatures of molecules found on different types of proteins, lipids, nucleic acids, and carbohydrates. 15 –35 Thus, it has the intrinsic advantage of directly investigating the composition and structure of the material under study at once and without introducing any external labels and dyes; it can yield important information just by monitoring the material’s structural modifications in response to the biological environment. Many bioconstituents have been directly, independently, and simultaneously assessed using this technique, allowing in situ measurements on nontagged analytes. 15 –35 Another advantage of Raman spectroscopy over a similar optical vibrational technique, infrared absorption spectroscopy, is the option of choosing different excitation wavelengths to avoid the limitation of strong water absorption of infrared light (a critical requirement for assays in living tissue and future potential in vivo applications).
In this study, we used Raman microscopy, which combines vibrational spectroscopy with optical imaging, as a label-free optical method of detecting and monitoring the activity of human epidermal growth factor receptor 1 (EGFR or erbB1) in breast cancer cells. Localizing the overexpression of EGFR, which are transmembrane proteins that mediate (in the presence of epidermal growth factor [EGF] ligands) cell growth in a variety of tissues, 34 could lead to ways of preventing cancer proliferation. Cancer treatments centered on EGFR as a target for therapy have proven to be effective for earlier detection of this disease. 38 –42
However, direct identification of EGFR is not yet achievable using Raman spectroscopy, due to the presence of this protein at concentrations below detectable limits (i.e., nanomolar concentrations at physiological levels). To overcome this impediment, EGFR tagging with metallic nanoparticles and surface-enhanced Raman spectroscopy for data recording were used. 41 –43 The aim of the current analysis is not direct detection of EGFR, but to demonstrate that confocal Raman microscopy can be used as a viable label-free method of monitoring cells that exhibit erbB1 overexpression. This approach is based on observable cellular morphological changes depicted in the current results. It also raises the possibility of more accurate identification of cancer stages and proliferation, as it may contribute to direct, in vitro visualization of erbB-1/2 localization at the molecular scale. To prove the feasibility of analyzing the function of this important oncogene protein by Raman spectroscopy, a comparison between Raman profiles of matched breast cancer cell lines was first carried out and discussed. Concomitant investigations by gel electrophoresis have also been performed and analyzed in this work.
Materials and Methods
Control Sample Preparation
MCF-10A (nontumorigenic breast epithelial cells, control sample) and MCF-7 (tumorigenic, control sample) human breast cancer cell lines were grown under identical conditions in Roswell Park Memorial Institute (RPMI) media, supplemented with 10% heat-inactivated fetal bovine serum, 100 U/mL penicillin, and 100 μg/mL streptomycin. Plain microscope slides coated with Poly-
Western Blotting
Cells were grown to ∼90% confluency in normal culture conditions and starved in serum-free media for 24 hours prior to EGF addition. After 24 hours, control cells were left in serum-free media, whereas the experimental cells were treated with 100 ng/mL of EGF for 30 minutes. All cells were then washed with ice-cold PBS and detached from plates by trypsin (0.25% wt/vol from Hyclone, GE Healthcare Life Sciences, Pittsburgh, PA). Cells were centrifuged for 5 minutes at 1200 rpm. The cell pellets were then resuspended in different cold lysis buffers: RIPA-like (20 mmol/L Tris [pH 7.5] containing 137 mmol/L NaCl, 100 mmol/L NaF, 10% glycerol, 1% NP40, 2 mmol/L Na3VO4, 1 mmol/L phenylmethylsulfonyl fluoride, 10 μg/mL aprotinin, and 10 μg/mL leupeptin), NP-40 (20 mmol/L Tris [pH 8], 137 mmol/L NaCl, 10% glycerol, 1% NP-40, 2 mmol/L EDTA), and Milliplex Map Lysis Buffer (Billerica, Massachusetts). Resuspended cell pellets were then incubated on ice for 10 minutes and cleared by centrifugation. Protein concentrations of the supernatant were determined using Bio-Rad Protein Assay Dye Reagent (Bio-Rad Laboratories, Hercules, California). Samples were resolved on 8% to 12% sodium dodecyl sulfate–polyacrylamide gel electrophoresis (30 mg of lysate per lane) and then transferred onto Immobilon-P membranes (Millipore, EMD Millipore Corp., Billerica, MA). The membranes were blocked in 10% milk in TBST for 1 hour at room temperature. Next, the primary antibodies antiphospho Akt (Ser473) and antiphospho p44/42 MAPK (Thr202/Tyr204, 1:1000 dilutions; Cell Signaling Technology, Massachusetts) were added and incubated overnight at 4°C. Membranes were then washed several times in TBST, and secondary antibodies (1:5000 dilution) were added for 1 hour at room temperature and then washed again 5 times in TBST (5 minutes/wash) prior to detection using the ECL method (Thermo Fisher, Pierce Biotechnology, Rockford, IL).
Confocal Raman Measurements
The confocal Raman measurements were acquired at ambient conditions in a backscattering geometry, with an alpha 300R WITec system (WITec GmbH, Ulm, Germany) using the 532-nm excitation of a frequency-doubled neodymium-doped yttrium–aluminum–garnet (Nd:YAG) laser. To avoid sample damage, the laser power was carefully kept at values less than 5 mW. A 488-nm-diameter single-mode optical fiber was used to couple the laser beam into the microscope. The laser excitation, filtered by a holographic band-pass filter, was collimated with a 100× objective lens with a numerical aperture of 0.90 (Olympus, Japan) onto the sample surface. The scattered light collected with the same objective was first passed through a holographic edge filter and then optically guided using a 50-μm-diameter multimode optical fiber to a back-illuminated and VIS AR–coated Marconi 40-11 charge-coupled device (CCD) detector for data recording. The 50-µm multimode optical fiber used to couple the collected Raman scattering light to the spectrometer acts both as a pinhole source for confocal microscopy and as an entrance slit. An array of 150 × 150 Raman spectra were recorded for all Raman images using an integration time of 50 milliseconds/spectrum. The surface Raman mapping images of independent cells were acquired with 25 × 25 μm scan sizes. Besides the WITec Control 1.60 software, which controls the piezoelectric stage for sample scanning and is normally used for data acquisition, the Cluster Analysis package of the WITec Project Plus software was used for data analysis.
Results and Discussion
Although raster scanning used in acquiring Raman mapping images requires long acquisition times (i.e., minutes), making Raman microscopy impractical for potential in vivo clinical diagnosis, integration of tens of thousands of accumulated spectra (22 500 spectra for current measurements), definitely provides, from a scientific perspective, more accurate information regarding morphological differences between breast cancer cells and nontumorigenic breast epithelial cells. Thus, not only are the representative Raman integrated spectra of MCF-10A control sample cells (black line) and MCF-7 control sample cells (red line) presented in Figure 1 in good agreement with similar results reported in the literature, 16 –35 but they unambiguously show a distinction between cancerous and noncancerous cells through intensity variations for a number of vibrational lines. A break between 1900 and 2500 cm−1 with a slight horizontal scale change thereafter is applied to these spectra to allow inclusion of all regions of interests in the same figure. Also, a vertical translation of the MCF-7 spectrum was applied for easier visualization.

Integrated Raman spectra of two confocal Raman mapping images: MCF-10A nontumorigenic control sample cell (black spectrum) and MCF-7 breast cancer control cell (red spectrum).
The two Raman spectra in Figure 1 are dominated by lipid–protein profiles in the 2800 to 3000 cm−1 spectroscopic region. A significant increase in the intensity of the Raman peak at 2940 cm−1 is observed in the case of the MCF-7 cancerous sample. Since this vibration corresponds to protein components such as charged amino acids and proline, threonine, and histidine, its greater contribution is expected with overexpression of erbB-1/2. It has already been reported and considered as an indicator of carcinogenesis. 17,22 There are no visible modifications in the intensities of Raman features around 3055 and 2880 cm−1, which are assigned to aromatic and aliphatic groups of amino acids, respectively. A slight increase in the intensity of the broadband around 3358 cm−1 is seen in the spectrum of the malignant sample. This band could be attributed to the O–H stretching mode of water, 36 as well as to N–H stretching bands of proteins and N–H stretching vibrations of DNA. 18 Since Raman is known to not be very sensitive to water absorption, assignment of this band should be placed in the context with observed intensity increases of other features at 1097 and 1658 cm−1, which are due to DNA and protein content, respectively. However, the potential contribution to the broadness of the 3358 cm−1 band from adipose content should not be disregarded. 36
Besides the aforementioned noticeable enhancement in the strength of vibrational lines corresponding to higher protein content in cancerous cells, other Raman peaks such as those around 752, 1240, and 1587 cm−1 also reveal visible intensity changes. The most remarkable aspect of the comparison between these two spectra is evident in this lower vibrational region. While in the spectrum of the noncancerous sample two dominant Raman lines at 752 and 858 cm−1 are observed, which are related to DNA and collagen, respectively, there is just a weaker band centered around 784 cm−1 in the spectrum of the cancerous sample. This remark suggests not only a dramatic reduction in collagen content in cancerous samples (the 858 cm−1 vibration being almost nonexistent in malignant cells), but, more importantly, an obvious modification of the DNA/RNA structural chain. Although cellular RNA shows bands in common with those of DNA, it has a specific fingerprint at 812 cm−1 (PO2 − stretching mode). 24 A very weak band can be seen in the spectrum of the tumorigenic sample at this location. This vibration is marked with a red arrow. A further supporting argument for DNA/RNA modification is the strong presence of the 1097 cm−1 peak in the same spectrum, a feature also attributed to the O–P–O stretching mode of DNA/RNA. Besides the evident decrease in the intensity of the 752 cm−1 line, another correlated difference is the intensity decrease of the 1587 cm−1 peak; both features correspond to DNA/RNA ring breathing modes. 24 All of these vibrational intensity changes emphatically demonstrate that DNA/RNA characteristics differ in cancerous cells.
Another central target in these investigations is the cell surface. In this context, it is worth pointing out another very weak vibration around 722 cm−1 that is observed in the spectrum of the tumorigenic sample. This vibration is attributed to the C—N bond of quaternary ammonium groups of phosphatidylcholines and sphingomyelins, which are major components of cell membranes. 44 Even though very weak, its presence implies that there are chemical changes occurring at cell membranes with changes from noncancerous to cancerous states. Similar observations of sphingomyelin overexpression in a more complicated environment of lumen cancerous breast ducts have also been reported in the literature. 23
The slight increase in the intensity of the 1240 cm−1 band, which originates from amide III content in proteins, is associated with a similar trend of the 1658 cm−1 line of the amide I protein component as well as with the 2940 cm−1 feature from the higher wave number region that was discussed above. Other vibrational lines at 940, 1010, 1320, and 1460 cm−1 do not show prominent modifications in their intensities. The assignment of all observed vibrational lines are provided in Table 1. They are also marked in Figure 1 with red arrows (showing greater intensity in the cancerous sample) and black arrows (showing greater intensity in the noncancerous sample). The broadband around 600 cm−1 is attributed to paraformaldehyde that was used in fixation of the cells on the microscopic glass slides.
Assignments of Vibrational Modes for the Raman Spectra Acquired From MCF-10A and MCF-7 Cells.

Thus, a general remark based on a first comparison between normal and cancerous samples is a dominant alteration of protein and DNA/RNA characteristics. As rapid cancer proliferation is known to be a hindrance to its treatment, and its accurate detection at an early stage could make a difference in the OS of patients with breast cancer, we also consider here a comparative investigation of untreated MCF-7 cells and MCF-7 experimental sample cells treated with EGF (well known to contribute to cell proliferation). In order to visually identify with higher specificity the location of the aforementioned cellular biochemical constituents (i.e., proteins, lipids, and DNA/RNA) in this set of samples, we present in Figure 2A to 2H their surface confocal Raman mappings. Since in confocal Raman microscopy, only a relative determination of concentrations is possible for multiconstituent biological samples, each concentration of which is proportional to the intensity of the constituent peak detected, pseudocoloring is used for visualization. A bright yellow pseudocolor corresponds to a higher intensity.

Confocal Raman mapping images of untreated and EGF-treated MCF-7 cells for vibrational signatures of: (A, B) DNA/RNA, (C, D) cumulative distribution of 1240 and 1658 cm−1 protein bands, (E, F) 2940 cm−1 protein-associated feature, and (G, H) lipid band-centered around 2870 cm−1. A bright yellow pseudocolor corresponds to a higher intensity. Also, the arrows in image (E) mark differences in content from image presented in (C), and comparison of (G) with (C) similarly indicate modifications associated with lipid content.
The accumulation of the 784 cm−1 signal in Figure 2A and 2B not only depicts the cell nucleic region, but, surprisingly, even potential cell division and proliferation in Figure 2A. Besides two distinct centromeres, a mitotic spindle which elongates the cell slightly by pushing the poles apart can be observed in Figure 2A, too. There was no evident variation in the locations of the 1240 and 1658 cm−1 protein signatures of the cells. Therefore, in Figure 2C and 2D, we present their cumulative distribution. At first glance, Figure 2E, where the 2940 cm−1 vibration associated with the most visible modification in protein content is imaged, resembles Figure 2C. However, a careful comparative inspection reveals a few differences between these two images, which are marked by arrows in Figure 2E. Furthermore, it appears that such differences also indicate the presence of the lipid droplets that are imaged in Figure 2G and 2H by filtering the band centered around 2870 cm−1.
Recent literature has emphasized the importance of cytoplasmic lipid droplets in cancer cells and tissue, beyond that of providing storage that can be accessed by cells without the need of extra energy investment in biosynthesis. 22,37 This type of lipid pool has been recently shown to contribute to cancer proliferation, 23 as well as potentially stimulating its mobility. 37 The cancer cells absorb this lipid-accumulating phenotype and begin metabolizing and transforming it (usually under hypoxic conditions) into cell membrane and other constituents needed for further proliferation. Not only is the comparison of Figure 2G and 2H in good agreement with this intense lipid activity and lipoprotein metabolism, as there is a slightly higher lipid content in the EGF-treated cell, but it further supports and explains the detection of the 722 cm−1 vibration and the obvious enhancement of the cancer-indicating 2940 cm−1 peak in the tumorigenic sample spectrum shown in Figure 1. Furthermore, the differences in the 2940 cm−1 signal source locations that are marked by arrows in Figure 2E are closer to the cell membrane than those of any other protein, again emphasizing the importance of lipid synthesis in cancer development and lipoprotein metabolism.
In order to better appraise the changes in vibrational structures of the lower wavenumber region associated with DNA/RNA constituents, we present in Figure 3A and 3B the comparative confocal Raman mappings of these cells from untreated and EGF-treated samples in a different approach. The acquisition of these images was performed in a controlled manner, using Cluster Analysis software. Since the amount of spatial and molecular information contained in these Raman images is large, it would be difficult to interpret the data without the use of multivariate processing methods. To allow association of spectroscopic data with specific microscale regions, we present in Figure 3C and 3D the graphs corresponding to each cluster, while maintaining the same color code for images and for spectra. The spectroscopic data are shown only in the regions of interest.
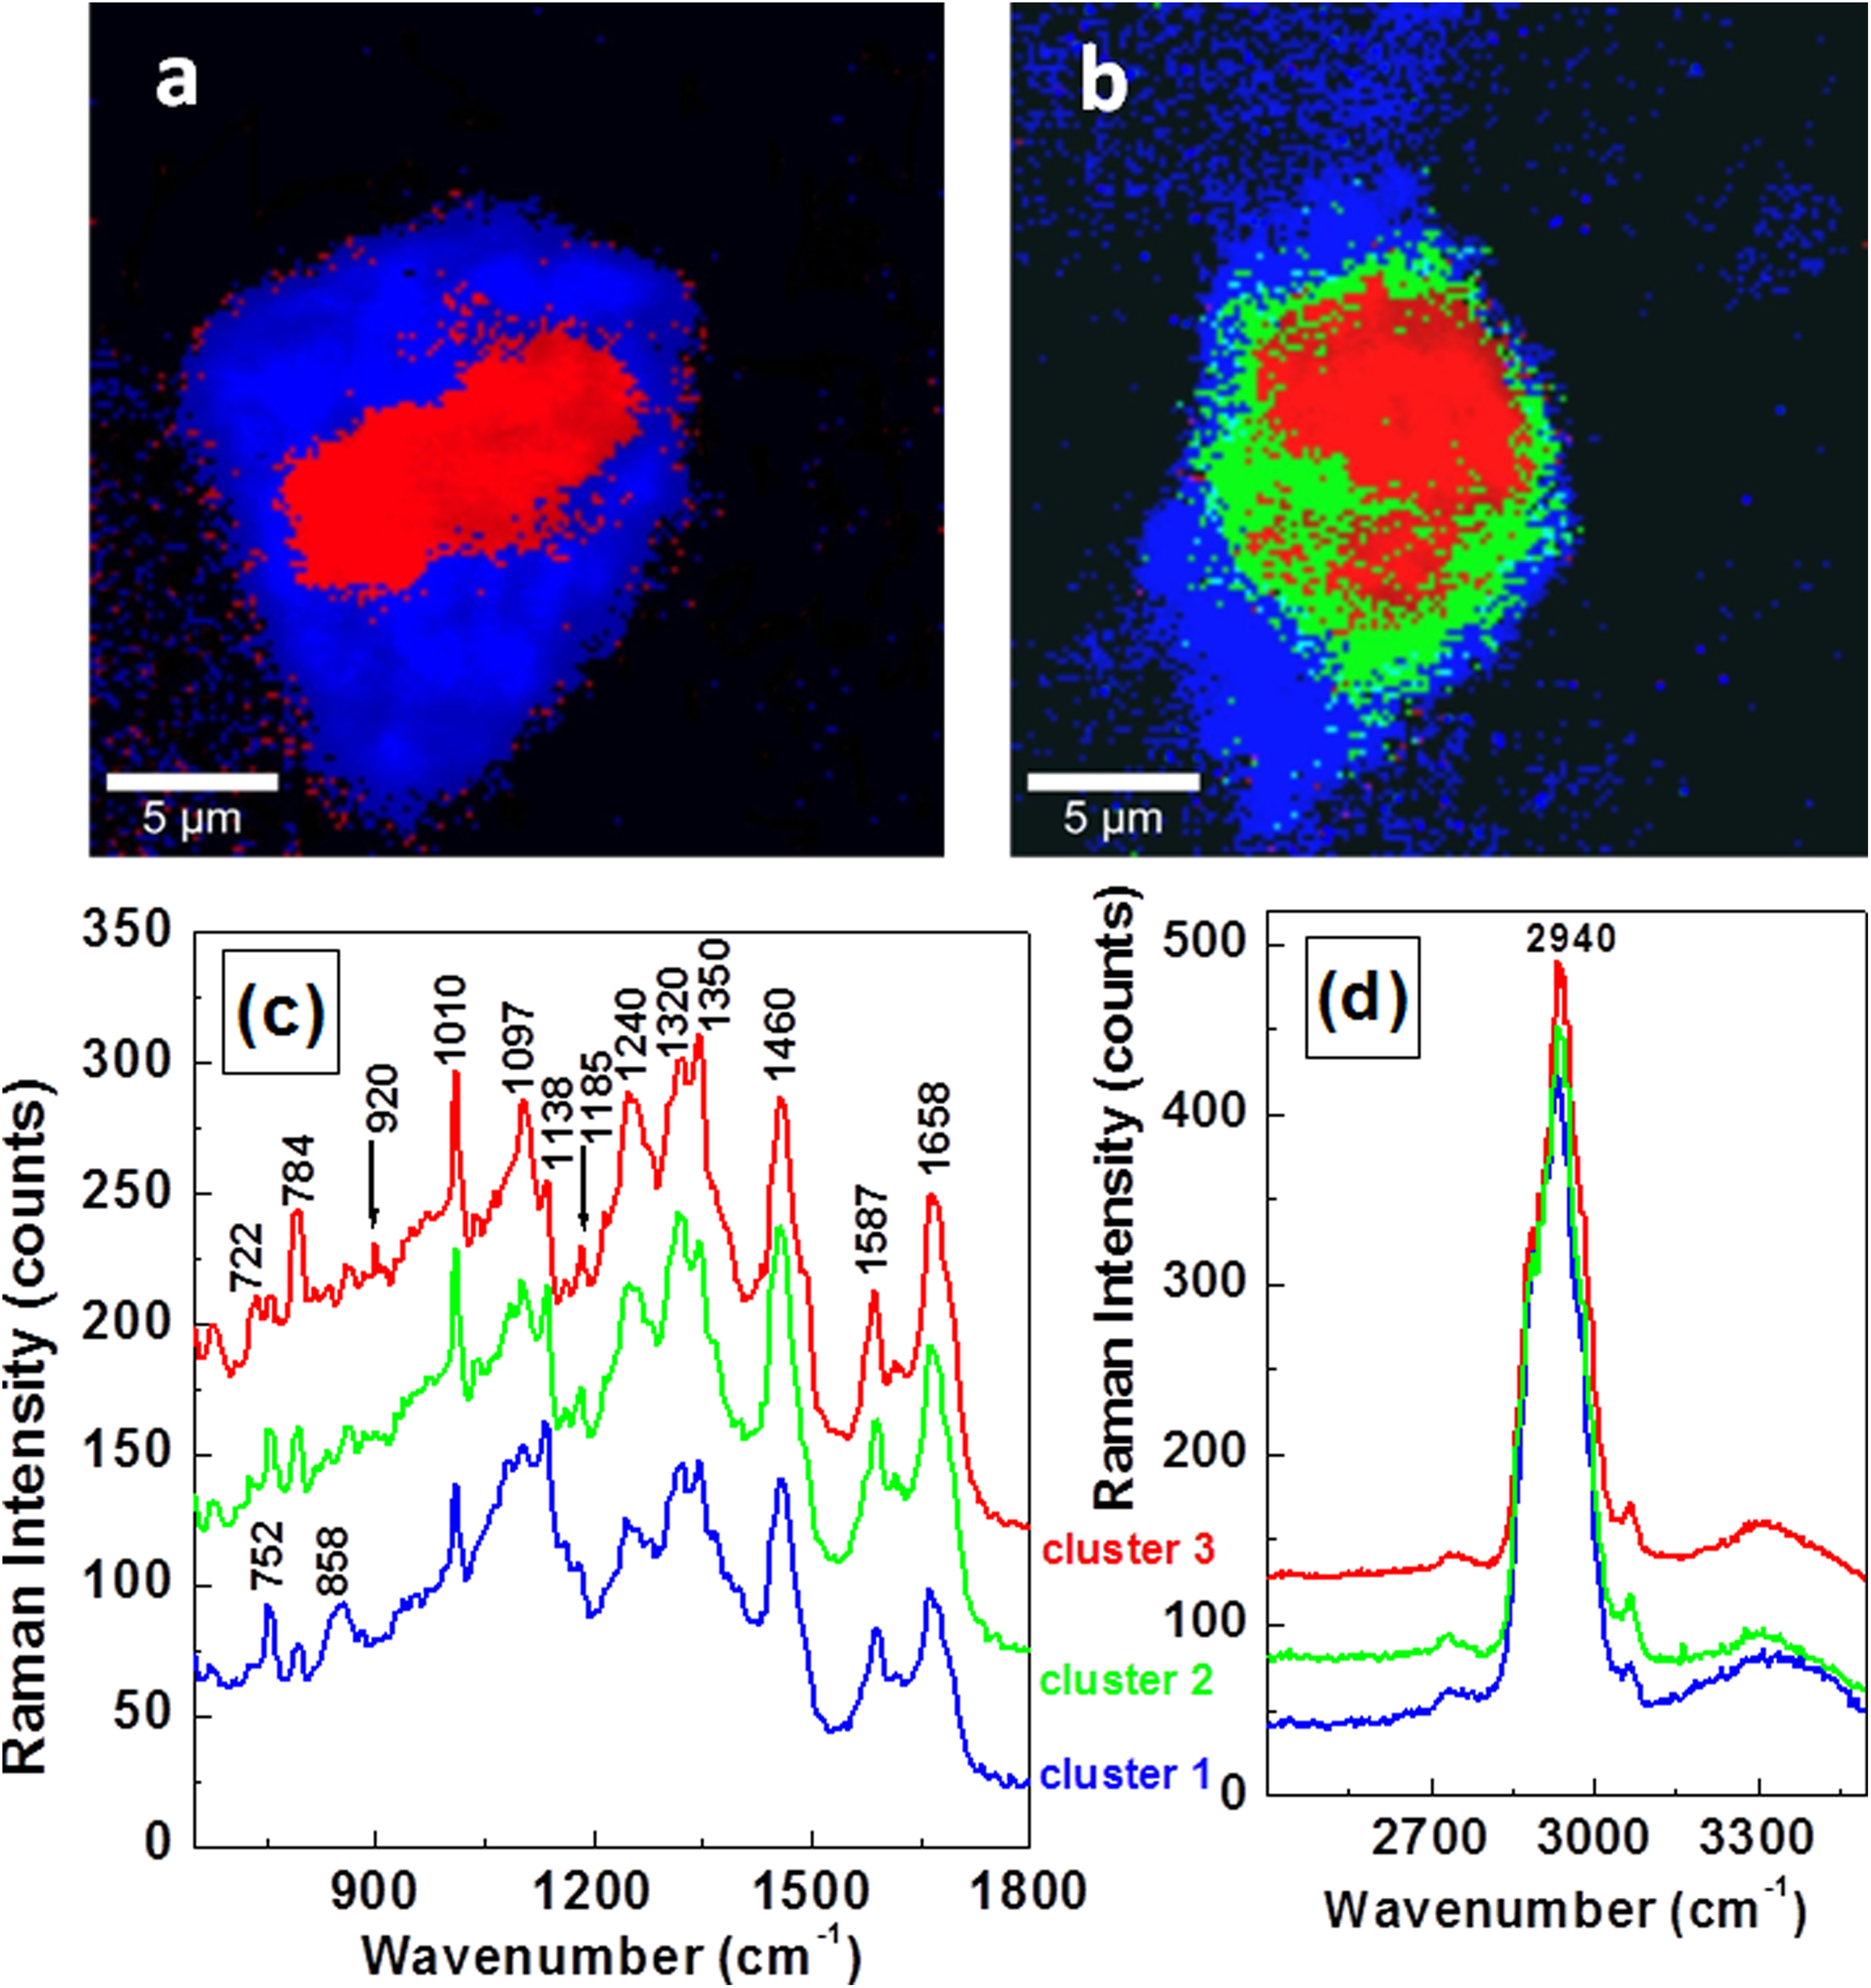
A and B, Confocal Raman mapping images performed with Cluster Analysis software of MCF-7 cells from untreated and EGF-treated samples, respectively. C and D, Raman spectra associated with each cluster and only in vibrational regions of interest. The same color code is maintained for images and for spectra.
Not only is the image in Figure 3A very similar to the one in Figure 2A (a direct demonstration of the accuracy of our analysis), but comparison of Figure 3A and B shows an obvious increase in the red region in the latter image, for an EGF-treated cell. For example, the red region accounts for about 20% of the image for the untreated MCF-7 cell, while the combined green and red regions comprise about 80% of the image for the EGF-treated MCF-7 cell. To understand the source of this visible modification, a look at the spectra presented in Figure 3C is essential. In the blue spectrum, the 752 cm−1 peak is the dominant feature. The intensity of this band starts decreasing in the green spectrum, and the 784 cm−1 vibrational line starts increasing its contribution. The intensities of these two peaks are reversed in the red spectrum, with a dominant 784 cm−1 peak. The red and green spectra also reveal the existence of two new vibrations around 920 and 1185 cm−1, which are assigned to phosphorylated threonine and serine, respectively. 46 For easier visualization of these two main proteinogenic amino acids, besides labeling, they are also marked with arrows in the spectra. Their concomitant presence suggests that a phosphorylation process could be the potential reason for faster proliferation of EGF-treated cells, as activation of both threonine and serine sites is necessary for this process to occur. 46,47 The validity of this assumption is further supported by the Western blotting analysis, which is presented in Figure 4 and discussed below. Again, a decrease in the collagen content (i.e., in the intensity of the 858 cm−1 line) is seen from the blue to the green and red regions, which is almost nonexistent in the last two areas. Changes in the intensities of the Raman lines at 1320 cm−1 (amide III, α-helix) and 1350 cm−1 (DNA, adenine) are also observed. 45 However, there is no trend in these latter changes, besides a slight increase in the intensity of the 1350 cm−1 peak in the red spectrum, once more suggesting a structural DNA modification. Other cellular vibrations corresponding to protein-specific bands at 1010 cm−1, 1240 cm−1 (amide III, collagen), 1460 cm−1 (ring mode of guanine), 1587 cm−1 (ring mode of adenine), and 1658 cm−1 do not show any visible intensity changes. No modifications are observed in Figure 3D for the lipids (2800-2900 cm−1 spectral region) or for the 2940 cm−1 protein Raman signature, either.

Western blotting analysis of EGF stimulation of MCF-7 cells. The cells were starved for 24 hours prior to EGF exposure for 30 minutes and at a concentration of 100 ng/mL and then harvested with 3 different lysis buffers using BD Falcon cell scrapers. The #1 lysis buffer refers to RIPA-like, #2 to NP-40, and #3 to MILLIPLEX MAP for multiplexing. The cells under the control treatment were only treated with RPMI basal media. Amido black staining of the membrane (bottom) indicates even transfer of proteins, and the membrane was probed for phosphorylated p44 MAPK and phosphor-Akt. β-Actin was used as an additional loading control.
To verify the biological activity of EGF in these human breast cancer cells, the EGF-treated cells were lysed and protein content was analyzed by Western blotting. As indicated in Figure 4, regardless of which lysis buffer was used, we observed that the addition of EGF (100 ng/mL) to the MCF-7 cells was associated with the appearance of phosphorylated forms of p44 MAPK (Erk 1/2; Thr202/Tyr204) and phosphorylated Akt (Ser473). These data confirm that the addition of EGF to MCF-7 cells leads to phosphorylation of signaling molecules known for being downstream of activated EGF receptors. They also corroborate with previously analyzed Raman results that hypothesized activity-regulating threonine and serine phosphorylation in cells stimulated with EGF.
Conclusions
We demonstrate in this work that Raman spectroscopy could ultimately be used to evaluate EGFR activity on tumor cells. This would potentially allow for Raman-guided diagnosis of breast tumors, which can have important implications for the prognosis and treatment of the disease. As a first step toward such an ambitious goal, we chose to compare Raman signatures of nontumorigenic and tumorigenic cells. These data show dominant alterations in protein content and DNA/RNA characteristics. As a second step, we chose to study cells expressing the erbB1 (or EGFR) protein and to compare the Raman profile of cells treated with or without its ligand—the EGF protein. These results demonstrate that under conditions of active or inactive EGFR (depending on the presence or absence of EGF), we could generate distinct Raman profiles. Significant findings from the use of EGF addition are not only related to modifications of the lipid pool and DNA/RNA but also to appearances of new vibrations associated with phosphorylated threonine and serine. These latter findings, which are in good agreement with the outcomes of gel electrophoresis analysis, confirm that the addition of EGF to MCF-7 cells leads to phosphorylation of signaling molecules known to be downstream of activated EGF receptors.
In conclusion, while at the beginning of the process the de novo lipogenesis associated with lipids in the membrane structure plays an important role in the survival of the cancer cells, and cellular signaling and protein regulation that are linked to cell proliferation and migration, the morphological changes of DNA/RNA depicted in this work correlates not only with the increased aggressiveness of cancer, but also with the difficulty of potentially accurate and efficient treatment. The current results are therefore an important step toward Raman-based evaluation of receptors on the surface of breast cancer cells or of the biological activity of such receptors.
Footnotes
Abbreviations
Author Contributions
FSM and GF conceived the study, participated in its design and coordination, and drafted the manuscript. JDC and EMS carried out Raman measurements. KP, PV, and LR contributed to sample preparation and carried out biological studies. MM, KEB, and WGD contributed to data analysis and helped to draft the manuscript. All authors contributed significant effort to manuscript preparation. The final manuscript was read and approved by all authors.
Declaration of Conflicting Interests
The author(s) declared no potential conflicts of interest with respect to the research, authorship, and/or publication of this article.
Funding
The author(s) disclosed receipt of the following financial support for the research, authorship, and/or publication of this article: This work was supported by a research agreement between the University of Texas at El Paso and the Mayo Clinic and by NIMHHD/NIH grant 2G12MD007592.