
Abstract
In this study, we investigate the effect of short hairpin RNA-mediated gene silencing of Bmi-1 expression on chemosensitivity of CD44+ nasopharyngeal carcinoma cancer stem-like cells. The sequence-specific short hairpin RNA lentivirus targeting at human Bmi-1 was synthesized and used to infect CD44+ nasopharyngeal cells that were sorted by flow cytometry. We also employed flow cytometry to detect transfection efficiency. Real-time polymerase chain reaction was used to detect Bmi-1 and its downstream repressor genes p16INK4a and p14ARF messenger RNA, while each protein expression level of Bmi-1, p16INK4a, p14ARF, and p53 was confirmed by Western blotting protocol. Tumor spheroid assay was used to evaluate the self-renewal capacity. 3-(4,5-dimethylthiazol-2-yl)-2, 5-diphenyltetrazolium bromide assay and colony formation assay were applied to detect proliferation capacity and colony-forming capacity under different concentrations of chemotherapeutic drugs 5-fluorouracil or cisplatin. Transwell cell migration and invasion assay were employed to observe migration and invasion capacity after cells were exposed to cisplatin for 24 hours. The constructed short hairpin RNA lentivirus targeting Bmi-1 gene successfully infected into the CD44+ nasopharyngeal carcinoma cells and effectively inhibited the Bmi-1 messenger RNA and protein expression level, while the expression level of Bim-1 target genes, p16INK4a, p14ARF, and p53 was significantly increased (P < .05). Notably, the proliferation, colony formation, migration, and invasion capabilities of the sequence-specific short hairpin RNA lentivirus-infected CD44+ nasopharyngeal carcinoma cells reduced significantly under chemotherapeutic treatments (P < .05). Our results indicated that Bmi-1 may play an important role in the chemosensitivity of CD44+ nasopharyngeal carcinoma cancer stem-like cells. Bmi-1 may be a potential new target for the treatment of nasopharyngeal carcinoma displaying chemotherapy resistance.
Introduction
Nasopharyngeal carcinoma (NPC) is a kind of disease with strong involvement of genetic susceptibility. It has a remarkably distinctive ethnic and geographic distribution and most of the cases are reported from China, Southeast Asia, and North Africa. Currently, the main treatment to NPC is radiotherapy, while more advanced tumors might require the addition of chemotherapy. With the mentioned management, the 5-year survival rate of patients with early stage NPC has been significantly improved; however, the overall survival rate of patients with advanced stage NPC has not been markedly improved, let alone in the effort of treating tumor resistance to chemotherapy. 1
In recent years, cancer stem cells (CSCs) are believed to play an important role in the maintenance of stem characteristics of tumors such as self-renewal and drug resistance. 2,3 CD44, a member of the homing cell adhesion molecule family, is known to be overexpressed in ovary, lungs, and other various tumors, 4 –6 and it is reported as a specific surface marker for various CSCs. Several studies have shown that CD44 was overexpressed in NPC. More importantly, it seems to play a crucial role in the chemoresistance of NPC and poor prognosis. 7 –9 It has also been found that Bmi-1 was upregulated in a variety of malignancies, such as leukemia, cervical cancer, and head and neck squamous cell carcinoma (HNSCC) tissues, 10 –12 and it was closely related to chemoresistance of CSCs. In our previous study, we confirmed that CD44+ NPC cells were more resistant to chemotherapy and radiotherapy, showing stem characteristics, and Bmi-1 gene expression was significantly higher in CD44+ NPC cells than that of CD44− NPC cells. 7 Therefore, targeting Bmi-1 gene in CD44+ NPC cells may have an important implication for the prevention and treatment of NPC. In this study, we synthesized sequence-specific interference short hairpin RNA (shRNA) lentivirus targeting Bmi-1 gene (LV-Bmi-1shRNA) as well as evaluated the effect of shRNA-mediated gene silencing of Bmi-1 expression on chemosensitivity of CD44+ NPC cancer stem-like cells (CSC-LCs).
Materials and Methods
Cell Culture
The human NPC cell line SUNE-1 5-8F cells with the characteristics of growing and adhering to the wall, purchased from the cell bank of Sun Yat-sen in China, were cultured in Rosewell Park Menmorial Institute 1640 (RPMI1640) culture medium (Gibco USA ) with 10% fetal bovine serum (FBS; Gibco), 100 units/mL penicillin, and 100 μg/mL streptomycin. After sorting, part of the CD44+ cells were cultured in RPMI1640 culture medium supplemented with 10 ng/mL basic fibroblast growth factor (bFGF), 20 ng/mL epidermal growth factor (EGF), 5 μg/mL insulin (Sigma, USA), 100 units/mL penicillin, and 100 μg/mL streptomycin. All cells were placed in a 5% CO2, 37°C humidified incubator, and trypsinized every 1 to 2 days.
Flow Cytometry to Detect CD44 Expression and Sort CD44+ Cells
The 5-8F cells in logarithmic phase were trypsinized and washed twice with phosphate-buffered saline (PBS). Ice-cold RPMI1640 containing 2% FBS was used to resuspend cells at a concentration of approximately 1 × 10⁶ cells/mL, and anti-human CD44-fluorescein isothiocyanate antibody (eBioscience, San Diego, CA) was added at a final concentration of 5 μg/mL. Isotype-matched mouse antibodies were served as controls. After incubating for 30 minutes at 4°C in the dark, cells were centrifuged and washed with PBS for additional 3 times, then resuspended in 100 μL buffer. After adding 4 μL of 7-Aminoactinomycin D (KeyGEN BioTECH, China), cells were incubated at room temperature for 10 minutes and meshed through a 300-mesh sieve to remove dead cells. After concentration, cells were resuspended in 500 μL PBS containing 2% FBS. Flow cytometry (FCM; BD Biosciences, San Jose, CA, USA) was used to detect the expression of CD44 in 5-8F cells and select CD44+ cells. Finally, the purity of collected CD44+ cells in pure serum was tested.
The Preparation of RNA Interference Lentiviral Vector
Three shRNA interference (RNAi) sequences targeting Bmi-1 messenger RNA (mRNA) were designed and synthesized according to the Bmi-1 mRNA sequence in GenBank (GenBan-k accession no. NM_005180). LV-Bmi1-RNAi-1: 5′-TCCTAATACTTTCCAGATTGATCTCGAGATCAATCTGGAAAGTATTAGGTTTTTTC-3′; LV-Bmi1-RNAi-2: 5′-TCGGAAAGTAAACAAAGACAAACTCGAGTTTGTCTTTGTTTACTTTCCGTTTTTTC-3′; LV-Bmi1-RNAi-3: 5′-TCCAGAACAGATTGGATCGGAACTCGAGTTCCGATCCAATCTGTTCTGGTTTTTTC-3′. A lentivirus which included a random sequence was also designed to serve as a negative control, and the sequence was as follows: 5′-TTTCTCCGAACGTGTCACGTTTCAAGAGAACGTGACACGTTCGGAGAATTTTTTC-3′. Lentivira-l vector system was carried out by the Genechem of Shanghai in China.
Infection of Target Cells by Lentivirus
Single cell suspensions (cells that were trypsinized) of CD44+ 5-8F cells that were in logarithmic phase were prepared and seeded in 6-well plates at about 5 × 10⁴ cells/well, maintained in 5% CO2 incubator at 37°C until the cells reached approximately 30% confluence. Then virus were added in the cases of low multiplicity of infection (MOI) and high MOI according to the virus titer of the sequence. Medium was changed after culturing for 16 hours. The expression of Green Fluorescent Protein(GFP) reporter gene in lentivirus-infected cells was observed under a fluorescence microscope and detected by FCM at 72 hours postinfection.
RNA Extraction
Seventy-two hours after infection, total RNA in LV-Bmi-1shRNA infected group (KD), negative vector group (NC), and control group (CON) cells were extracted in accordance with the TRIzol (Invitrogen, Carlsbad, CA) instructions. Ultraviolet spectrophotometer was employed to measure RNA concentration and purity (OD260/OD280: 1.8-2.0). Complementary DNA (cDNA) was synthesized according to Promega M-MLV operating instructions. Synthetic cDNA were stored at −80°C.
Real-Time Polymerase Chain Reaction
Fluorescence real-time quantitative polymerase chain reaction (PCR) was accomplished based on SYBRpremix Ex TaqTM II kit (TaKaRa, Japan) and 2-step method according to the manufacturer’s protocol (Takara, Japan). The reaction conditions were as follows: a predenaturation step of 30 seconds at 95°C followed by 45 cycles at 95°C for 5 seconds and 60°C for 30 seconds. And the melting curve was performed at following conditions: 95°C for 15 seconds, 55°C for 30 seconds, and 95°C for 15 seconds. Each sample was repeated at least 3 times. Finally, the relative amount of target gene was calculated in accordance with the 2−ΔΔCt method, ΔCt = Ct (gene of interest) – Ct (reference gene), ΔΔCt = ΔCt (sample) – ΔCt (control group). Primer sequence information is presented in Table 1.
Sequences of PCR Primer.

Abbreviations: PCR, polymerase chain reaction; GAPDH, glyceraldehyde 3-phosphate dehydrogenase.
Western Blot Assay
Seven days after infection, from each group, cells were harvested and proteins were extracted. The respective concentration of the extracted proteins was then measured and determined using the Bradford protein assay (Hercules, CA, USA). Protein extract of 40 μg from each sample was loaded and separated by 10% sodium dodecylsulfate-polyacrylamide gel electrophoresis, then electrotransfered onto a polyvinylidene fluoride membrane (Millipore). After blocking with solution configured by 5% fat-free milk at 37°C for 1 hour, the membrane was incubated with the following antibodies: rabbit anti-human monoclonal Bmi-l/p16INK4a antibody (CST, USA), rabbit anti-human monoclonal p14ARF antibody (Eptomics, USA), and rabbit anti-human monoclonal p53 antibody (PTG, USA). The protein–antibody complexes were then detected after incubating with horseradish peroxidase-conjugated secondary antibodies at 4°C overnight and were then determined by the SuperECL Plus chemiluminescence system (Beyotime, China). The relative amount of protein was measured by integrated optical density reference value using Quantity One v4.62 optical density gel analysis software (Bio-Rad). β-Actin was used as a control.
Tumor Spheroid Assay
For spheroid forming assay, 1 × 10⁵ cells (KD, NC, or CON) were inoculated in 25 cm2 ultra-low attachment bottle (Corning, USA) with serum-free DMEM/F12, Dulbecco’s Modified Eagle Medium: Nutrient Mixture F-12 (1:1) medium (Gibco), which contained 10 ng/mL bFGF, 20 ng/mL EGF, 5 μg/mL insulin, B27 (Gibco), 100 units/mL penicillin, and 100 μg/mL streptomycin. The number of spheroids (≥40 μm in diameter) were counted after 7 days of culture under an inverted microscope (400×). Each experiment was repeated in triplicates.
Cell Viability Detected by 3-(4,5-Dimethylthiazol-2-yl)-2, 5-diphenyltetrazolium bromide Assay
Cells were seeded at a final density of 2 × 10³ cells for each well in 96-well plate. The following day, adherent cells were exposed to various concentrations of cisplatin (0.5, 1, 2, 4, 8, and 16 μg/mL; Sigma) or 5-fluorouracil (5-FU; 0.75, 1.5, 3, 6, 12, and 24 μg/mL; Qilu Pharmaceutical, China) in a final volume of 100 μL. The wells were not added drugs, and the blank retainer group also served as control. At the time of 24, 48, and 72 hours, the cells incubated with 20 μL 3-(4,5-dimethylthiazol-2-yl)-2, 5-diphenyltetrazolium bromide (MTT; 5 mg/mL; Sigma) for another 4 hours at 37°C, then 150 μL dimethyl sulfoxide (Amresco, USA) was added to each well, and the absorbance at 490 nm (reference wavelength at 630 nm) was determined using a microplate reader (Bio -tek, USA) after shaking on a horizontal shaker for 10 minutes. The cell viability (%) was calculated using the following formula: (experimental group A490 value − blank group A490 value)/(control group A490 value − blank group A490 value) × 100%. The experiment was performed independently 3 times.
Colony Formation Assay
Cells (KD, NC, or CON) were added to 6-well plates at 200 cells/well. The following day, the cells were treated with 0 and 0.5 μg/mL of cisplatin or 0.75 μg/mL of 5-FU for 24 hours. After being replaced with fresh medium, the cells were cultured at 37°C for additional 12 days in an incubator with 5% CO2. Then the cells were washed with PBS, fixed with methanol, and finally stained with 0.1% Crystal violet. The number of colonies containing 50 or more cells was counted under an inverted microscope. The cloning efficiency was calculated as number of colonies/number of cells inoculated ×100%, then surviving clone fraction (%) was calculated as (plating efficiency(PE) with dosing/PE without dosing) × 100%. Each assay was performed in triplicate.
Transwell Cell Migration Assay
The 4.5 × 10⁴ cells (KD, NC, or CON) that were exposed to 0.5 μg/mL cisplatin for 24 hours in 200 μL serum-free RPMI1640 medium were seeded on the basement membranes containing 8-µm pore size of Transwell chambers (Corning). In the lower chamber, 700 μL RPMI1640 with 10% FBS was added as chemoattractant. After the cells were incubated for 24 hours in a 5% CO2 humidified incubator at 37°C, membrane basements were washed with PBS, and the nonmigrated cells on the surface top of the thin basement membranes were scraped off with cotton swabs. The migrated cells adhering to the lower surface were fixed with methanol, stained with 0.1% Crystal violet solution, and counted under a microscope (100×) in 5 random and visual fields per well.
Transwell Cell Invasion Assay
The procedure was very similar to the one described previously for transwell cell migration assay, except for 2 aspects: basement membranes were precoated with 40 μL extracellular matrix (ECM) gel (1 mg/mL; Sigma), and the cells were resuspended at a density of 2.75 × 10⁵ cells/mL. Both migration and invasion assays were performed in triplicate.
Statistical Analysis
Statistical analysis was performed by GraphPad Prism5 software. When comparisons were made among groups, univariate repeated measures analysis of variance was used, while comparisons of 2-sample data were made using independent samples t test. Data were presented as the mean ± standard deviation, with P < .05 being considered statistically significant.
Results
Expression of CD44 in 5-8F Cell Lines and Sorting by FCM
The CD44+ cells accounted for 45.3% to 53.0% of total 5-8F cell line. The sorting purity of freshly selected CD44+ and CD44− cells by FCM was approximately 98.8% (Figure 1).

Cell sorting and sorting purity by FCM. A, Negative control of SUNE-1 5-8F cells did not contain antihuman CD44-FITC antibody. B, Sorting of SUNE-1 5-8F cells by antihuman CD44-FITC antibody. CD44+ cells accounted for 45.3% to 53.0% of total cells. C, The sorting purity of the freshly sorted CD44+ cells was 98.8%. FCM indicates flow cytometry; FITC, fluorescein isothiocyanate.
Infection Efficiency of CD44+ 5-8F With Lentiviral Vectors
The CD44+ NPC CSC-LCs were infected with the constructed LV-Bmi-1shRNA and negative lentiviral vector and observed under a fluorescence microscope (100×) 72 hours postinfection. The GFP of the infected cells was strongly expressed (Figure 2A), indicating a successful construction of lentiviral vector. Through FCM detection, more than 95% of cells were found to express GFP (Figure 2B), indicating that a stable cell line was established successfully.

Detection of infection efficiency. A, Infection efficiency of CD44+ 5-8F cells observed under a fluorescence microscope (100×), showing a strong fluorescence intensity, and the infection efficiency could reach above 90%. B, Infection efficiency detected by FCM. The infection efficiency of CON was 0, while for the NC cells and KD cells, the infection efficiency was 96.79% and 97.14%, respectively. FCM indicates flow cytometry; KD, LV-Bmi-1shRNA infected group; NC, negative vector group; CON, control group; LV-Bmi-1shRNA, short hairpin RNA lentivirus targeting Bmi-1 gene.
Efficiency of LV-Bmi-1shRNA-Mediated Gene Silencing
Real-time PCR and Western blot were used to detect the efficiency of gene silencing. Real-time PCR analysis illustrated that Bmi-1 gene in KD cells was silenced by more than 90% in comparison with NC cells, and the 3 targeted sequences were all valid targets (P < .05, Figure 3A and B). Finally, LV-Bmi1-RNAi-3 and negative lentiviral vector were selected to infect the targeted cells.

Efficiency of LV-Bmi-1shRNA-mediated gene silencing detected by real-time PCR assay. A and B, Bmi-1 mRNA expression when CD44+ 5-8F cells were infected with LV-Bmi-1shRNA and negative lentiviral vector in the cases of low and high MOI, respectively. Compared with NC cells, Bmi-1 mRNA expression in KD cells was silenced by more than 90% (P < .05; ***P < .001, **P < .01). LV-Bmi-1shRNA indicates short hairpin RNA lentivirus targeting Bmi-1 gene; mRNA, messenger RNA; PCR, polymerase chain reaction; MOI, multiplicity of infection; KD, LV-Bmi-1shRNA infected group; NC, negative vector group.
In regard to the protein expression level, Western blot analysis also showed that, compared with NC and CON groups, the relative expression of Bmi-1 in KD group decreased markedly. Simultaneously, the mRNA expression level of downstream gene p16INK4a and p14ARF (P < .05, Figure 4A) as well as the protein expression level of p16INK4a, p14ARF, and p53 (P < .05, Figure 4B) were significantly upregulated; however, no significant difference were observed between NC and CON groups.

Effect of Bmi-1 gene silencing on the expression of the downstream genes p16INK4a and p14ARF mRNA and protein levels of Bmi-1, p16INK4, P14ARF and p53. A, Bmi-1 downstream genes p16INK4a and p14ARF mRNA expression in KD cells were upregulated after Bmi-1 gene silencing, compared with NC cells and CON cells. B, Effect of silencing of Bmi-1 gene on protein levels by Western blot analysis. The relative protein expression of Bmi-1 was downregulated evidently in KD cells, while p16INK4a, p14ARF, and p53 protein levels were upregulated. β-Actin was used as a control, and the difference was statistically significant (P < .05). KD indicates LV-Bmi-1shRNA infected group; NC, negative vector group; CON, control group; mRNA, messenger RNA.
Silencing of Bmi-1 Gene Weakened the Self-Renewal Capacity of CD44+ NPC CSC-LCs
When 3 groups of cell were cultured in serum-free medium that contained growth factor, they did not multiply on the first day; however, both NC and CON cells gradually began to conglobate and their volumes increased by degrees. The samples evolved to have an outline of grapes-like appearance on the seventh day. However, the spheres formed in the KD group were inconspicuous (Figure S1), the volume of spheroids in the KD group was evidently smaller than in the other 2 groups of cells, and the sphere formation rate was also significantly lower than that of NC and CON groups (Table 2).
Sphere Formation Rate (%) of 3 Groups of Cells in Serum-Free Medium.

Abbreviations: KD, LV-Bmi-1shRNA infected group; NC, negative vector group; CON, control group.
a P < .001, compared with the KD group.
b P < .01, compared with KD group.
Gene Silencing of Bmi-1 Reduced Cell Viability of CD44+ NPC CSC-LCs Under Chemotherapeutic Treatment
The absorbance value at 490 nm of 3 groups of cells treated with various concentrations of cisplatin or 5-FU for 24, 48, and 72 hours were measured by MTT assay. The cell survival under cisplatin or 5-FU with various concentrations at each time point (Figure 5) and the cell viability under cisplatin (0, 0.5, and 1 μg/mL) or 5-FU (0, 0.75, and 1.5 μg/mL) with the same concentrations at different time point were calculated (Figure 6). The results displayed that when all cells were exposed to the different concentrations of cisplatin or 5-FU for identical time or exposed to the same concentration of cisplatin or 5-FU for diverse time, KD cells showed a lower cell viability compared with NC and CON cells (P < .05) while no conspicuous difference between NC cells and CON cells (P > .05).

The cell survival under cisplatin or 5-FU treatment at different concentrations for different time was determined by MTT assay. The curve showed that the cell survival of KD cells displayed a lower cell viability when all cells were exposed to the same concentration of cisplatin (A-C) or 5-FU (D-F) for identical time, compared with NC cells and CON cells (P < .05), while no conspicuous differences was observed between NC and CON cells (P > .05). 5-FU indicates 5-fluorouracil; MTT, 3-(4,5-dimethylthiazol-2-yl)-2, 5-diphenyltetrazolium bromide; KD, LV-Bmi-1shRNA infected group; NC, negative vector group; CON, control group.

The cell viability under cisplatin (0, 0.5, and 1 μg/mL) or 5-FU (0, 0.75, and 1.5 μg/mL) with the same concentrations at different time (24, 48, and 72 hours) point were calculated by MTT assay. The curve showed that when all cells were exposed to the same concentration of cisplatin (A and B) or 5-FU (C and D) for diverse time, the cell survival of KD cells displayed a lower cell viability, compared with NC cells and CON cells (P < .05), while no conspicuous differences were observed between NC and CON cells (P > .05). 5-FU indicates 5-fluorouracil; MTT, 3-(4,5-dimethylthiazol-2-yl)-2, 5-diphenyltetrazolium bromide; KD, LV-Bmi-1shRNA infected group; NC, negative vector group; CON, control group.
Gene Silencing of Bmi-1 Induced Reduced Colony Formation Under Cisplatin or 5-FU of CD44+ NPC CSC-LCs
Colonies were formed in 3 groups of cells treated with or without 5-FU or cisplatin after incubation for 12 days. The number of cells that are able to form colonies in the KD group was visibly less than that of NC and CON groups with or without adding drugs, with significant difference (P < .05). No obvious difference was found between NC and CON groups, neither in the case of dosing nor in the case of no dosing (P > .05, Figure 7). The results demonstrated that clonogenic capability of CD44+ NPC CSC-LCs under cisplatin or 5-FU reduced significantly after Bmi-1 gene expression being suppressed (Table 3).
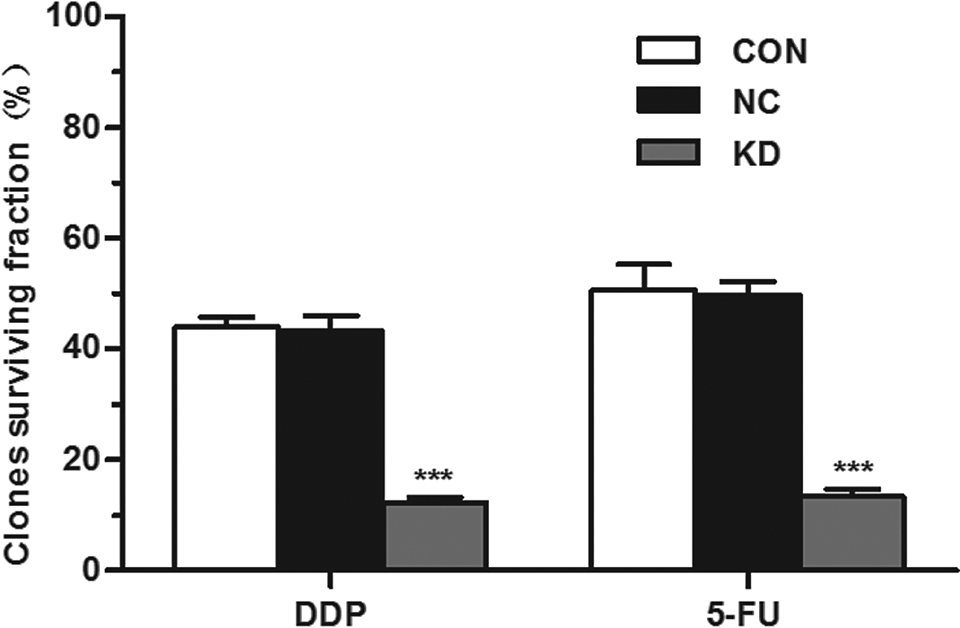
Effect of gene silencing of Bmi-1 on cloning efficiency of CD44+ NPC CSC-LCs. It is conspicuous that the cloning number and diameter in KD group whether or not adding drugs were distinctly lower and smaller than that of CON and NC cells (P < .05). While no obvious difference between NC and CON groups was observed, neither in the case of dosing nor no dosing (P > .05). ***P < 0.001, compared with CON and NC group. NPC indicates nasopharyngeal carcinoma; CSC-LCs, cancer stem-like cells; KD, LV-Bmi-1shRNA infected group; NC, negative vector group; CON, control group.
Comparison of Cloning Survival Fraction (

Abbreviations: KD, LV-Bmi-1shRNA infected group; NC, negative vector group; CON, control group; 5-FU, 5-fluorouracil.
a P < .001, compared with CON group and NC group.
Gene Silencing of Bmi-1 Reduced Migration and Invasion Capabilities of CD44+ NPC CSC-LCs
After 24 hours, the migrated cells that adhered to the lower surface of Transwell chambers were counted under a microscope in 5 randomly chosen visual fields per well within the same area. The results showed that compared with the NC and CON groups, the cells that passed through the basement membrane in the KD group were significantly reduced, with apparent differences (P < .05). No significant difference was found between the NC and CON groups (P > .05) (Table 4 and Figure 8A). It confirmed that the migration capacity of CD44+ NPC CSC-LCs after exposure to cisplatin for 24 hours was weakened after Bmi-1 gene expression was inhibited.

Cell migration and invasion were detected by Transwell cell migration and invasion assay observed under an inverted microscope (100×). A, Cells migration assay. B, Cells invasion assay. Compared with NC and CON groups, the cells passed through the basement membrane in the KD group decreased markedly, while no significant difference was observed between NC and CON groups (P > .05). KD indicates LV-Bmi-1shRNA infected group; NC, negative vector group; CON, control group.
Comparison of Cell Number by Transwell Cell Migration and Invasion Assays.

Abbreviations: KD, LV-Bmi-1shRNA infected group; NC, negative vector group; CON, control group.
a P < .001, compared with CON and NC group.
We also found that the cells which passed through the basement membrane in the case of coating ECM gel in the KD group decreased significantly, when compared with CON and NC groups (P < .05, Table 4 and Figure 8B). It demonstrated that suppression of Bmi-1 expression markedly weakened the invasive ability of CD44+ NPC CSC-LCs in vitro after being cocultured with cisplatin for 24 hours. It further confirmed that suppression of Bmi-1 expression significantly increased sensitivity of CD44+ NPC CSC-LCs to chemotherapeutic drugs.
Discussion and Conclusion
Chemotherapy represents a fundamental treatment of head and neck cancers (HNCs). Although chemotherapeutic drugs currently used showed certain efficacy, the effect is often short-lived, and this is mainly due to drug resistance. More and more studies found that CSCs displayed a strong resistance to chemotherapy because of their active potential for self-renewal and proliferation. The abnormal expression of certain genes in CSCs is associated with their self-renewal and chemoresistance. 13 –15 Therefore, the analysis of regulatory mechanisms of self-renewal of CSCs and resistance to chemotherapy would be an ideal tool to improve treatment of tumors.
The identification and purification of CSCs are mainly performed based on their surface markers. Al-Hajj et al 16 reported the identification of breast CSCs within the epithelial-specific antigen (ESA)+/CD44+/CD24low-neg- population of mammary pleural effusion and tumor samples from breast solid cancer for the first time in 2003. Subsequently, the CSCs were identified in a variety of solid tumors such as gastric, lung, ovarian cancer, and HNCs. 2,17,18
Currently, CD44+ cells displaying stem properties were reported to be present in NPC. Lun et al 8 reported that within NPC, the CD44+ cells displayed a higher sphere formation rate than CD44− cells, and they were more resistant to chemotherapy, showing characteristics of CSCs. Janisiewicz et al 9 also showed that in patients with Epstein-Barrvirus (EB) virus-related NPC, the presence of CD44+ cells was found to be associated with local treatment failure/decreased time to relapse. In our previous study, CD44+ NPC cells were more proliferative and resistant to chemotherapy and radiotherapy than CD44− cells. 7 Therefore, NPC contains a CD44+ subpopulation, which plays a pivotal role in the chemoresistance and is responsible for prognosis of patients with NPC. Therefore, targeting CD44+ NPC cells may provide new tools for clinical prevention and treatment of NPC.
Bmi-1 gene is a member of Polycomb Group(PcG) family and acts as a transcription repressor, participating in the regulation of a series of biological processes, including cell proliferation and tumorigenesis. It is considered to be a stem-related gene.
Earlier reports have indicated that Bmi-1 gene was essential for maintaining the efficient self-renewal capacity of adult hematopoietic stem cell. 19 In a recent study, Manoranjan et al 20 reported that Bmi-1 is involved in regulating self-renewal of stem cell and tumor initiation of medulloblastoma. Lukacs et al 21 showed that Bmi-1 is crucial for the self-renewal and malignant transformation of prostate stem cell, while Bmi-1 deletion could block the proliferation of prostate CSCs, and the modification of Bmi-1 gene may reduce prostate cancer susceptibility. Proctor et al 22 also found that Bmi-1 overexpressed in primary human pancreatic cancer xenografts and pancreatic tumor spheres, whereas knockdown of Bmi-1 reduced secondary and tertiary tumor spheres formation, inhibited growth of primary pancreatic xenograft, and lowered the percentage of CSCs in tumor tissues. Together, these findings reveal that Bmi-1 gene plays an important role in the regulation of a variety of CSCs.
In HNCs, a large number of evidences revealed that Bmi-1 gene was overexpressed in HNSCCs. 23 –25 It has been reported that Bmi-1, Snail, and Aldehyde Dehydrogenase(ALDH 1) coexpressed in HNSCCs biopsy, and Bmi-1 overexpression could induce soft agar colony formation, migration, invasion, and increased radiation resistance. They also discovered that Bmi-1 overexpression was closely related with grading and overall survival of patients with HNSCCs. 26 Interestingly, the HNSCC cells selected by cisplatin were found to exhibited CSC properties including enhanced proliferation, spheres formation, colony formation, and invasion abilities, compared with drug-sensitive parental cells. 27 Bmi-1 gene has thus become a potential biomarker for tumor diagnosis and prognosis and a new target for cancer therapy.
Small-interfering RNA (siRNA)- or shRNA-mediated gene silencing was found to be a powerful tool to investigate the role of cancer-related genes. It has been reported by Wu et al 28 that Bmi-1 depletion by Bmi-1siRNA enhanced the chemosensitivity of liver cancer cells by inducing 5-FU-induced apoptosis and autophagy. Wang et al 29 also showed that silencing Bmi-1 by siRNA sensitized chemoresistant ovarian cancer cells to chemotherapeutic drugs such as cisplatin. In an ectopic xenograft model of chemoresistant ovarian cancer in vivo, silencing of Bmi-1 significantly inhibited tumor growth. Cisplatin monotherapy was invalid, while combination of Bmi-1 knockdown and cisplatin treatment nearly completely prevented ovarian tumor from growing. In the latest research, Siddique et al 30 confirmed that Bmi-1 gene played a crucial role in determining the destiny of tumors. They found that Bmi1-rich tumor cells were unresponsive to chemotherapy, while targeting Bmi-1 improved the chemoresistance of docetaxel in xenograft models harboring chemoresistant tumor cells. Importantly, induced expression of Bmi-1-derived normal cells to be hyperproliferative. Yin et al 31 also reported that Bmi-1 was associated with 5-FU resistance and was overexpressed in CD44+/CD24−-enriched stem cell subsets. While Bmi-1 knockdown sensitized breast cancer cells to 5-FU, induced apoptosis, and decreased the ratio of CD44+/CD24− subpopulation. Therefore, Bmi-1 can be used as a potential molecular marker of chemoresistant tumors.
As for the application of RNAi technology in HNCs, Yao et al 32 constructed recombinant Bmi1-RNAi lentiviral expression system and stably transfected laryngeal cancer Hep-2 cells, decreasing markedly the proliferation and invasion capabilities. Chen et al 33 silenced Bmi-1 expression in ALDH1+ primary HNSCC cell subsets by constructing Bmi-1shRNA lentiviral vector. Then they found that Bmi-1 knockdown distinctly inhibited self-renewal of ALDH1+ HNSCCs cell, improved chemotherapy sensitivity, and increased the level of chemoradiotherapy-mediated apoptosis. On the contrary, the Bmi-1 overexpression in ALDH1− CD44− subsets derived from HNSCCs could sufficiently recover stemness and self-renewal capability and promote stemness of CSCs. 34 In our recent research, we have confirmed that targeting Bmi-1 made CD44+ NPC cells sensitive to radiotherapy. 35 In this study, we further declared that the LV-Bmi-1shRNA-mediated gene silencing of Bmi-1 expression inhibited self-renewal capacity, proliferation, colony formation, migration, and invasiveness capacities of CD44+ NPC CSC-LCs under 5-FU or cisplatin, that is increased sensitivity of the cells to cisplatin and 5-FU, which was consistent with the above-mentioned reports.
The existing research suggested that self-renewal of stem cell is mainly mediated by Bmi-1 gene via the suppression of INK4a, inhibitor of CDK4; ARF, alternative reading frame; The INK4a -ARF locus encodes 2 tumor suppressor molecules, p16INK4a and p14/p19ARF. Huber et al 36 reported that the overexpression of Bmi-1, especially when combined with an absence of p16INK4a, was correlated negatively with disease-specific and recurrence-free survival in patients with oropharyngeal carcinoma. In NPC, it is reported that artemisinin could reduce Bmi-1 expression and enhance p16INK4a expression. The p16INK4a expression reduced when Bmi-1 expression in artemisinin-treated NPC cells increased. 12
In a recent study, Zhu et al 37 evaluated the role of Bmi-1 gene in the maintenance of stemness features including cell proliferation, migration, self-renewal, and chemosensitivity of human bladder CSC-like side population (SP). The Bmi-1 mRNA expression was found to be upregulated in SP cells, while the knockdown of Bmi-1 in SP cells induced suppression of cell proliferation, migration and tumor spheres formation, and elevated sensitivity to cisplatin simultaneously. They further found that Bmi-1 silencing repressed cell cycle progression by inhibiting the p16INK4a/p14ARF locus. Qiao et al 38 found that BMI-1 is overexpressed in the hTERT+-OME cells and hTERT+-HaCaT cells acquired by transduction of hTERT(human telomerase reverse transcriptase) to primary cultured oral keratinocytes and HaCaT cells (skin epidermal cells), while p16INK4a gene was silenced. They also found that proliferation and cell colony formation were inhibited when Bmi-1 expression was silenced by siRNA transduction. In addition, the p16INK4a gene expression was regained in Bmi-1 silenced cell lines. Poi et al 39 also found that Bmi-1 overexpressed in HNSCCs, while both P16INK4a and P14ARF were downregulated. Moreover, the Bmi-1 overexpression showed an association with p16INK4a downregulation in HNSCCs, which was consistent with our detection that downstream repressor genes p16INK4a and p14ARF are upregulated after gene silencing of Bmi-1 mediated by LV-Bmi-1shRNA in NPC. In addition, we also detected elevated expression of p53. These results seem to suggest that Bmi-1 may mediate biological behavior including cell apoptosis and chemoresistance of NPC through Bmi-1-p16INK4a/p14ARF gene regulatory pathways.
However, signaling pathways that are independent of p16INK4a/p14ARF have also been found, such as tumor suppressor gene phosphatase and tensin homolog, protein kinase B (AKT/PKB), nuclear factor-κB, and BCL-2. 40 –43 For instance, Qin et al 44 reported that expression of phosphor-AKT and antiapoptotic protein BCL-2 was downregulated in NPC cells in which Bmi-1 expression was inhibited, whereas apoptosis inducer BAX was upregulated. More importantly, blockade of AKT pathway by phosphoinositide 3-kinase inhibitors could not further improve the sensitivity of the cells with reduced Bmi-1 expression to 5-FU. The research further supported the hypothesis that different mechanisms may be involved in the occurrence and development of cancers.
In conclusion, our results revealed that gene silencing of Bmi-1 inhibited self-renewal capacity, proliferation, colony formation, migration, and invasion capacities of CD44+ NPC cells under 5-FU or cisplatin and increased sensitivity of the cells to cisplatin and 5-FU. And that Bmi-1 gene, as a transcriptional repressor, could negatively regulate the transcription of p16INK4a and p14ARF in CD44+ 5-8F cells which may result in the mediation of apoptosis via P53. There might be other mechanisms, which are worthy of further prospecting. It also demonstrated that Bmi-1 expression may play an important role in maintaining stem characteristics including self-renewal capacity and chemoresistance of CD44+ NPC cells and ultimately represents an ideal molecular target for the treatment of NPC.
Footnotes
Acknowledgments
We would express our outmost gratitude to all the personnels in the laboratory of Cancer Center, Union Hospital, Tongji Medical College, Huazhong University of Science and Technology (Wuhan, China) for their excellent technical assistance.
Declaration of Conflicting Interests
The author(s) declared no potential conflicts of interest with respect to the research, authorship, and/or publication of this article.
Funding
The author(s) disclosed receipt of the following financial support for the research, authorship, and/or publication of this article: This research was supported by the Natural Science Fund Project from Hubei Province, China (No. 2011CDB330). .
Abbreviations
References
Supplementary Material
Please find the following supplemental material available below.
For Open Access articles published under a Creative Commons License, all supplemental material carries the same license as the article it is associated with.
For non-Open Access articles published, all supplemental material carries a non-exclusive license, and permission requests for re-use of supplemental material or any part of supplemental material shall be sent directly to the copyright owner as specified in the copyright notice associated with the article.