
Abstract
Oral cancers suffer from poor 5-year survival rates, owing to late detection of the disease. Current diagnostic/screening tools need to be upgraded in view of disadvantages like invasiveness, tedious sample preparation, long output times, and interobserver variances. Raman spectroscopy has been shown to identify many disease conditions, including oral cancers, from healthy conditions. Further studies in exploring sequential changes in oral carcinogenesis are warranted. In this Raman spectroscopy study, sequential progression in experimental oral carcinogenesis in Hamster buccal pouch model was investigated using 3 approaches—ex vivo, in vivo sequential, and in vivo follow-up. In all these studies, spectral changes show lipid dominance in early stages while later stages and tumors showed increased protein to lipid ratio and nucleic acids. On similar lines, early weeks of 7,12-dimethylbenz(a)anthracene-treated and control groups showed higher overlap and low classification. The classification efficiency increased progressively, reached a plateau phase and subsequently increased up to 100% by 14 weeks. The misclassifications between treated and control spectra suggested some changes in controls as well, which was confirmed by a careful reexamination of histopathological slides. These findings suggests Raman spectroscopy may be able to identify microheterogeneity, which may often go unnoticed in conventional biochemistry wherein tissue extracts are employed, as well as in histopathology. In vivo findings, quite comparable to gold-standard supported ex vivo findings, give further proof of Raman spectroscopy being a promising label-free, noninvasive diagnostic adjunct for future clinical applications.
Introduction
Oral cancer is the most common cancer in Indian males with a poor 5-year survival rate, 1,2 ascribed to late detection of the disease and recurrences. Early detection of oral cancers is important as it leads to better prognosis and increased 5-year survival rate up to 90%. 3 -5 Currently practiced screening/diagnostic tools suffer from several disadvantages like tedious sample preparation, long output times, and interobserver variances. 6,7 Biopsy followed by histopathology, the current gold standard, is not only invasive but also depends on selection of appropriate region. Further, it may not be very convenient for screening and therapeutic monitoring which require repeated sampling. Rapid, objective, and preferably noninvasive alternatives as screening/diagnostic techniques are hence being extensively explored. 8
Raman spectroscopy (RS) is one such tool, which has found applicability in discriminating many diseases from healthy conditions. 9 The RS, which can provide chemical fingerprint/biochemical profile, has shown promising results in the diagnosis of several cancers, 8,10 -15 including oral cancers. 16 -25 Both ex vivo and in vivo RS studies in oral cancers have shown classification of pathological conditions along with detection of confounding factors like age-related changes and early events like cancer field effects in oral cancer, 16,17,21 -25 demonstrating efficiency of the technique. Still, further studies in exploring sequential changes in oral carcinogenesis are warranted. As such studies are not feasible in humans due to practical considerations, experimental carcinogenesis is the ideal approach. Hamster buccal pouch (HBP) is a widely used model for experimental oral carcinogenesis, 26 -28 owing to attributes such as cancer progression through stages similar to human oral carcinogenesis and 100% incidence of tumors in 14 weeks on treatment with 7,12-dimethylbenz(a)anthracene (DMBA). 29,30 In fact, feasibility of RS-based classification of frank tumors 31 as well as carcinogen-induced variations in HBP 32 on a limited sample size has already been reported.
The current study aims for sequential Raman spectroscopic evaluation of DMBA-induced buccal pouch carcinogenesis with respect to vehicle-treated age-matched controls. The following 3 approaches were adopted in this study: (1) Ex vivo—RS of excised snap frozen buccal pouches from hamsters 0 to 14 weeks postcarcinogen treatment, (2) In vivo—In vivo RS of buccal pouch 0 to 14 weeks posttreatment, and (3) follow-up approach—In vivo RS of buccal pouch of the same animals for 0 to 14 weeks posttreatment. Multivariate analyses were carried out to evaluate sequential changes associated with progression of cancer. Findings of the study are reported in the manuscript.
Materials and Methods
Ethics Approval
The study was approved by the Institutional Animal Ethics Committee, Advanced Centre for Treatment, Research and Education in Cancer (ACTREC), endorsed by the Committee for the Purpose of Control and Supervision of Experiments on Animals, Government of India: approval no. 12/2009, ACTREC.
Animal Model
A total of 181 six- to eight-week-old Golden Syrian male hamsters (Mesocricetus auratus) were used in the study. Oral carcinogenesis was induced in 103 HBPs (treated group) using standard DMBA carcinogenesis protocols. 33 Briefly, 0.5% DMBA (Sigma-Aldrich, purity 95%, MO, USA) dissolved in groundnut oil (Dhara, Mumbai, India) was topically applied using a paint-brush (Camlin, no. 4, Mumbai, India) on the right buccal pouch thrice a week for 14 weeks. Seventy-eight HBPs were treated with only oil (vehicle control group). All animals were housed under standard laboratory conditions, fed a diet of in-house-prepared pellets, and provided with water ad libitum. The schematics of experimental protocol are shown in Figure 1A.
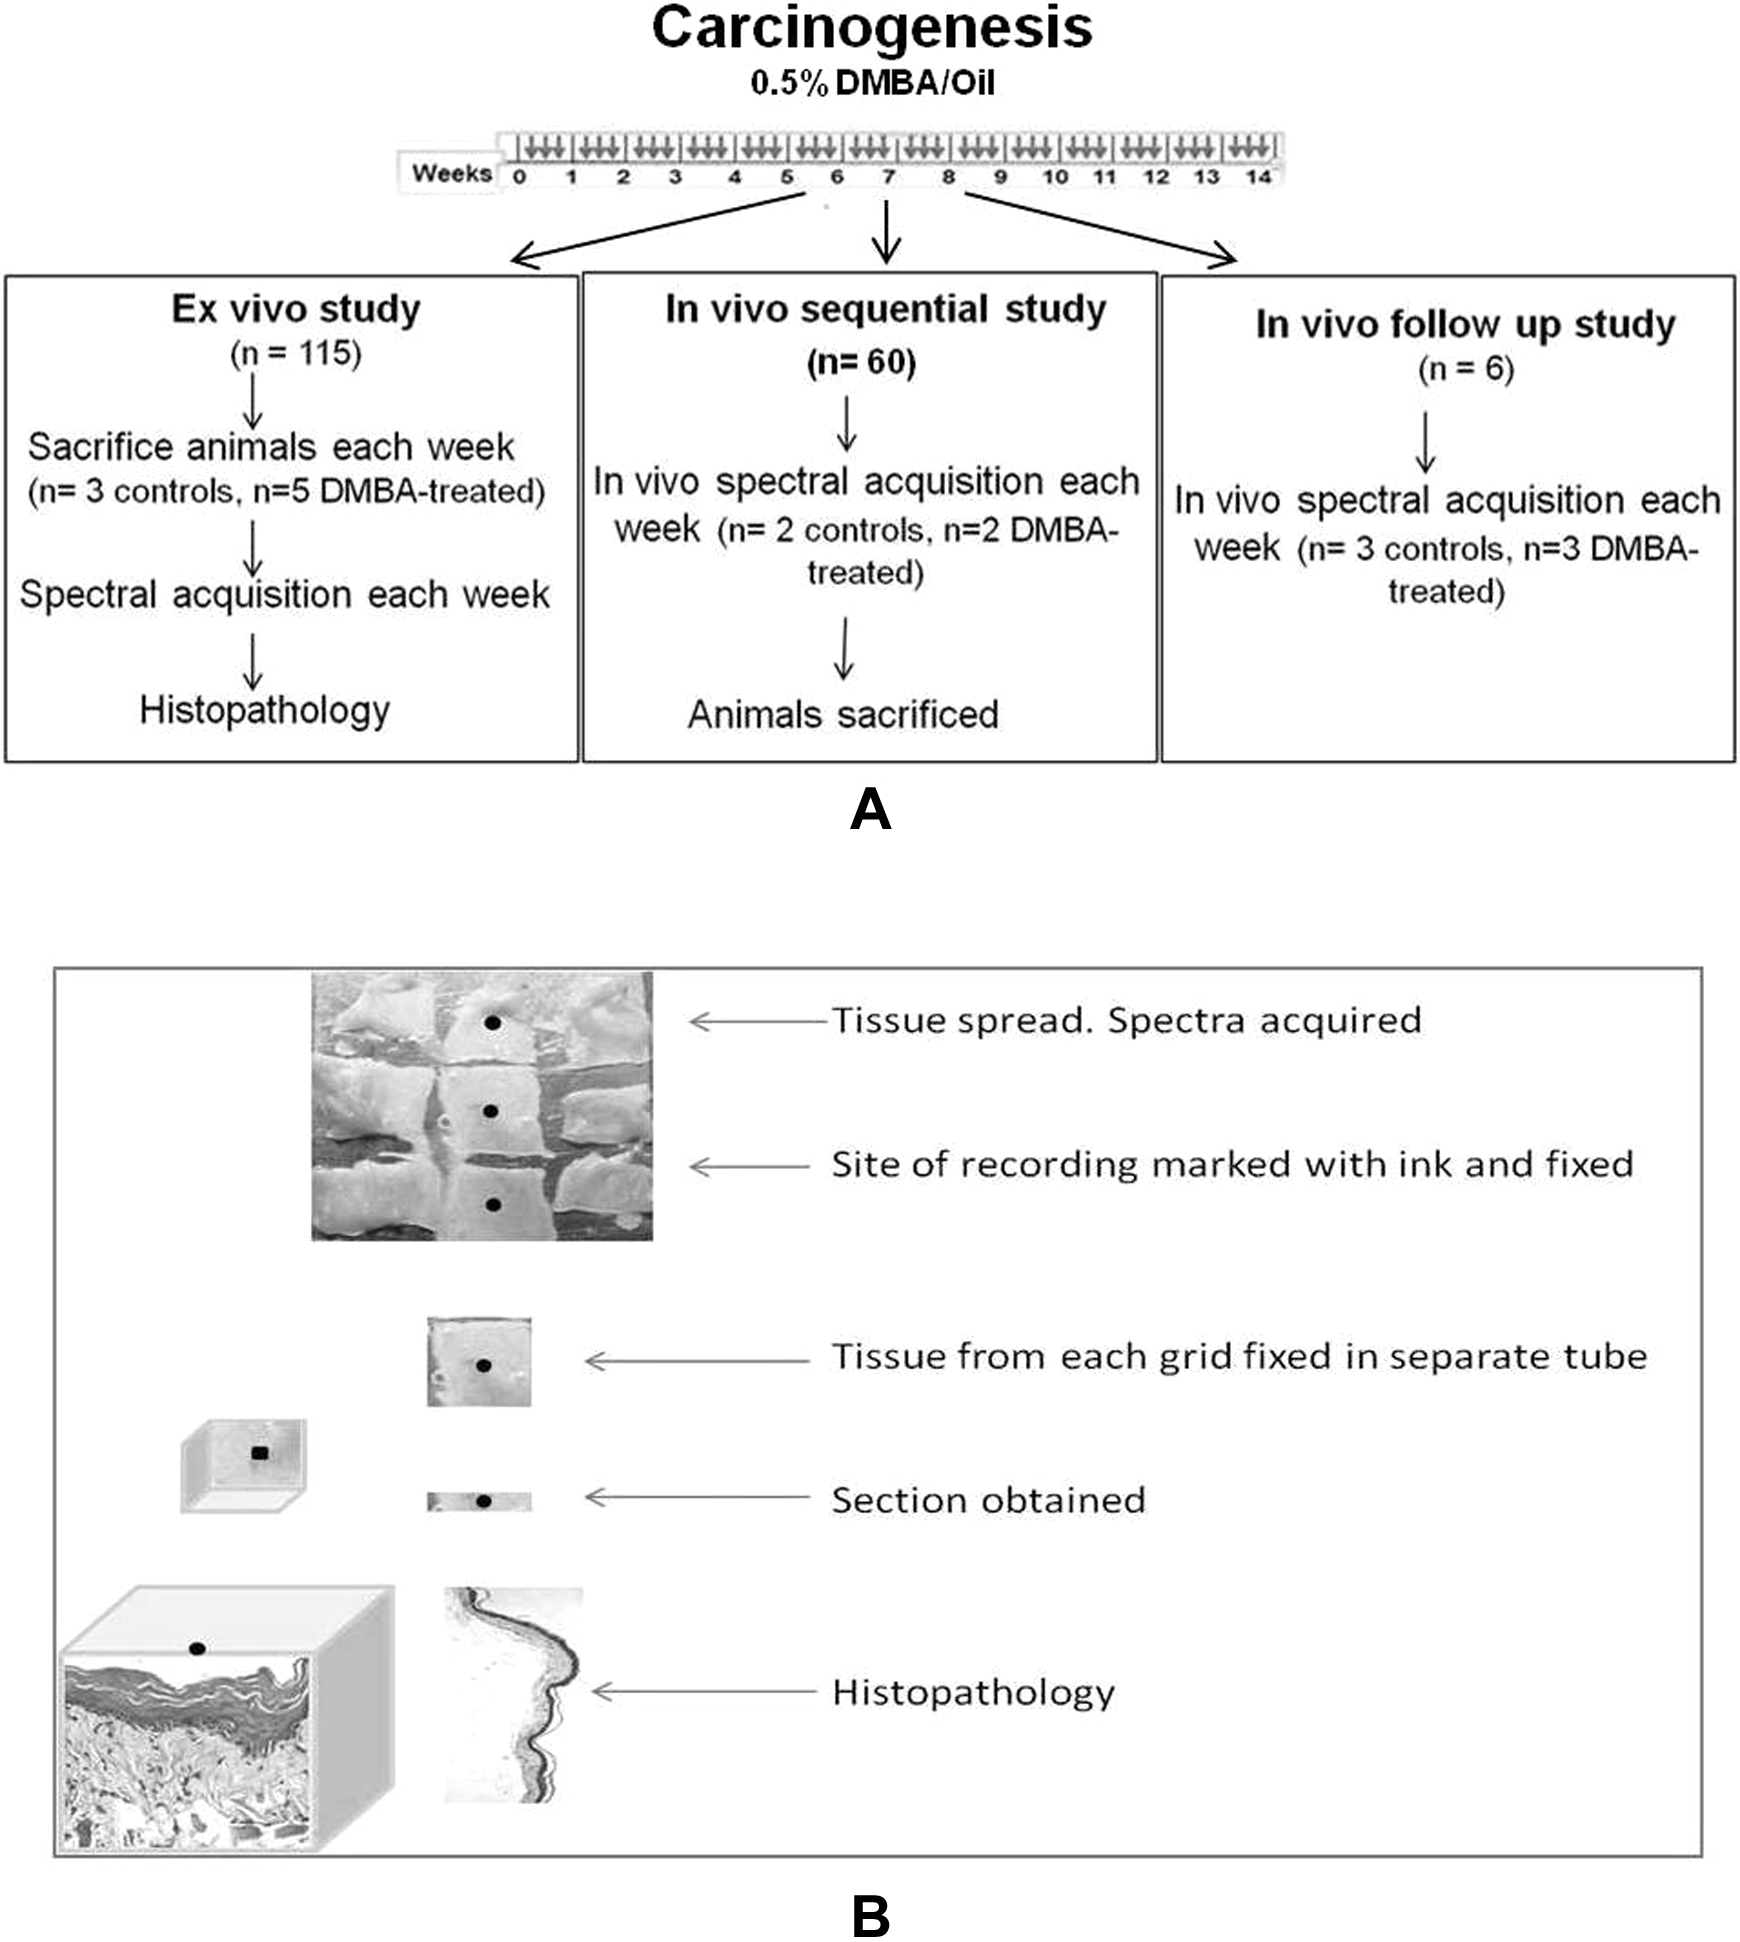
Schematics of protocols followed: (A) DMBA application regime (thrice weekly application for 14 weeks, small arrows indicate application of oil/DMBA) and protocol for ex vivo, in vivo sequential, and in vivo follow-up study. (B) Protocol for obtaining sections for histopathology. DMBA indicates 7,12-dimethylbenz(a)anthracene.
The study was carried out using the following 3 approaches: Ex vivo study: 5 test and 3 control animals were killed every week postcarcinogen treatment for 14 weeks. Buccal pouch were then excised out of the sacrificed hamsters, snap frozen in liquid nitrogen, and stored at −80°C. Spectra were recorded from these tissues after passive thawing on ice and spreading over aluminum grids (3 × 3). One spectrum was recorded from each grid, tissues were cut along gridlines and processed for histopathology (Figure 1B).
In vivo study: In vivo Raman spectra were acquired from 2 test and 2 control HBPs of anaesthetized animals (150 mg ketamine and 10 mg xylazine/kg body weight) every week for 14 weeks. After spectra acquisition, the animals were killed, pouches excised out, and processed for histopathology. Follow-up study: In vivo Raman spectra were acquired from buccal pouch of the same hamsters (3 test and 3 controls) postanaesthetization for 14 weeks without sacrifice.
The buccal pouches were also photographed (Canon SX220HS, Tokyo, Japan) every week. The total number of animals used in various approaches are shown in Table 1.
Number of Animals Used Per Week.

Raman Spectroscopy
Spectra were recorded with HE-785 commercial Raman spectrometer (Horiba Jobin Yvon, France), details of which have been described elsewhere. 22,23 Briefly, this system consists of a diode laser (PI-ECL-785-300-FC; Process Instruments, Utah, USA) of 785 nm wavelength as excitation source and HE 785 spectrograph coupled with a charge-coupled device (CCD; Synapse, France) as dispersion and detection elements. The spectrograph is equipped with a fixed 950 gr/mm grating. Spectral resolution, as specified by the manufacturer, is ∼4 cm−1. The excitation source and the detection system were coupled by commercially available fiber-optic Ramanprobe (Model: RPS 785/ 12-5; InPhotonics Inc, Downy St, USA) consisting of 105 μm excitation fiber and 200 μm collection fiber (NA 0.40). As per manufacturer’s specifications, theoretical spot size and depth of penetration of the Raman probe are 105 μm and 1 mm, respectively. Typically, laser power −70 mW was used for excitation. Spectra were integrated for 15 seconds and averaged over 3 accumulations. Approximately 9 spectra were recorded from each pouch in ex vivo study, 1 spectrum from each aluminum grid, as shown in Figure 1B. In case of in vivo sequential study, 15 spectra were recorded from selected sites and 10 to 15 spectra were recorded from each pouch for in vivo follow-up study.
In this manuscript, control and DMBA-treated groups have been designated as C and T, respectively, while the number succeeding C (Cx) or T (Tx) denotes the number of weeks of treatment with DMBA or oil. Thus, C0, C1, and C14 indicate control of 0, 1, and 14 weeks of oil treatment and T0, T1, and T14 indicate DMBA treatment for 0, 1, and 14 weeks, respectively.
Data Analysis
Spectral preprocessing
Raw Raman spectra were corrected for CCD response using a National Institute of Standards and Technology certified SRM 2241 material, followed by subtraction of spectral contribution from optical elements. 34 To remove interference of slow moving background, first derivatives of spectra (Savitzky-Golay method; window size 3) were computed. 35,36 Spectra were interpolated in the 1200 to 1800 cm−1 region as our previous studies on oral cancer have already demonstrated the efficacy of this region in classification. Moreover, this region is free from interference of fiber signals. Interpolated spectra were vector normalized to remove intensity-related variations and subjected to multivariate analysis.
Computation of mean spectra
Average or mean spectra were computed from the background-corrected spectra for each class and baseline corrected by fitting a fifth order polynomial function using LabSpec 4.18 (Horiba Jobin Yvon). These baseline-corrected spectra followed by area normalization were used for obtaining mean for spectral comparison across different groups.
Multivariate analysis
Preprocessed spectra were subjected to unsupervised principal component analysis (PCA), as well as supervised principal component-based linear discriminant analysis (PC-LDA) using algorithms implemented in MATLAB-based in-house software. 37 The PCA is the most frequently applied method for computing linear latent variables, which allows visual inspection of clustering of objects or variables through unsupervised classification. 38 The main aim of PCA is dimension reduction by which it explains maximum variability with few principal components/factors. First few PCs contribute to maximum variance. Scatter plots are often used to visualize/represent multivariate data by plotting score of PCs against each other.
Linear discriminant analysis (LDA), a supervised classification method, maximizes interclass separation and reduces intraclass separation to bring out discrimination. 39 For data with high dimensionality, dimension reduction may be achieved by application of PC-LDA: PCA followed by LDA, using PCA scores, instead of original variables. Classification efficiency of standard models is evaluated by leave-one-out cross-validation (LOOCV), which is based on a hypothetical validation set used in absence of an explicit validation set. Leave-one-out involves using a single observation from the original sample as the validation data and the remaining observations as training data. This is repeated such that each observation in the sample is used once as the validation data and averaged over the rounds.
Results and Discussion
The study aims to evaluate ability of RS to distinguish DMBA-induced sequential cancer progression in HBP. The HBP model is well characterized for experimental oral carcinogenesis and is shown to progress through precancer stages, that is, hyperplasia, dysplasia, carcinoma in situ, and squamous cell carcinoma (SCC), as observed in human oral cancers. As per histopathological reports in literature, HBPs, during weeks 0 to 4 of DMBA-induced carcinogenesis, are mostly healthy/normal, with some inflammatory and hyperplastic changes observed around second week. Weeks 5 to 11 show varying grades of dysplasia, along with hyperplastic and normal areas. Weeks 12 to 14 are mostly SCC along with other precancer stages.
Three approaches were used in the study—ex vivo, in vivo sequential, and in vivo follow-up. In all the approaches, a 3-model system involving week 0 controls (C0) along with DMBA-treated HBP (Tx) and age-matched controls (Cx) were used (eg, C0 vs C1 vs T1, C0 vs C2 vs T2, C0 vs C3 vs T3, and so on up to C0 vs C14 vs T14) for data analysis. This is expected to make the model more robust as compared to a 2-model system where only treated and age-matched controls were used (eg, C1 vs T1). Our RS studies on human oral mucosa have already demonstrated feasibility of classifying early and late physiological age of healthy volunteers which is shown to have no bearing on classification of normal and abnormal conditions.
24
No age-related physiological changes have been reported so far in hamsters. A 3-model system (C0 vs Cx vs Tx) also highlights any possible age-related changes, which could affect classification. 1. Ex vivo study: “Ex vivo” study involved RS of HBPs excised every week postcarcinogen treatment followed by histopathological examination of the same regions. Spectral features of week 0 control (C0) and DMBA-treated buccal pouches (T1-T14) have been shown in Figure 2. C0 and T0 spectra show dominance of lipid features—1303 cm−1, δCH2 (1448 cm−1), amide I (1655 cm−1), and ester bands (1750 cm−1), whereas T14 (frank tumors) spectra show dominance of proteins and nucleic acids with change in features in 1200 to 1400 cm−1 regions corresponding to amide III, CH2 (1454 cm−1), 1583 cm−1, and broad amide I (1651 cm−1). The spectra from T2 to T13 also show changes in amide III and amide I regions which progressively indicate increased protein dominance. These spectral features correlate well with human buccal mucosa, featuring similar bands.
16,17
A probable reason for loss of lipids and increased dominance of proteins in tumors or other pathological conditions could be the loss in the architectural arrangement of epithelial layers, indicating loss of lipid features. Moreover, cells under pathological conditions undergo changes in the amounts of surface and receptor proteins, enzymes, antigens, and antibodies, which may give rise to a protein dominated spectrum.
19
These findings further corroborate earlier reports of ex vivo and in vivo RS studies on humans.
16
-21,40
The 1583 cm−1 band, attributed to heme proteins and prominently observed in DMBA-treated pouches of later weeks, could be due to angiogenesis—a well-known hallmark of carcinogenesis.

Mean spectra of 7,12-dimethylbenz(a)anthracene (DMBA)-treated Hamster buccal pouch. (A) week 0, (B) week 1, (C) week 2, (D) week 3, (E) week 4, (F) week 5, (G) week 6, (H) week 7, (I) week 8, (J) week 9, (K) week 10, (L) week 11, (M) week 12, (N) week 13, and (O) week 14.
Multivariate analysis was carried out using both unsupervised PCA and supervised PC-LDA followed by LOOCV.
Principal Component Analysis
Principal component analysis scatter plots for all 14 weeks using scores of factor 1 versus factor 2 are shown in Figure 3. These plots exhibit overlapping clusters for all the 3 groups in the initial weeks, that is, from 0 to 4 weeks. An increased classification of treated pouch spectra was observed from fifth week onward, attributable to DMBA-induced changes. Plateauing of classification was observed for weeks 8 to 11 while exclusive clusters were observed from 12th week onward showing the best classification between treated and control spectra during these later weeks. Poor classification was observed between C0 and age-matched controls, suggesting lack of appreciable age-related changes in the 14-week period of carcinogenesis.

Scatter plots of principal component analysis (PCA) over the period of 14 weeks of DMBA-induced carcinogenesis in Hamster buccal pouch (X-axis: score of factor 1, Y-axis: score of factor 2). C0 indicates week zero-untreated controls; Cx, age-matched controls for a given week; Tx, 7,12-dimethylbenz(a)anthracene (DMBA)-treated spectra of a given week.
Principal Component-Based Linear Discriminant Analysis
As PCA is an overview tool used to visualize trends in the data and not a classification tool, PC-LDA was carried out to explore feasibility of classification through supervised analysis between C0, Cx, and Tx. To avoid overfitting of the models, 2 to 4 factors were used. Efficiency of models was evaluated by LOOCV. Week-wise LOOCV findings are presented in the form of confusion matrices in Table 2. On the basis of PC-LDA findings, 14 weeks can be subdivided into 3 phases—weeks 0 to 7, weeks 8 to 11, and weeks 12 to 14. T0 to T7 showed progressive increase in classification, up to 70%. T8 to T11 showed a plateauing phase where classification efficiency remained around 70%, while T12 to T14 showed classification up to 100%. Thus an overall sequential increase in classification efficiency was observed over 14-week carcinogenesis regimen.
LOOCV Confusion Matrix for Ex Vivo Study.a
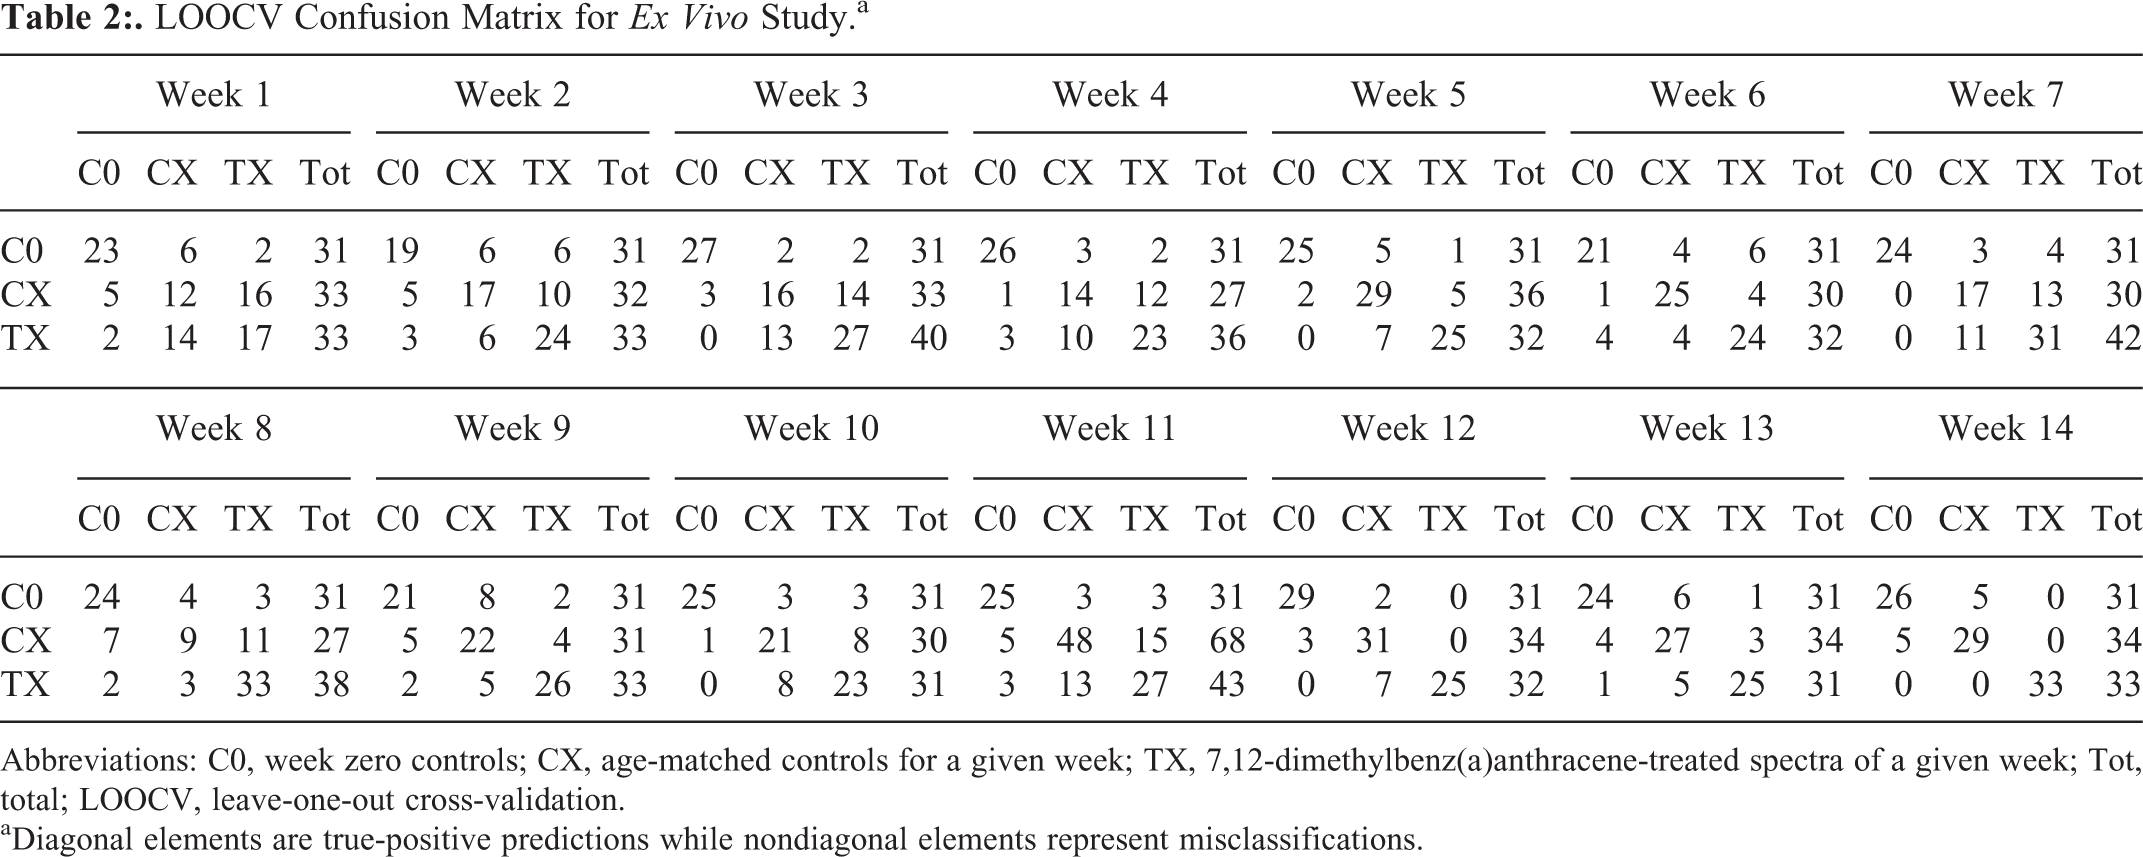
Abbreviations: C0, week zero controls; CX, age-matched controls for a given week; TX, 7,12-dimethylbenz(a)anthracene-treated spectra of a given week; Tot, total; LOOCV, leave-one-out cross-validation.
aDiagonal elements are true-positive predictions while nondiagonal elements represent misclassifications.
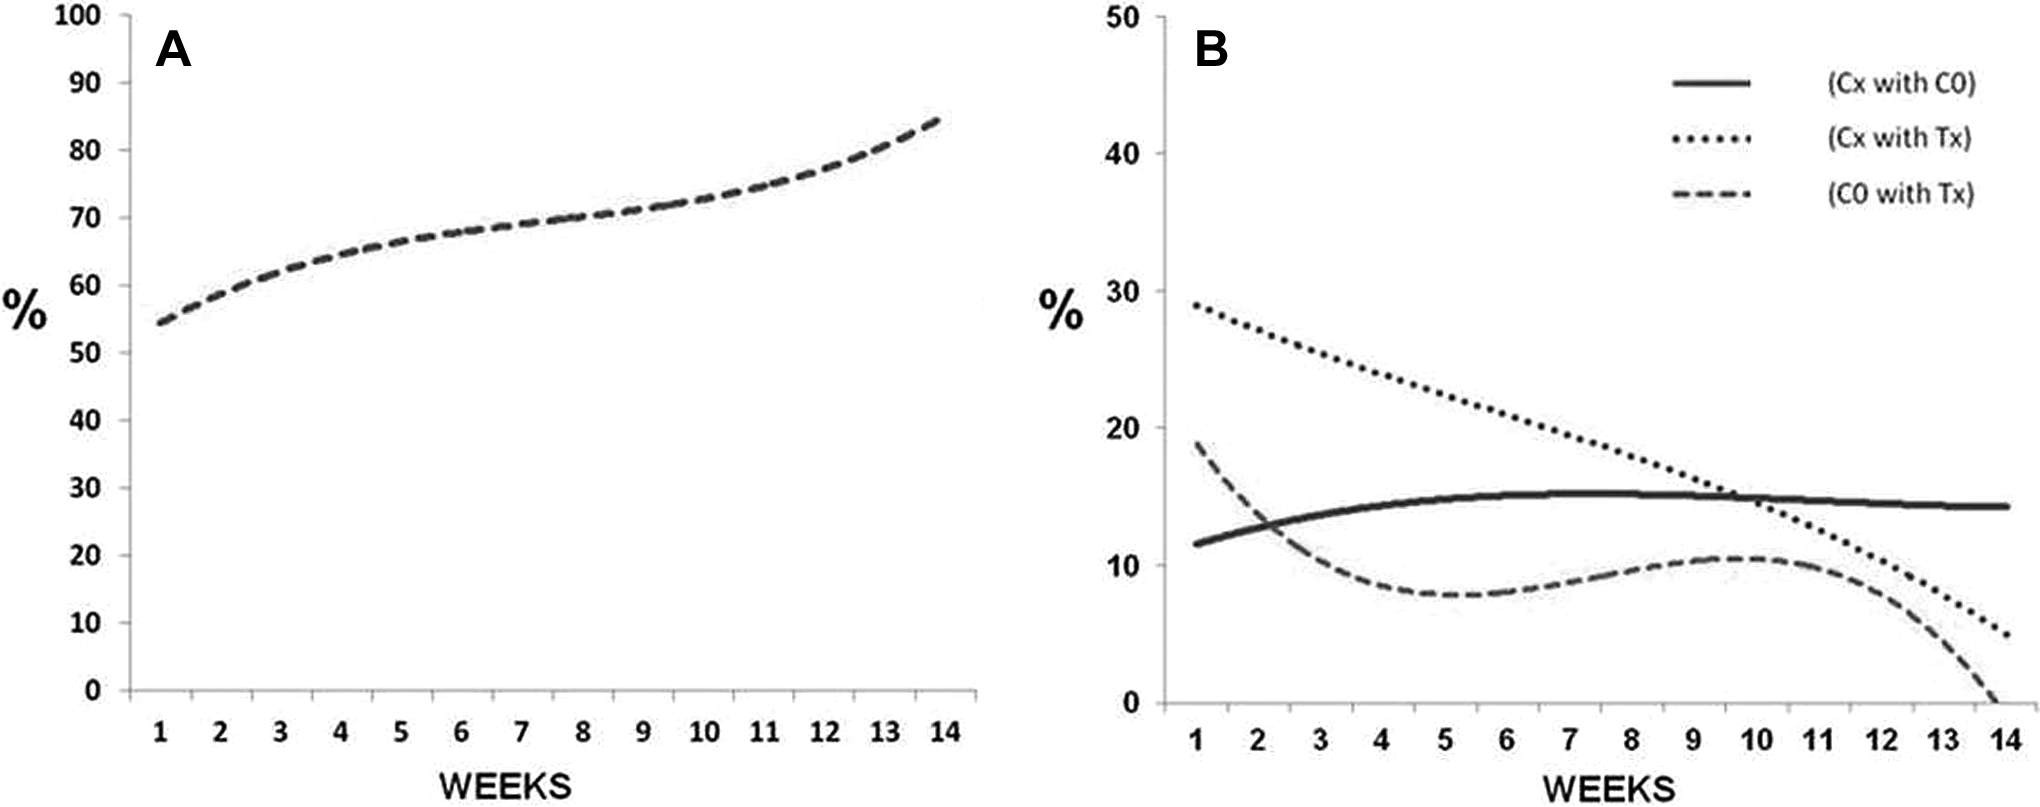
For better understanding of the above-mentioned trends in the data, the LOOCV confusion matrices are also presented graphically (Figure 4). It is noteworthy that true classification is indicative of differences between the groups while misclassifications between groups suggest homogeneity and similarity in biochemical properties. 41 -43 First, to understand true classification of Tx over 14 weeks, percentage of correct classification for treated group (Tx) was plotted against each week (Figure 4A). Second, to understand behavior of misclassified spectra during carcinogenesis, misclassifications were plotted—percentage of misclassification for Cx with C0, Tx with C0, and Tx with Cx and are shown in Figure 4B. Cx vs C0 would suggest age-related changes, if any between controls while Tx versus Cx/C0 would be indicative of changes due to DMBA-induced carcinogenesis.

(A) Week-wise true percentage classification of Tx; (B) week-wise percentage misclassification of Cx with C0, Cx with Tx, and C0 with Tx for ex vivo study for the period of 14 weeks (X-axis—weeks; Y-axis—percentage of classification). C0 indicates week zero-untreated controls; Cx, age-matched controls for a given week; Tx, 7,12-dimethylbenz(a)anthracene (DMBA)-treated spectra of a given week.
Percentage of correct classification for Tx (Figure 4A) increases from about 50% in week 1 to ∼70% by the 7th week, remains similar between 8 and 11 weeks, then increases to >90% by 14th week. The trend for misclassifications are shown in Figure 4B. Misclassification of C0 controls with Tx spectra (broken line) and Cx controls with Tx spectra (dotted line) decreased as weeks progressed, suggesting lesser similarities between DMBA-treated pouches and controls. Misclassification of C0 with Cx controls remained almost same throughout 14 weeks, indicating lack of significant changes and hence similarities between controls.
Thus the ex vivo study demonstrates feasibility of studying sequential changes during DMBA-induced carcinogenesis. However, this approach is invasive. It is known that noninvasive, in vivo approach is always desirable in a clinical set-up, especially for screening and therapeutic monitoring. Hence in vivo studies were carried out to ascertain above-described findings of the ex vivo study.
2. In vivo sequential study: In vivo study also exhibits changes similar to ex vivo study. Similar spectral features and trends of PCA classification like the ex vivo study were observed in this approach (data not shown). To demonstrate these similarities, PC-LDA data are shown in Table 3 and Figure 5. Percentage of correct classification for Tx (Figure 5A) increased from about 50% in week 1 to more than 60% by the 7th week, remained similar between 8 and 11 weeks, then increased to more than 90% by 14th week. Misclassification (Figure 5B) between C0 and Cx (continuous line) remained constant while C0 versus Tx (broken line) and Cx versus Tx (dotted line) decreased over the period of 14 weeks. Thus, trends were similar in ex vivo and in vivo sequential studies.
3. In vivo follow-up study: Follow-up studies allow monitoring of changes in vivo in the same animals, avoiding interanimal variations and require fewer animals. Thus in vivo follow-up approach was also employed. In this case too, spectral features and PCA results were found to be similar to ex vivo and sequential in vivo studies (data not shown). Even LOOCV results for each week show similarities between this and the other two approaches as shown in Table 4 and graphically presented in Figure 6. The classification trends observed in this study was comparable to the in vivo sequential and ex vivo study. True classification (Figure 6A) increased from 0 to 7 weeks, plateaued around 8 to 11 weeks, and then increased beyond 80% by 14th week, whereas misclassifications between C0 and Tx, Cx, and Tx decreased and C0 and Cx remained almost similar (Figure 6B).

(A) Week-wise true percentage classification of Tx; (B) week-wise percentage misclassification of Cx with C0, Cx with Tx, and C0 with Tx for in vivo sequential study for the period of 14 weeks (X-axis—weeks; Y-axis—percentage of classification). C0 indicates week zero-untreated controls; Cx, age-matched controls for a given week; Tx, 7,12-dimethylbenz(a)anthracene (DMBA)-treated spectra of a given week.
LOOCV Confusion Matrix for in vivo Sequential Study.a

Abbreviations: C0, week zero controls; CX, age-matched controls for a given week; TX, 7,12-dimethylbenz(a)anthracene-treated spectra of a given week; Tot, total; LOOCV, leave-one-out cross-validation; .
aDiagonal elements are true-positive predictions while nondiagonal elements represent misclassifications.
(A) Week-wise true percentage classification of Tx; (B) week-wise percentage misclassification of Cx with C0, Cx with Tx, and C0 with Tx for in vivo follow-up study for the period of 14 weeks (X-axis—weeks; Y-axis—percentage of classification). C0 indicates week zero-untreated controls; Cx, age-matched controls for a given week; Tx, 7,12-dimethylbenz(a)anthracene (DMBA)-treated spectra of a given week.
LOOCV Confusion Matrix for in vivo Follow-Up Study.a

Abbreviations: C0, week zero controls; CX, age-matched controls for a given week; TX, 7,12-dimethylbenz(a)anthracene-treated spectra of a given week; Tot, total; LOOCV, leave-one-out cross-validation.
aDiagonal elements are true-positive predictions while nondiagonal elements represent misclassifications.
A Note on Classifications and Misclassification
True classification is indicative of differences between the groups while misclassifications between groups suggest homogeneity and similarity in biochemical properties. Hence, both true classifications and misclassifications have been used to draw inference in this study (Figures 4 –6). In case of the DMBA-treated pouches (Figures 4A, 5A, and 6A), true classification of DMBA-treated pouches shows progressive increase from ∼50% in week 1 to ∼100% in week 14, indicating potential of RS in identifying sequential changes. But, true classification may not be the complete picture in case of biochemically similar groups. For example, since week 0 and age-matched controls are of similar nature, they are expected to misclassify and thus lead to poorer classifications. Thus logically, if there were age-related differences, misclassifications between week 0 and age-matched controls should have decreased by 14 weeks leading to better classification. No change in misclassification between C0 and Cx might suggest homogeneity 41 –43 due to possible lack of appreciable age-related changes. On the contrary, higher misclassifications between Tx and Cx/C0 during the early weeks indicate similarity. The similarities decrease with progression of carcinogenesis during later weeks leading to decreased misclassification and as expected, reaches to a minimum by 14 weeks of DMBA treatment.
Visual and Histopathological Support
As shown in Figure 7, the following changes were observed in buccal pouches of hamsters: (1) visibly and histopathologically normal—0 and 1 weeks postcarcinogen treatment; (2) inflammatory and ulcerative changes in response to DMBA toxicity are observed 2 and 3 weeks postcarcinogen treatment (histopathologically hyperplastic); (3) visually normal/ablation of inflammation (attributable to mucosal recovery) is observed 3 to 6/7 weeks posttreatment, histopathologically these tissues show hyperplasia and a few low-grade dysplasia (LGD) regions; (4) visible reddening of mucosa (erythema) appears 7 weeks post-DMBA application, histopathologically these tissues present hyperplasia, LGD, and high-grade dysplasia; (5) mucosal roughening and small papillomas are observed 9 weeks onward, while (6) frank tumors that are pathologically characterized as moderate to well differentiated SCC are seen 12 to 14 weeks postcarcinogen application. Most vehicle-treated HBPs were visibly and histopathologically normal throughout the duration of the study.
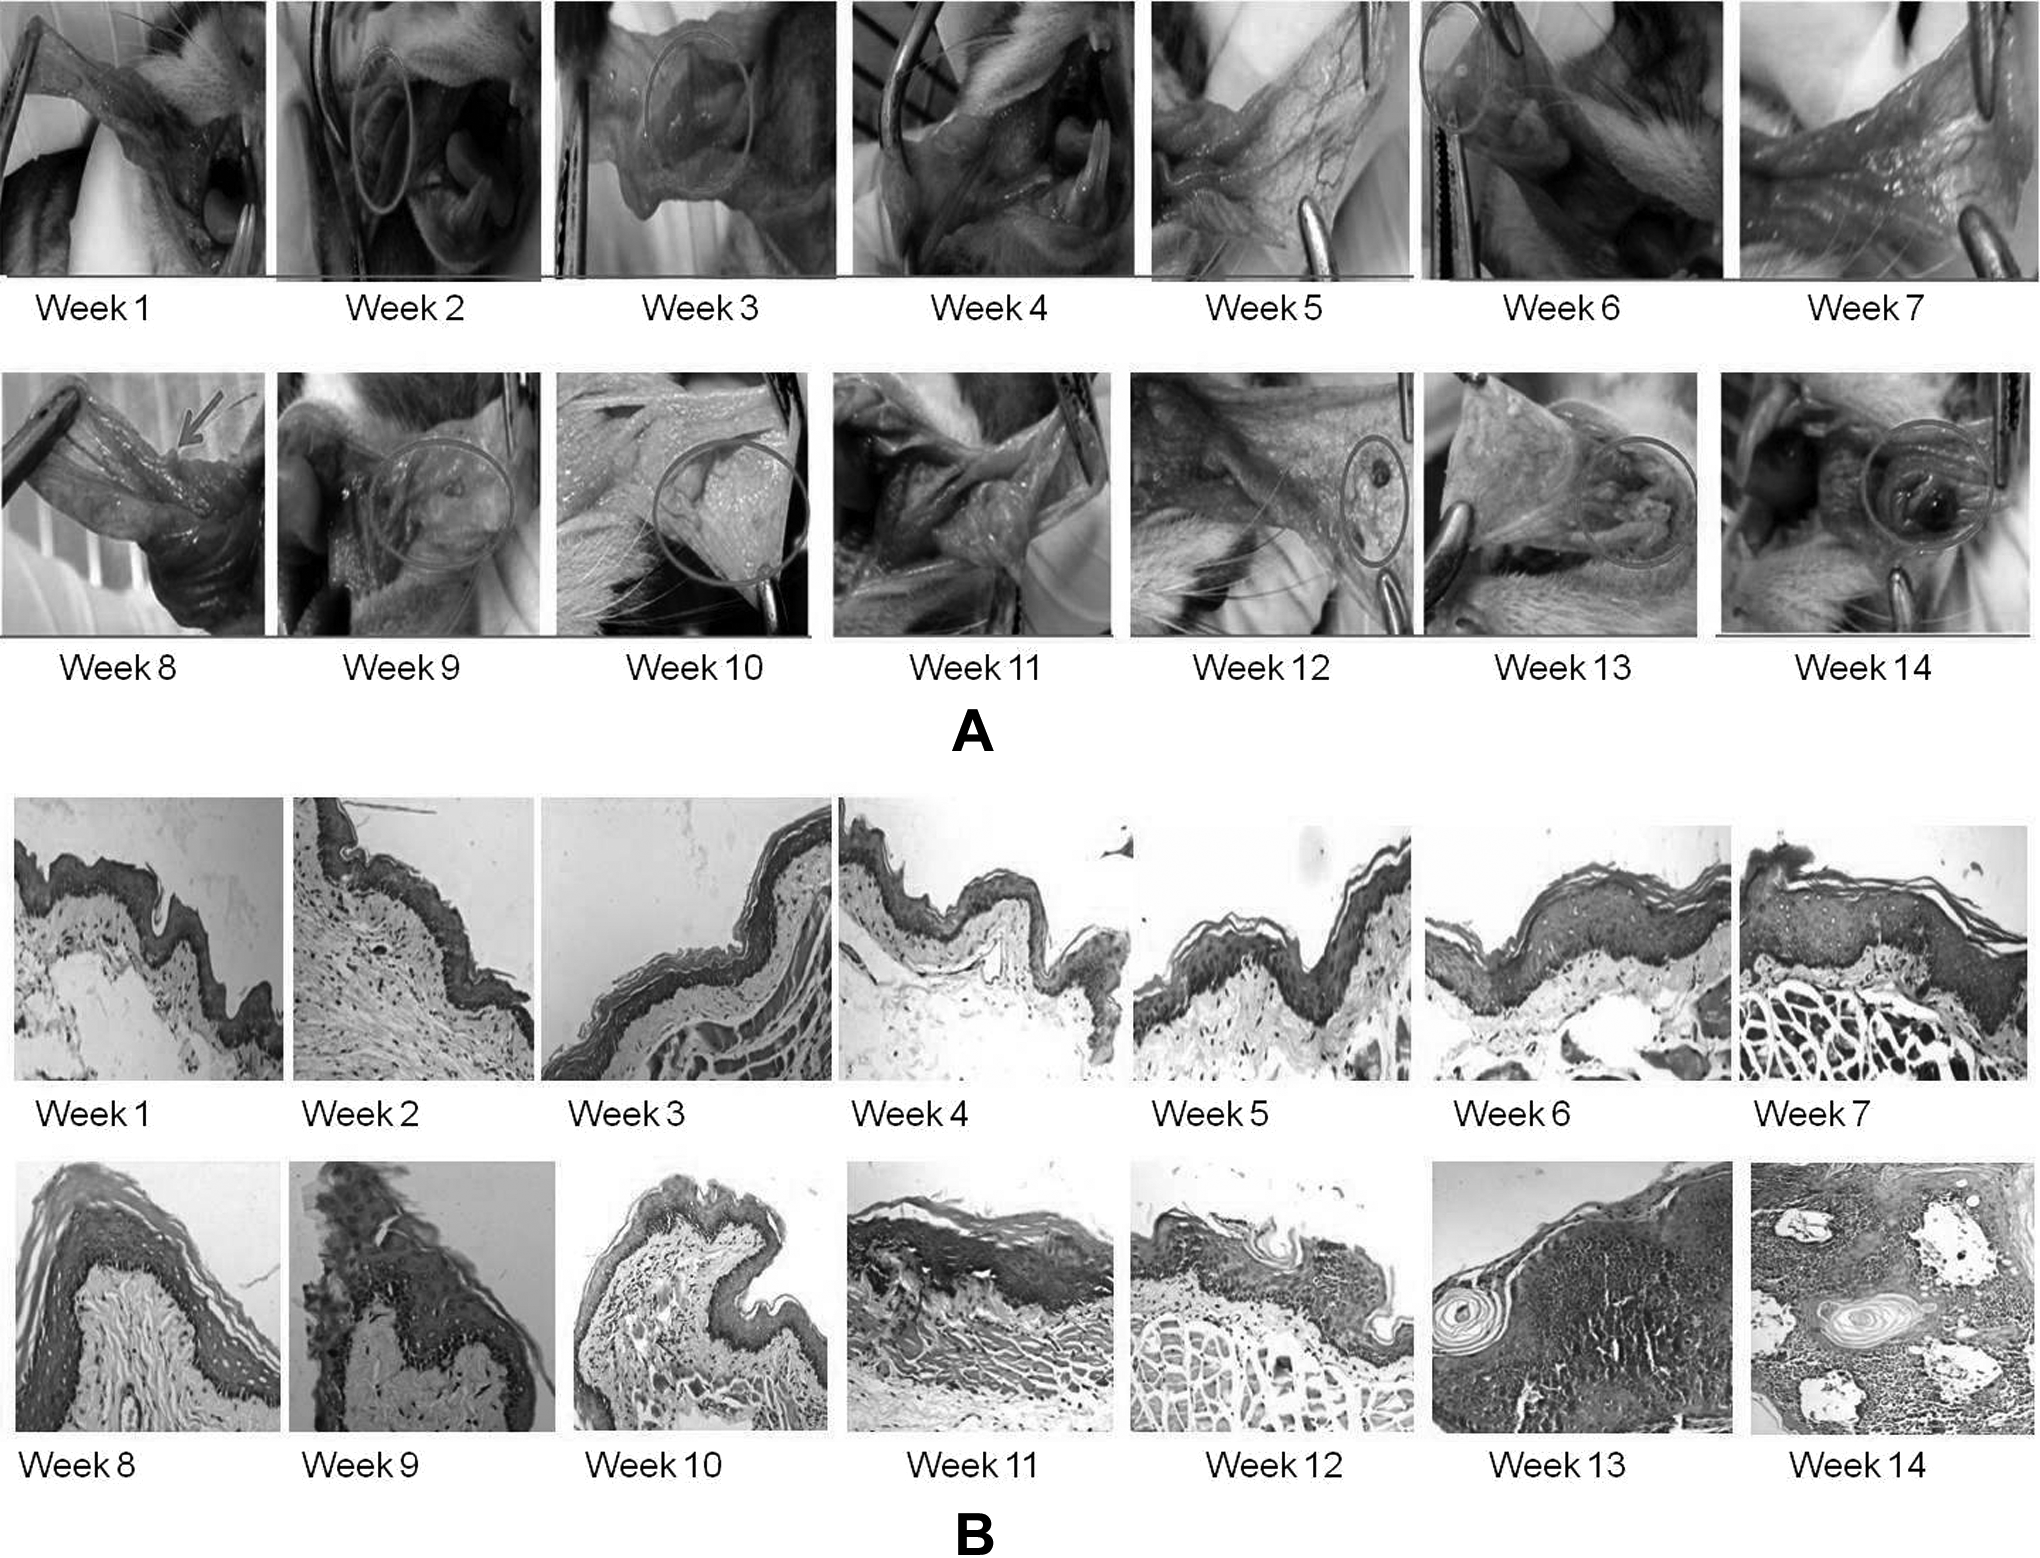
(A) Visual changes over the period of carcinogenesis in hamster buccal pouch (B) representative histopathology images during carcinogenesis in hamster buccal pouch.
Misclassifications Between Treated and Controls
A few misclassifications of treated groups with age-matched controls suggested a reassessment. Histopathological analysis of these control tissues has revealed hyperplastic changes in small areas in many age-matched controls and dysplastic changes in small regions in a few control slides. A probable reason for these abnormal changes could be tissue injuries in the pouch due to repeated pulling out of HBP by forceps. Moreover, hamsters store the food pellets in their pouch, which may lead to further mechanical irritation, resulting into small areas of abnormalities. Chronic mechanical irritation has also been shown to be a causative factor in oral cancers. 44,45 Representative abnormal areas in histopathological sections from 2 different control pouches are shown in Figure 8. Another reason for observed misclassification could be due to differences in the laser probed area (∼200 μm) and the sections used for histopathology evaluation. In order to get better histopathological evaluation, 3 sections of 5 μm were analyzed owing to practical limitations. Thus despite best of efforts, microheterogenity within the 200 μm of probed area cannot be ruled out.
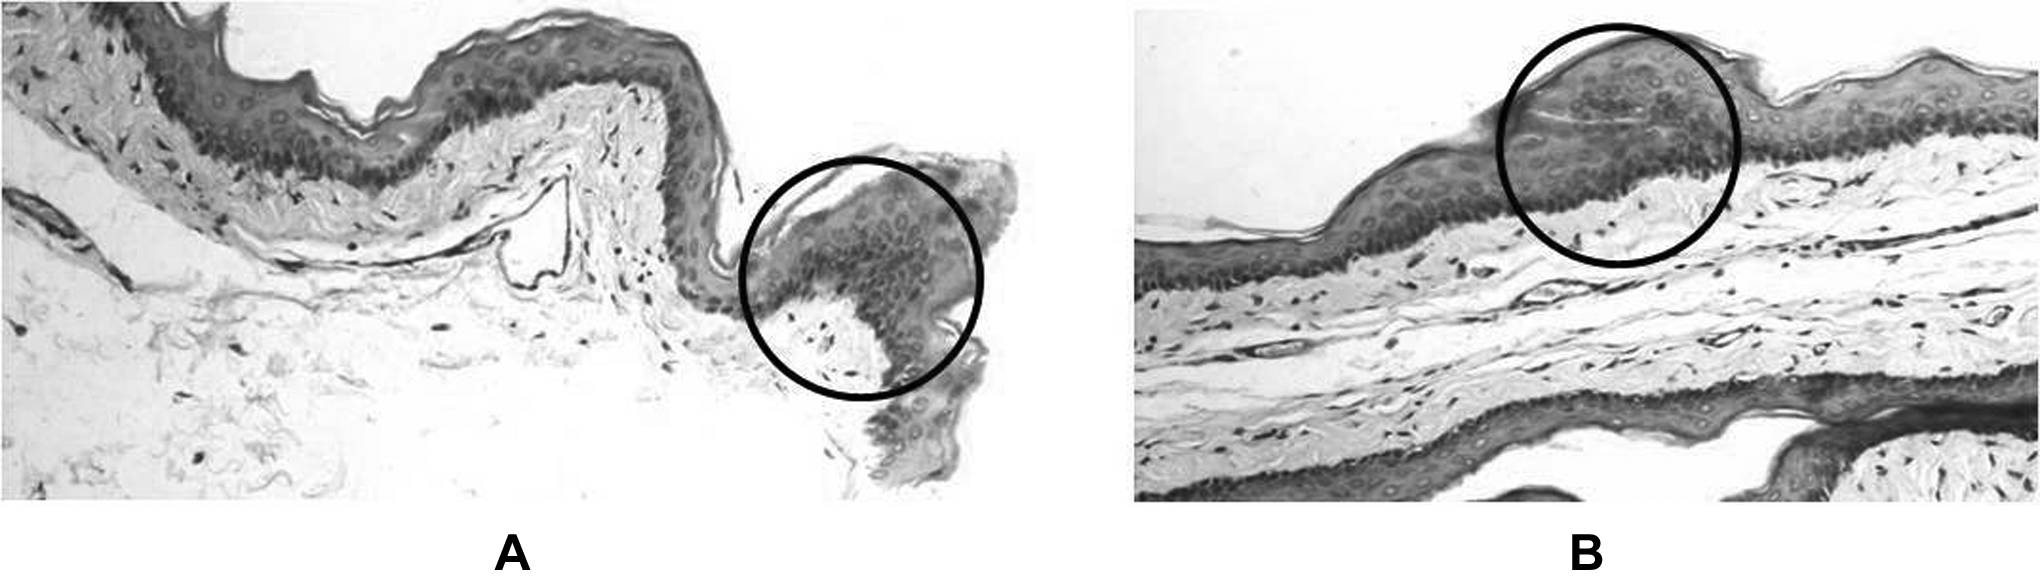
Representative images of abnormal areas (in circle) observed in control pouches.
On the basis of our findings, the process of carcinogenesis in HBP model can be grouped into 3 subphases—weeks 0 to 7, weeks 8 to 11, and weeks 12 to 14. Weeks 0 to 7 show progressive increase in classification efficiency of DMBA-treated pouches due to accumulation of hyperplastic and dysplastic changes. Weeks 8 to 11 show a similar classification efficiency (plateau phase), suggesting nonappreciable changes during this phase. Histopathology-based evaluation suggests accumulation of hyperplastic and dysplastic changes over these weeks. Various studies on biomarkers like P53, C-myc, and Ki67 have shown culmination of marker coexpression, around 10 weeks of DMBA treatment in HBP. 46,47 Thus, homogeneity in these conditions may have lead to plateauing phase around 8 to 11 weeks. By 12th week, these changes progress toward SCC with well-defined tumors and might explain increased classification from 12th to 14th weeks. Similar trends of classification and misclassification were observed in both ex vivo and in vivo approaches. Thus, in vivo diagnosis through RS is quite comparable to ex vivo findings supported by the gold-standard histopathology, giving further proof of RS being a promising noninvasive diagnostic adjunct for screening/diagnosis of oral cancers.
Conclusion
In this RS study, sequential progression in experimental oral carcinogenesis in HBP model was explored using 3 approaches—ex vivo, in vivo sequential, and in vivo follow-up. In all these studies, spectral changes show lipid dominance in early stages while later stages and tumors showed increased protein to lipid ratio and nucleic acids. On similar lines, early weeks of DMBA-treated and control groups showed higher overlap and low classification. This classification further increased progressively, reached a plateau phase, and subsequently increased up to 100% by 14 weeks. The classifications between treated and control spectra suggested some changes in controls as well, which was confirmed by careful examination of histopathological slides. This suggests RS may be able to identify microheterogeneity, which may often go unnoticed in conventional biochemistry wherein tissue extracts are employed, as well as in histopathology. Further, good correlation between both ex vivo and in vivo approaches indicates in vivo diagnosis through RS is quite comparable to ex vivo findings supported by gold standard, giving further proof of RS being a promising label-free, noninvasive diagnostic adjunct for future clinical applications.
Footnotes
Acknowledgements
One of the authors (PK) would like to thank CSIR, New Delhi, for fellowship. The authors would like to thank Dr Lekha Kukreja for histopathological analysis and Mr Pramod Tawde, Mrs Arti Hole, and Miss Aditi Sahu for assistance in animal experiments.
Authors’ Note
This work has been done under the project entitled “Comparative evaluation of diagnostic efficacy of laser Raman Spectroscopy and histopathology in oral carcinogenesis: Sequential animal model study” (CSIR Sanction No. 27(0231)/10/EMR-II). The Raman spectrometer employed in the study was procured from DBT project BT/PRI11282/MED/32/83/2008 (Development of in vivo laser Raman spectroscopy methods for diagnosis of oral precancerous and cancerous conditions), Department of Biotechnology, Government of India.
Declaration of Conflicting Interests
The author(s) declared no potential conflicts of interest with respect to the research, authorship, and/or publication of this article.
Funding
The author(s) received no financial support for the research, authorship, and/or publication of this article.