
Abstract
In vivo dosimetry is recommended in intraoperative electron radiotherapy (IOERT). To perform real-time treatment monitoring, action levels (ALs) have to be calculated. Empirical approaches based on observation of samples have been reported previously, however, our aim is to present a predictive model for calculating ALs and to verify their validity with our experimental data. We considered the range of absorbed doses delivered to our detector by means of the percentage depth dose for the electron beams used. Then, we calculated the absorbed dose histograms and convoluted them with detector responses to obtain probability density functions in order to find ALs as certain probability levels. Our in vivo dosimeters were reinforced TN-502RDM-H mobile metal-oxide-semiconductor field-effect transistors (MOSFETs). Our experimental data came from 30 measurements carried out in patients undergoing IOERT for rectal, breast, sarcoma, and pancreas cancers, among others. The prescribed dose to the tumor bed was 90%, and the maximum absorbed dose was 100%. The theoretical mean absorbed dose was 90.3% and the measured mean was 93.9%. Associated confidence intervals at P = .05 were 89.2% and 91.4% and 91.6% and 96.4%, respectively. With regard to individual comparisons between the model and the experiment, 37% of MOSFET measurements lay outside particular ranges defined by the derived ALs. Calculated confidence intervals at P = .05 ranged from 8.6% to 14.7%. The model can describe global results successfully but cannot match all the experimental data reported. In terms of accuracy, this suggests an eventual underestimation of tumor bed bleeding or detector alignment. In terms of precision, it will be necessary to reduce positioning uncertainties for a wide set of location and treatment postures, and more precise detectors will be required. Planning and imaging tools currently under development will play a fundamental role.
Introduction
In vivo dosimetry is recommended for end-to-end tests 1 and treatment verifications. 2 Miss-irradiation can have a greater impact on patients undergoing hypofractionated treatments, and therefore in vivo dosimetry is useful in these patients for better safety monitoring of their treatments. Intraoperative electron radiotherapy (IOERT), which is based on single-fraction irradiation, 3 is one such example, and therefore dedicated reports have advised that it be used in conjunction with in vivo dosimetry. 4
The use of a real-time in vivo procedure allows deviations from programmed irradiation to be detected, treatment stoppage, setup checking, fixing of the necessary elements, and the eventual compensation of the rest of the treatment so that the irradiation delivered matches that planned. Therefore, it is necessary to establish a threshold for these deviations or, in other words, to define action levels (ALs): levels that if not achieved or if surpassed trigger the previously mentioned checking, fixing, and compensation protocol.
Several useful, empirical approaches have been adopted 5,6 based on a sample of measurements compared with the single assessments of the expected absorbed doses delivered to the in vivo dosimeter representative of the tumor bed. However, given the difficulty in assigning a unique absorbed dose to a tumor bed with certain precision, 7 it is more descriptive to create a simple theoretical model to predict expected measurements to which ALs can be applied, taking into account that a full range of absorbed doses is likely to be delivered to the in vivo detector as a consequence of its setup and its irradiation with a single electron beam. To our knowledge, this approach has not yet been reported in the literature.
Thus, our aim is to present a proposal for a model that calculates ALs and compare it with our experimental data to test for the dosimetry accuracy and precision needs of the IOERT. With respect to these in vivo experimental data, measurements were performed in a series of sequentially recruited indicated patients, including a complete set of tumor locations, without focusing on any particular one, which contrasts with the previous work involving breast and pancreatic cancers. 5,6 Moreover, patients were treated using a general purpose linac instead of a mobile unit. Earlier, we describe a generalized overview of in vivo dosimetry procedures documented in the literature, which we have extended by adding types of cases that have so far not been published: elements which also contribute novel experimental findings to a technique that is currently under more intense review by experts. 3,8,9
Materials and Methods
Detectors and Setup
The in vivo dosimeters of choice for real-time monitoring were reinforced TN-502RDM-H mobile metal-oxide-semiconductor field-effect transistors (MOSFETs; Best Medical Canada Ltd, Ontario, Canada). They were calibrated by us in their vendor’s calibration jig in terms of absorbed dose to water by means of routine dosimetric equipment following IAEA’s TRS-398 protocol. 10 Calibration involved representative IOERT prescribed doses to obtain a linear relationship with the gate voltage differences readouts of the MOSFETs. A thorough description of detector features has been reported previously. 11 An Elekta Precise linac (Elekta AB, Stockholm, Sweden) was used for both calibrations and treatments. The MOSFETs were inserted into sterile bronchus catheters that were attached to the surgical bed (or tumor in nonremovable cases) to avoid their movement. After the readout, they were cleaned and stored for reuse until their exhaustion.
Measurements were redundantly verified by placing radiochromic film next to the MOSFETs (Figure 1). Gafchromic MD-55-2 film (International Specialty Products, New Jersey) was used, and 1.5 × 1.5 cm pieces were digitized, packed between two 2 × 2 cm pieces of transparent polyester film, and sterilized by means of gas plasma. After the irradiation, enveloping materials were removed and the film was sterilized again to ensure safe processing. Calibration used a third-order polynomial relationship between absorbed dose and digitized red channel pixel value readout with preirradiation background correction. 12

In vivo dosimeter setup ready before the treatment.
Dosimetric uncertainties were considered, assessed, and added in quadrature as indicated by metrological reports for both dosimeters. 13 In the case of MOSFETs, we considered the uncertainty associated with the differences in detector voltage readouts and their reproducibility. In the case of films, we accounted for the uncertainty derived from the calibration curve and the reproducibility of film dyeing. In both cases, we also considered the uncertainty in absorbed dose determination, 10 the one obtained when water is substituted with plastic water (Plastic Water The Original; CIRS, Norfolk, Virginia) when arranging the detectors for calibration, and the uncertainty associated with the lack of linearity in the linac output.
Calculation of the Range of Absorbed Doses Delivered to the In Vivo Dosimeter
Because the MOSFETs were attached to the center of the tumor bed, only an in-depth absorbed dose distribution was considered, which was obtained by means of percentage depth dose (PDD) curves produced by the electron beams used to perform the IOERT treatments. It was assumed, as assessed by radiation oncologist, that the dosimeters were positioned to a depth within the first 5 mm because of positioning uncertainty and eventual bleeding that covered the surface. When a 5-mm bolus was used, the selected portion of the PPD curve was the next 5 mm. With this assumption, it was possible to evaluate the probability density function (PDF) of the absorbed dose delivered to the MOSFETs by calculating the histogram of absorbed doses for the selected PDD region. The 5 PDD points (from 0 to 5 mm) were fitted to a quadratic function that was sampled with 100 points in order to obtain sufficient data to plot the histogram.
Afterward, we considered the dosimeter response that was assumed to be Gaussian (see last subsection to recall sources of uncertainty and results section for values). Both distributions were combined by means of convolution 13 to obtain the final PDF of measurement. This was done for 26 different irradiation parameter combinations, reported in the next section, by means of a numerical calculation with an in-house program made with MATLAB (The MathWorks, Massachusetts). The ALs were then obtained by taking the levels that encompassed different desired probabilities from the derived PDFs. For example, the accumulated probability that ranges from 2.5% to 97.5% comprised the probability of having the 95% of the possible absorbed delivered doses. That is, if a detector measurement lies outside the interval associated with the mentioned accumulated probabilities, it is unlikely to belong to this distribution (with a confidence level not exceeding 5%, formally written as P < .05).
Experimental Data and Analysis
We considered all patients indicated for IOERT with an MOSFET measurement and radiochromic film verification, regardless of tumor location, and did not use any preselection inclusion criteria. Despite difficulties caused by some bleeding surgical beds, deep or difficult to access sites, or inclined surfaces, no measurement was excluded unless the detector had moved during applicator setup. However, 4 patients were discarded, 2 because of detector overdosage caused by backscatter near the lead protection 14 during rectum treatment and 2 more because of detector underdosage less than 3 times the standard deviation of the sample.
The final sample included 30 measurements representing the absorbed dose delivered to the tumor bed of 29 patients (1 was also treated with a boost using a smaller applicator) involving 26 different combinations of applicator diameter, energy, bevel angle, and the absence or presence of a 5-mm bolus. Treatment locations involved 18 primary tumors, 7 rectal tumors, 7 sarcomas (2 scapular, 1 axillar, 1 in the abdominal wall, 1 in psoas muscle, 1 affecting an upper limb, and 1 affecting a lower limb), 2 breast cancers, 1 lower limb skin tumor and 1 pancreatic tumor, and 11 relapses (5 presacral, 2 in lower limb sarcomas, 1 nerve tumor, 1 gastric, 1 pancreatic, and 1 retroperitoneal). Table 1 summarizes their irradiation parameters.
Beam parameters, confidence intervals, measured absorbed doses, and comparison with theoretical absorbed doses.a

Abbreviation: ALs, action levels; IOERT, intraoperative electron radiotherapy; MOSFETs, metal-oxide-semiconductor field-effect transistors; PDD, percentage depth dose.
aApplicator diameter in cm, energy of the beam is in MeV, bevel angle is in degrees, and presence of a 5 mm bolus is indicated for each treatment. These values are followed by the mean of the theoretical PDD portion considered, the lower and upper AL limit, the confidence interval width (P = .05), and the measured absorbed dose by the MOSFET (DMOSFET) expressed as a percentage so that 100% is the maximum absorbed dose delivered by the electron beam. The final column summarizes the result of the comparison between the DMOSFET and the confidence interval limited by the ALs.
To compare all these data, they were normalized so that the theoretical maximum absorbed dose of any particular electron beam used was 100%, that is, the maximum PDD value. With this convention, the prescribed dose was always 90%, and the corresponding measured absorbed dose was recorded according to this scale. Afterward, we calculated the theoretical mean of the whole IOERT procedure as the mean of all the calculated means for every combination of applicator, energy, and bevel used and the experimental mean of the whole in vivo IOERT procedure as the mean of all the collected measurements made with MOSFETs. A normality test was then performed on both the theoretical and the experimental data sets, and subsequently, the Wilcoxon signed rank test for comparison of means coming from nonnormal samples was conducted. The bootstrap technique was used to overcome the nonnormality of the data when calculating the confidence levels of both the distributions. 15
Results
Ninety percent of the absorbed dose sample measurements taken with the MOSFETs had a combined uncertainty of up to 2% at the 1 standard deviation level (the maximum was 2.2%). Therefore, a 2% standard deviation was used for Gaussian-modeling detector response convolution. In addition, the MOSFET responses, as determined with calibration data, were normal (Kolmogorov-Smirnov test, P >.131) except for at 18 MeV (Kolmogorov-Smirnov test, P = .000), which was not used in any treatment. Ninety percent of the film measurements had an uncertainty of 2.6% (with a maximum of 2.7%). With respect to uncertainty components, it is of note that there was a variation in film dyeing variability of as much as 2.4%. Dose determination was assumed to vary by 1.1%, 10 linac lack of linearity was evaluated to be approximately 0.2%, and the use of plastic water added an additional uncertainty between 0.2% and 1.1%.
Three characteristic PDFs are depicted in Figure 2:, When the PDD histogram is almost rectangular, the PDF has a widened Gaussian distribution (Figure 2a), whereas when the PDD histogram has a wide rectangular distribution, the PDF has a rectangular distribution with softened edges (Figure 2b). Finally, if the PDD histogram is asymmetric, the PDF results are also asymmetric (Figure 2c).

Graphic representation of the calculation steps used to find the probability density function (PDF) of absorbed doses measured by the metal-oxide-semiconductor field-effect transistors (MOSFETs) and their corresponding action levels (ALs). Each subfigure contains the irradiation parameters as a header and the initial portion of percentage depth dose (PDD) appears below. The central part of the subfigure contains the calculated histogram of absorbed doses delivered to the MOSFET, according to the corresponding portion of the PDD, 1 the Gaussian response of the MOSFET, 2 and the calculated final probability density function. 3 The confidence intervals are shown at the bottom.
All confidence intervals limited by the ALs at P = .05, as well as the mean theoretical expected values and MOSFET measurements and the corresponding MOSFET measurements, are shown in Table 1. Histograms of both the theoretical and the experimental values are depicted in Figure 3.
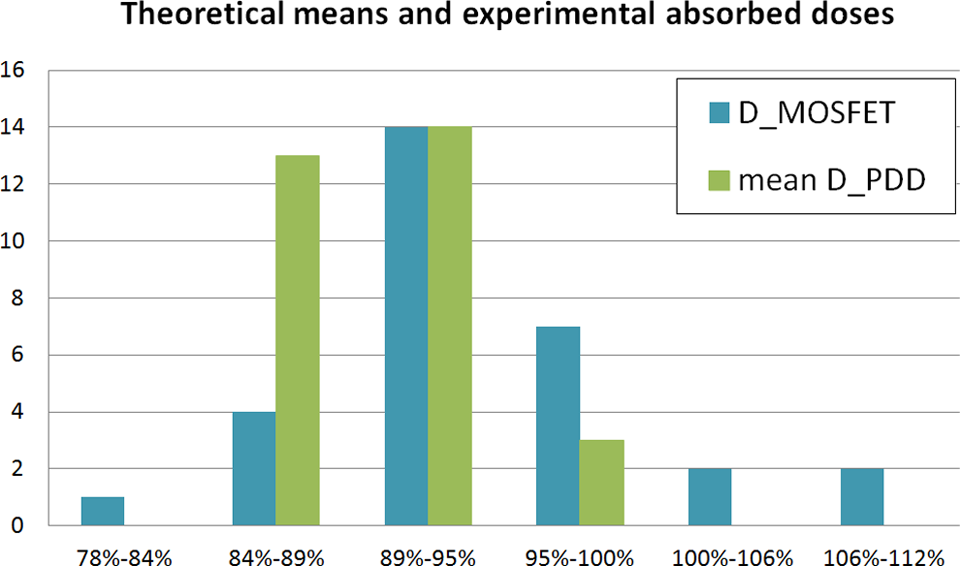
Histograms of means of the percentage depth dose (PDD) portions considered (mean D_PDD) and measured absorbed doses by the metal-oxide-semiconductor field-effect transistors (MOSFETs; D_MOSFET), all expressed as percentages, for the 30 treatments.
The theoretical mean of the whole IOERT procedure was 90.3%, whereas the mean of the in vivo data was 93.9%. As shown in Figure 3, neither sample was normally distributed (Kolmogorov-Smirnov test, P = .010 and .009, respectively), so the Wilcoxon signed-rank test was applied to determine that they were significantly shifted (P = .023). Confidence intervals of both distributions at a 95% confidence level were limited by 89.2% and 91.4% and 91.6% and 96.4%, respectively. These data are shown in Figure 4, and the intervals do not overlap.

Scatter plot depicting the means of the percentage depth dose (PDD) portions considered (mean D_PDD) and the measured absorbed doses by metal-oxide-semiconductor field-effect transistors (MOSFET; D_MOSFET), all expressed as percentages, for the 30 treatments. The mean of both samples and their confidence levels at P = .05 are represented by horizontal lines (pointed lines and solid lines, respectively).
Discussion
Films are not the focus of this study because they need off-line processing and do not allow real-time monitoring. However, the films have been a useful approach for the study of in vivo dosimetry in IOERT, 16,17 and for this reason, we decided to use them to verify the technique as a whole. The distribution of absorbed doses measured by films had a mean of 97.9% ± 3.6%, with a confidence level of 95%. This distribution was compatible with the MOSFET measurements (the Wilcoxon signed rank test was not significant, P = .112). Film was sterilized for safe handling, which has not been shown to impede verification but it may affect accuracy 18 which is why we did not compare film measurements directly to theoretical results.
Convolution has been used to assess the ability of dosimeters to measure the initial distribution of a magnitude of interest, taking into account the detector response and assuming it has a Gaussian distribution. 19 –23 Because the probability distribution associated with PDD is asymmetric, in general, the final PDF of the delivered absorbed dose is also asymmetric. Therefore, the mean values for every combination of these irradiation parameters were not generally centered into confidence intervals limited by the ALs. This is especially remarkable for 4-MeV beams where PDD increases up to the zone with no slope (Figure 2c). The widths of the calculated confidence intervals at P = .05 range from 8.6% to 14.7%, which match the proposed ALs of ±7% 5 and ±6% 6 reasonably well.
The fact that the mean of the MOSFET measurements was 93.9% shows that the overall objective of delivering an absorbed dose equal to or greater than the 90% prescribed dose was achieved, so in vivo dosimetry satisfies verification purposes at a wide set of locations. 24 However, the statistically significant difference found with respect to the 90.3% theoretical value and the fact that 27% of the MOSFET data surpassed the upper ALs derived from our model, despite 63% of them lying within the calculated ALs, may indicate the presence of either of the 2 difficult to quantify elements: the patient had more blood than expected which causes a higher absorbed dose delivered to the detector because of build up and/or the beam had an uncontrolled obliquity with respect to the detector, which pushed the maximum dose up and stretched the therapeutic PDD zone. 25
Perhaps the consequences of the former problem could be partially alleviated if the medical physicist advises the radiation oncologist to leave a few extra millimeters of posterior margin when treating the tumor bed, whereas the latter requires proper detector and tumor bed localization and imaging tool evaluation. Despite these discrepancies, in our opinion, the model is still of interest because it accounts for beam and detector features together and can be still tested to obtain precise measurements and online monitoring in flat surfaces.
With respect to the calculation of confidence levels without the aid of numerical tools, we would like to remind readers that if a sufficient number (n) of cases with the same irradiation parameters could have been gathered, then experimental ALs could have been obtained for that setup as
Justification of Planning Tools
The IOERT treatments are affected by obliquity, relief, and tumor bed bleeding. Even experienced users who mostly treat breast cancers experience a large amount of variability with in vivo dosimetry results and have therefore tried to develop treatment optimization tools. 7
These factors, for which our set of discrepant data can be considered illustrative, prove the need for better investigation and development of planning and imaging tools. 7,8,26 –31 When we are able to accurately calculate dosimetric values and place in vivo dosimeters in the tumor bed with precision, we will be able to derive ALs simply from the quadratic sum of the calculation and detector uncertainty. It could be shown that the higher the number of patients irradiated with the same parameters, the more this sum will approach the calculation uncertainty of future treatment planning systems. In addition, more precise in vivo dosimeters should be demanded from manufacturers by researchers and institutions.
Conclusion
We have presented a theoretical model based on electron PDD curves for calculating ALs for in vivo dosimetry in IOERT. The model can describe global results successfully but cannot match all the experimental data reported. In terms of accuracy, this suggests an eventual underestimation of tumor bed bleeding that happens frequently and problems in ensuring the intended MOSFET alignment for some tumor bed areas within the beam. In terms of precision, future work must aim to reduce positioning uncertainties for a wide set of locations and treatment postures as well as developing more precise detectors. Therefore, planning and imaging tools under development will play a fundamental role in achieving individual real-time treatment monitoring in patients undergoing IOERT.
Footnotes
Acknowledgments
Authors acknowledge the dedication of Dr Irene Torres, José Ramón Rodríguez, Noelia de Marco, Jorge Bonaque, Laura Vidueira, Miguel Guasp, and Naika Luquero in acquiring some of the experimental data presented and the commitment of our collaborative surgeons in the completion of this investigation.
Declaration of Conflicting Interests
The author(s) declared no potential conflicts of interest with respect to the research, authorship, and/or publication of this article.
Funding
The author(s) disclosed receipt of the following financial support for the research, authorship, and/or publication of this article: This work was supported by grants IPT-300000-2010-3 and PI11/01659 from the Spanish Government and ERDF funds.