
Abstract
Fascin is overexpressed in various tumor tissues and is closely related to tumor metastasis and invasion. However, the role of fascin in cholangiocarcinoma RBE cells has not been clearly reported. This study aimed to establish a cholangiocarcinoma cell line with stable and high expression of fascin to observe the effect of fascin on cell proliferation, migration, and invasion. A fascin overexpression vector, pcDNA3.1-Fascin, was constructed and transfected into the human cholangiocarcinoma RBE cell line. The results of real-time polymerase chain reaction, Western blot, and immunofluorescence indicated that fascin was steadily and highly expressed in RBE cells. The results of 3-[4,5-dimethylthiazol-2-yl]-2,5-diphenyltetrazolium bromide and colony formation assay indicated that upregulated fascin expression could enhance cholangiocarcinoma cell proliferation. The results of wound healing assay and transwell assay indicated that fascin could promote cholangiocarcinoma cell migration and invasion, and a further study found that the nuclear factor-κB signaling pathway was activated after upregulation of fascin, whereas E-cadherin expression in these cells was significantly decreased. Additionally, E-cadherin expression was significantly increased after inhibiting nuclear factor-κB activity using inhibitor or small interfering RNA, and E-cadherin expression was decreased by fascin overexpression after nuclear factor-κB inhibition, suggesting that nuclear factor-κB signaling pathway was not involved in the regulation of E-cadherin by fascin. In summary, the results of this study demonstrated that fascin effectively promoted cholangiocarcinoma RBE cell proliferation, migration, and invasion. This study provides evidence for fascin as a potential target in the treatment of cholangiocarcinoma.
Introduction
As a type of malignant tumor originating in biliary epithelial cells, cholangiocarcinoma is one of the most common malignant tumor of the biliary tract, accounting for approximately 3% of all malignant tumors of the digestive tract. 1 The early-stage clinical manifestations of cholangiocarcinoma are not obvious. When typical clinical symptoms occur in a patient, the disease has usually developed to the middle-to-late stage, and the opportunity for complete resection of the tumor has been missed. Cholangiocarcinoma is not sensitive to radiotherapy or to chemotherapy, and its surgical resection rate is low, with a low postoperative mortality. 2 In addition, cholangiocarcinoma can easily invade the lymph nodes or other organs 3 –6 that correlates with poor prognosis. Therefore, studying the related mechanisms of cholangiocarcinoma invasion and metastasis has important practical and clinical significance for the development of new and more effective treatments to reduce mortality in patients with cholangiocarcinoma.
Fascin is a cytoskeletal protein that was first found in the cytoplasm of sea urchin oocytes. This protein is named fascin because of its ability to bind to F-actin and form stable bundles. 7,8 In studies of clinical specimens, fascin expression is usually absent or low in normal epithelial tissue but is often highly elevated in some malignant epithelial tumors, such as gastric cancer, 9 breast cancer, 10 esophageal cancer, 11 colon cancer, 12 and skin cancer. 13 In vitro studies have found that fascin overexpression can promote esophageal squamous cell carcinoma cell proliferation. 14 RNA interference-mediated downregulation of fascin in human esophageal cancer cell line EC109 effectively suppresses cell proliferation and invasion. 15 Previous studies have demonstrated that fascin is overexpressed in cholangiocarcinoma. 16 Furthermore, fascin is also closely associated with tumor cell invasion and metastasis in various types of tumors, 17,18 including cholangiocarcinoma. 16 Its overexpression is correlated with aggressive tumor phenotypes and poor survival. 19 However, the roles of fascin in cholangiocarcinoma RBE cell proliferation, migration, invasion in vitro, and the related mechanism remain unclear.
In this study, a recombinant plasmid overexpressing fascin was constructed, and a cholangiocarcinoma cell line with stable fascin overexpression was obtained by screening to investigate the effects of fascin on cholangiocarcinoma cell proliferation, migration, and invasion. The results indicated that fascin can promote cholangiocarcinoma RBE cell proliferation, migration, and invasion.
Materials and Methods
Cell Line
The human cholangiocarcinoma RBE cell line was purchased from Shanghai Institute of Life Sciences, Chinese Academy of Science (Shanghai, China). The cells were cultured with Dulbecco modified Eagle medium (DMEM; Gibco, Grand Island, New York) containing 10% fetal bovine serum (FBS; HyClone, Logan, Utah) in an incubator with 5% CO2 at 37°C. When they reached 90% confluence, the cells were trypsinized with 0.25% trypsin.
Constructing the Vector for Fascin Overexpression and Screening for the Cholangiocarcinoma Cell Line With Stable Transfection
The following primers were designed to amplify the coding region of fascin: F: 5′-CGGC
Western Blot
The total proteins, nuclear proteins, and cytoplasmic proteins were extracted from the cells in each group using a protein extraction kit (Beyotime Institute of Biotechnology, Haimen, China). Then, the protein concentrations were determined using a bicinchoninic acid (BCA) protein concentration kit (Beyotime Institute of Biotechnology). After sodium dodecyl sulfate-polyacrylamide gel electrophoresis (SDS-PAGE) was performed with 40 μg of protein from each sample, the separated proteins were transferred onto a polyvinylidene fluoride (Millipore, Bedford, Massachusetts) membrane using a semi-dry transfer apparatus (DYCZ-40D; Beijing Liuyi Biotechnology Co Ltd, Beijing, China). Then, the membrane was incubated with diluted primary antibodies (fascin, 1:200 dilution, purchased from Boster, Wuhan, China; proliferating cell nuclear antigen [PCNA], 1:200 dilution, matrix metalloproteinase [MMP] 2, 1:200 dilution, MMP-9, 1:200 dilution, nuclear factor-κB [NF-κB] p65, 1:200 dilution, and E-cadherin, 1:200 dilution, purchased from Wanleibio, Shenyang, China; p-IκB, 1:100 dilution, purchased from Bioss, Beijing, China) at 4°C overnight. The secondary antibody goat antirabbit immunoglobulin G-horseradish peroxidase (1:5000 dilution, Beyotime Institute of Biotechnology) was added, followed by a 45-minute incubation at 37°C. Finally, enhanced chemiluminescent agent (Wanleibio) was added and developed in the dark. The film was scanned, and the optical density values of the target bands were analyzed using a gel image processing system with Gel-Pro Analyzer software (Bethesda, Maryland). Each experiment was performed in triplicate. Lamin A served as the internal control for nuclear protein, whereas β-actin served as the internal control for cytoplasmic protein and total protein.
Real-Time Polymerase Chain Reaction
Total RNA from each group of cells was extracted using a total RNA extraction kit (TIANGEN Biotech, Beijing, China) according to the manufacturer’s instructions. cDNA was obtained by reverse transcription. Fluorescence quantitative analysis was performed on an Exicycler 96 fluorescence quantitative analyzer (Bioneer, Daejeon, Korea) using a SYBR Green Master Mix (Solarbio, Beijing, China). The cycling conditions were as follows: 1 cycle of 95°C for 10 min, followed by 40 cycles of 95°C for 10 s, 60°C for 20 s, and 72°C for 30 s. Polymerase chain reaction (PCR) amplifications were performed in 3 independent biological replicates for each sample to check the reproducibility of the data. β-actin was used as an internal control. The 2-ΔΔCt method 20 was used for relative quantification of gene expression and to determine the messenger RNA (mRNA) levels of fascin, MMP-2, MMP-9, or E-cadherin. The corresponding primers are listed in Table 1.
Sequences of the Primers for Real-Time PCR.

Abbreviations: PCR, polymerase chain reaction; MMP, matrix metalloproteinase.
Immunofluorescence Staining
The cells (1 × 10⁵ cells/coverslip) in each group were seeded on a coverslip and cultured for 24 hours. Then, the cells were fixed with 4% paraformaldehyde for 15 minutes and treated with 0.1% Triton X-100 for 30 minutes. The fascin (1:100 dilution, Boster) and E-cadherin antibodies (1:100 dilution, Wanleibio) were added, followed by incubation at 4°C overnight. Then, Cy3-labeled goat anti-rabbit secondary antibody (1:200 dilution, Beyotime Institute of Biotechnology) was added. After incubation at room temperature for 1 hour, 4′,6-diamidino-2-phenylindole (DAPI) was added dropwise to completely cover the cells for nuclei staining. The coverslip with cells was inversely placed and mounted on a slide with antifluorescence quenching agent (Solarbio). All experiments were conducted in triplicate. The staining results were observed and photographed under a 400× inverted fluorescence microscope (IX51; Olympus, Tokyo, Japan).
Detection of Cell Proliferation by 3-[4,5-Dimethylthiazol-2-yl]-2,5-diphenyltetrazolium bromide Assay
The cells were seeded in 96-well plates at a density of 2 × 10³ cells/well and placed in an incubator with 5% CO2 at 37°C. Five duplicated wells were prepared for each group. Then, 3-[4,5-dimethylthiazol-2-yl]-2,5-diphenyltetrazolium bromide (MTT) solution (final concentration of 0.2 mg/mL; Sigma-Aldrich, St. Louis, Missouri) was added at 12, 24, 48, 72, and 96 hours, followed by incubation at 37°C for 4 hours. After the supernatant was carefully aspirated, 200 μL of dimethyl sulfoxide (Sigma-Aldrich) was added to dissolve the purple crystals that formed in the cells. The optical density values at 490 nm were measured using a microplate reader (ELX-800; Bio-Tek Instruments Inc, Winosski, Vermont), and the cell growth curve was plotted.
Colony Formation Assay
The cells were seeded in 35-mm Petri dishes, with approximately 200 cells per dish. The dishes were cultured in an incubator at 37°C and 5% CO2. After visible clones were formed, 4% paraformaldehyde was used for fixation, followed by staining with Wright-Giemsa compound staining fluid for 5 to 8 minutes. Using microscopic observation, cell clusters containing ≥50 cells were considered a colony, and the colony formation rate was calculated according to the following formula: (number of colonies/number of seeded cells) × 100%. The experiment was performed 5 times.
Wound Healing Assay
The cells in each group were seeded in 6-well plates, and the wound healing assay was performed when the cells grew to 80% to 90% confluence. After the cell culture medium was discarded, a scratch was vertically created on the surface of a single layer of cells using the tip of a 200-μL pipette, and the cells were washed twice with serum-free culture medium. The cells were continuously cultured with serum-free DMEM. Images were captured under a 100× inverted microscope (AE31; Motic Electric, Xiamen, China). The experiment was performed 3 times. The migration distances of the cells were measured at 12 and 24 hours, and the cells migration rate was calculated using the following formula: (1 − the distance following healing/the distance prior to healing) × 100%.
Transwell Assay
The cell invasion assay was performed using the Transwell chamber (Corning Incorporated Life Sciences, Tewksbury, Massachusetts) coated with Matrigel gel (BD Biosciences, San Jose, California). In brief, cells in each group were collected and resuspended in serum-free cell culture medium, and seeded in the upper Transwell chamber at a density of 2 × 10⁴/well. The DMEM culture medium containing 20% fetal bovine serum (800 μL) was added to the lower chamber. The chambers were then placed in a cell culture incubator. After 24 hours, the uninvaded cells on the microporous membrane were wiped with a cotton swab, whereas the invaded cells were fixed with paraformaldehyde and stained with Crystal violet. The number of invaded cells was counted and photographed under a 200× inverted microscope (AE31; Motic Electric). The experiment was performed 5 times. Five fields were selected for each sample, and the mean value was calculated.
Zymograph
Protein concentration in conditioned medium was determined using BCA method (Beyotime Institute of Biotechnology) and subjected to 10% SDS-PAGE. After electrophoresis, the gel was washed twice for 40 minutes with 2.5% triton X-100 (v: v) to remove SDS and then incubated at 37°C for 40 hours with 50 mmol/L Tris-HCl, 5 mmol/L CaCl2, 1 μmol/L ZnCl2, 0.02% Brij, and 200 mmol/L NaCl. The gel was subsequently stained with 0.05% (w/v) Coomassie Brilliant Blue R-250 (AMRESCO, Ohio) for 3 hours and destained with destaining buffer (methanol and glacial acetic acid). All zymography experiments were repeated in triplicate.
Downregulated NF-κB p65 Expression Using NF-κB p65 small interfering RNA (siRNA) or NF-κB p65 inhibitor BAY11-7082
The NF-κB p65 siRNA and control siRNA were purchased from GenePharma (Shanghai, China). The sequences for these constructs were as follows: NF-κB p65 siRNA: 5′-AGAGGACATTGAGGT GTAT-3′; control siRNA: 5′-TTCTCCGAACGTGTCACGT-3′. Lipofectamine 2000 (Invitrogen) reagent was used for cell transfection according to the manufacturer’s instructions. At 24 hours post-transfection, cells were harvested for further analyses.
The cells from each group were collected and seeded in T25 culture flasks at a density of 5 × 10⁵/mL. After preincubation with BAY11-7082 (final concentration of 3 μmol/L, Beyotime Institute of Biotechnology) for 24 hours, proteins of the cells were extracted and analyzed for E-cadherin expression.
Statistical Analysis
The data are presented as the mean ± standard deviation. The comparisons were performed using 1-way analysis of variance followed by Bonferroni post hoc test. Graphpad Prism 5.0 software (GraphPad Software, Inc., San Diego, California) was utilized for data and image processing. Differences with P < .05 were considered statistically significant.
Results
Establishment and Identification of a Cholangiocarcinoma RBE Cell Line With Stable Fascin Overexpression
To study the function of the fascin gene, the recombinant plasmid pcDNA3.1-Fascin was transfected into RBE cells. Fascin expression in the positive cells obtained by G418 screening was analyzed by Western blot and real-time PCR methods, and the parental cells and pcDNA3.1 transfected cells served as the controls. The results indicated that the protein and mRNA levels of fascin in the fascin transfection group were 3.32 times (Figure 1A, P < .01) and 3.38 times (Figure 1B, P < .01), respectively, higher than those in the pcDNA3.1 transfection group. Immunofluorescence staining indicated that fascin protein levels in the fascin transfection group were significantly higher than that in the other 2 groups (Figure 1C). Fascin was overexpressed in the cytoplasm of cholangiocarcinoma cells, which was similar to the localization of endogenous fascin. 21 In summary, we obtained a cholangiocarcinoma RBE cell line with stable fascin overexpression.

Establishment of the cell line with stable fascin overexpression. A, Fascin protein expression was detected by Western blot with grayscale analysis using β-actin as an internal control. B, Fascin mRNA expression was detected by real-time PCR. β-Actin was used as an internal control. C, Expression of fascin was detected by immunofluorescence. Fluorescence microscopy images showed that fascin protein was significantly upregulated in the cells of fascin group (red), with the nuclei stained in blue. Scale bars 20 μm. Representative results of the repeated experiments are shown in this figure. The data are presented as the mean ± standard deviation. Compared with the pcDNA3.1 transfection group, ** indicates P < .01. Compared with the parental group, ## indicates P < .01. mRNA indicates messenger RNA; PCR, polymerase chain reaction; cDNA, complementary DNA.
Fascin Overexpression Promoted Cholangiocarcinoma RBE Cell Proliferation
To investigate the effect of fascin on cholangiocarcinoma cell proliferation, cell proliferation was detected by MTT assay and a cell growth curve was obtained. The results indicated that the cell proliferation rate in the pcDNA3.1-Fascin group was significantly higher beginning at 48 hours after cell seeding compared to that in the pcDNA3.1 group (Figure 2A; 48 and 96 hours, P < .01; 72 hours, P < .05) and the parental group (48, 72, and 96 hours, P < .05). Correspondingly, the expression level of the PCNA protein in the fascin group was also significantly higher than that in the pcDNA3.1 group and the parental group (Figure 2B, P < .01). Then, the colony formation assay was performed to detect the effect of fascin on the clonogenic capacity of the tumor cells. The results showed that the colony formation rate of the fascin transfected cells was 76.60% ± 7.72%, which was significantly higher than that of the pcDNA3.1 transfected cells (Figure 2C [56.40% ± 5.77%], P < .01) and the parental cells ([57.20% ± 5.70%], P < .01), indicating that fascin overexpression could significantly improve the clonogenic capacity of cholangiocarcinoma cells.
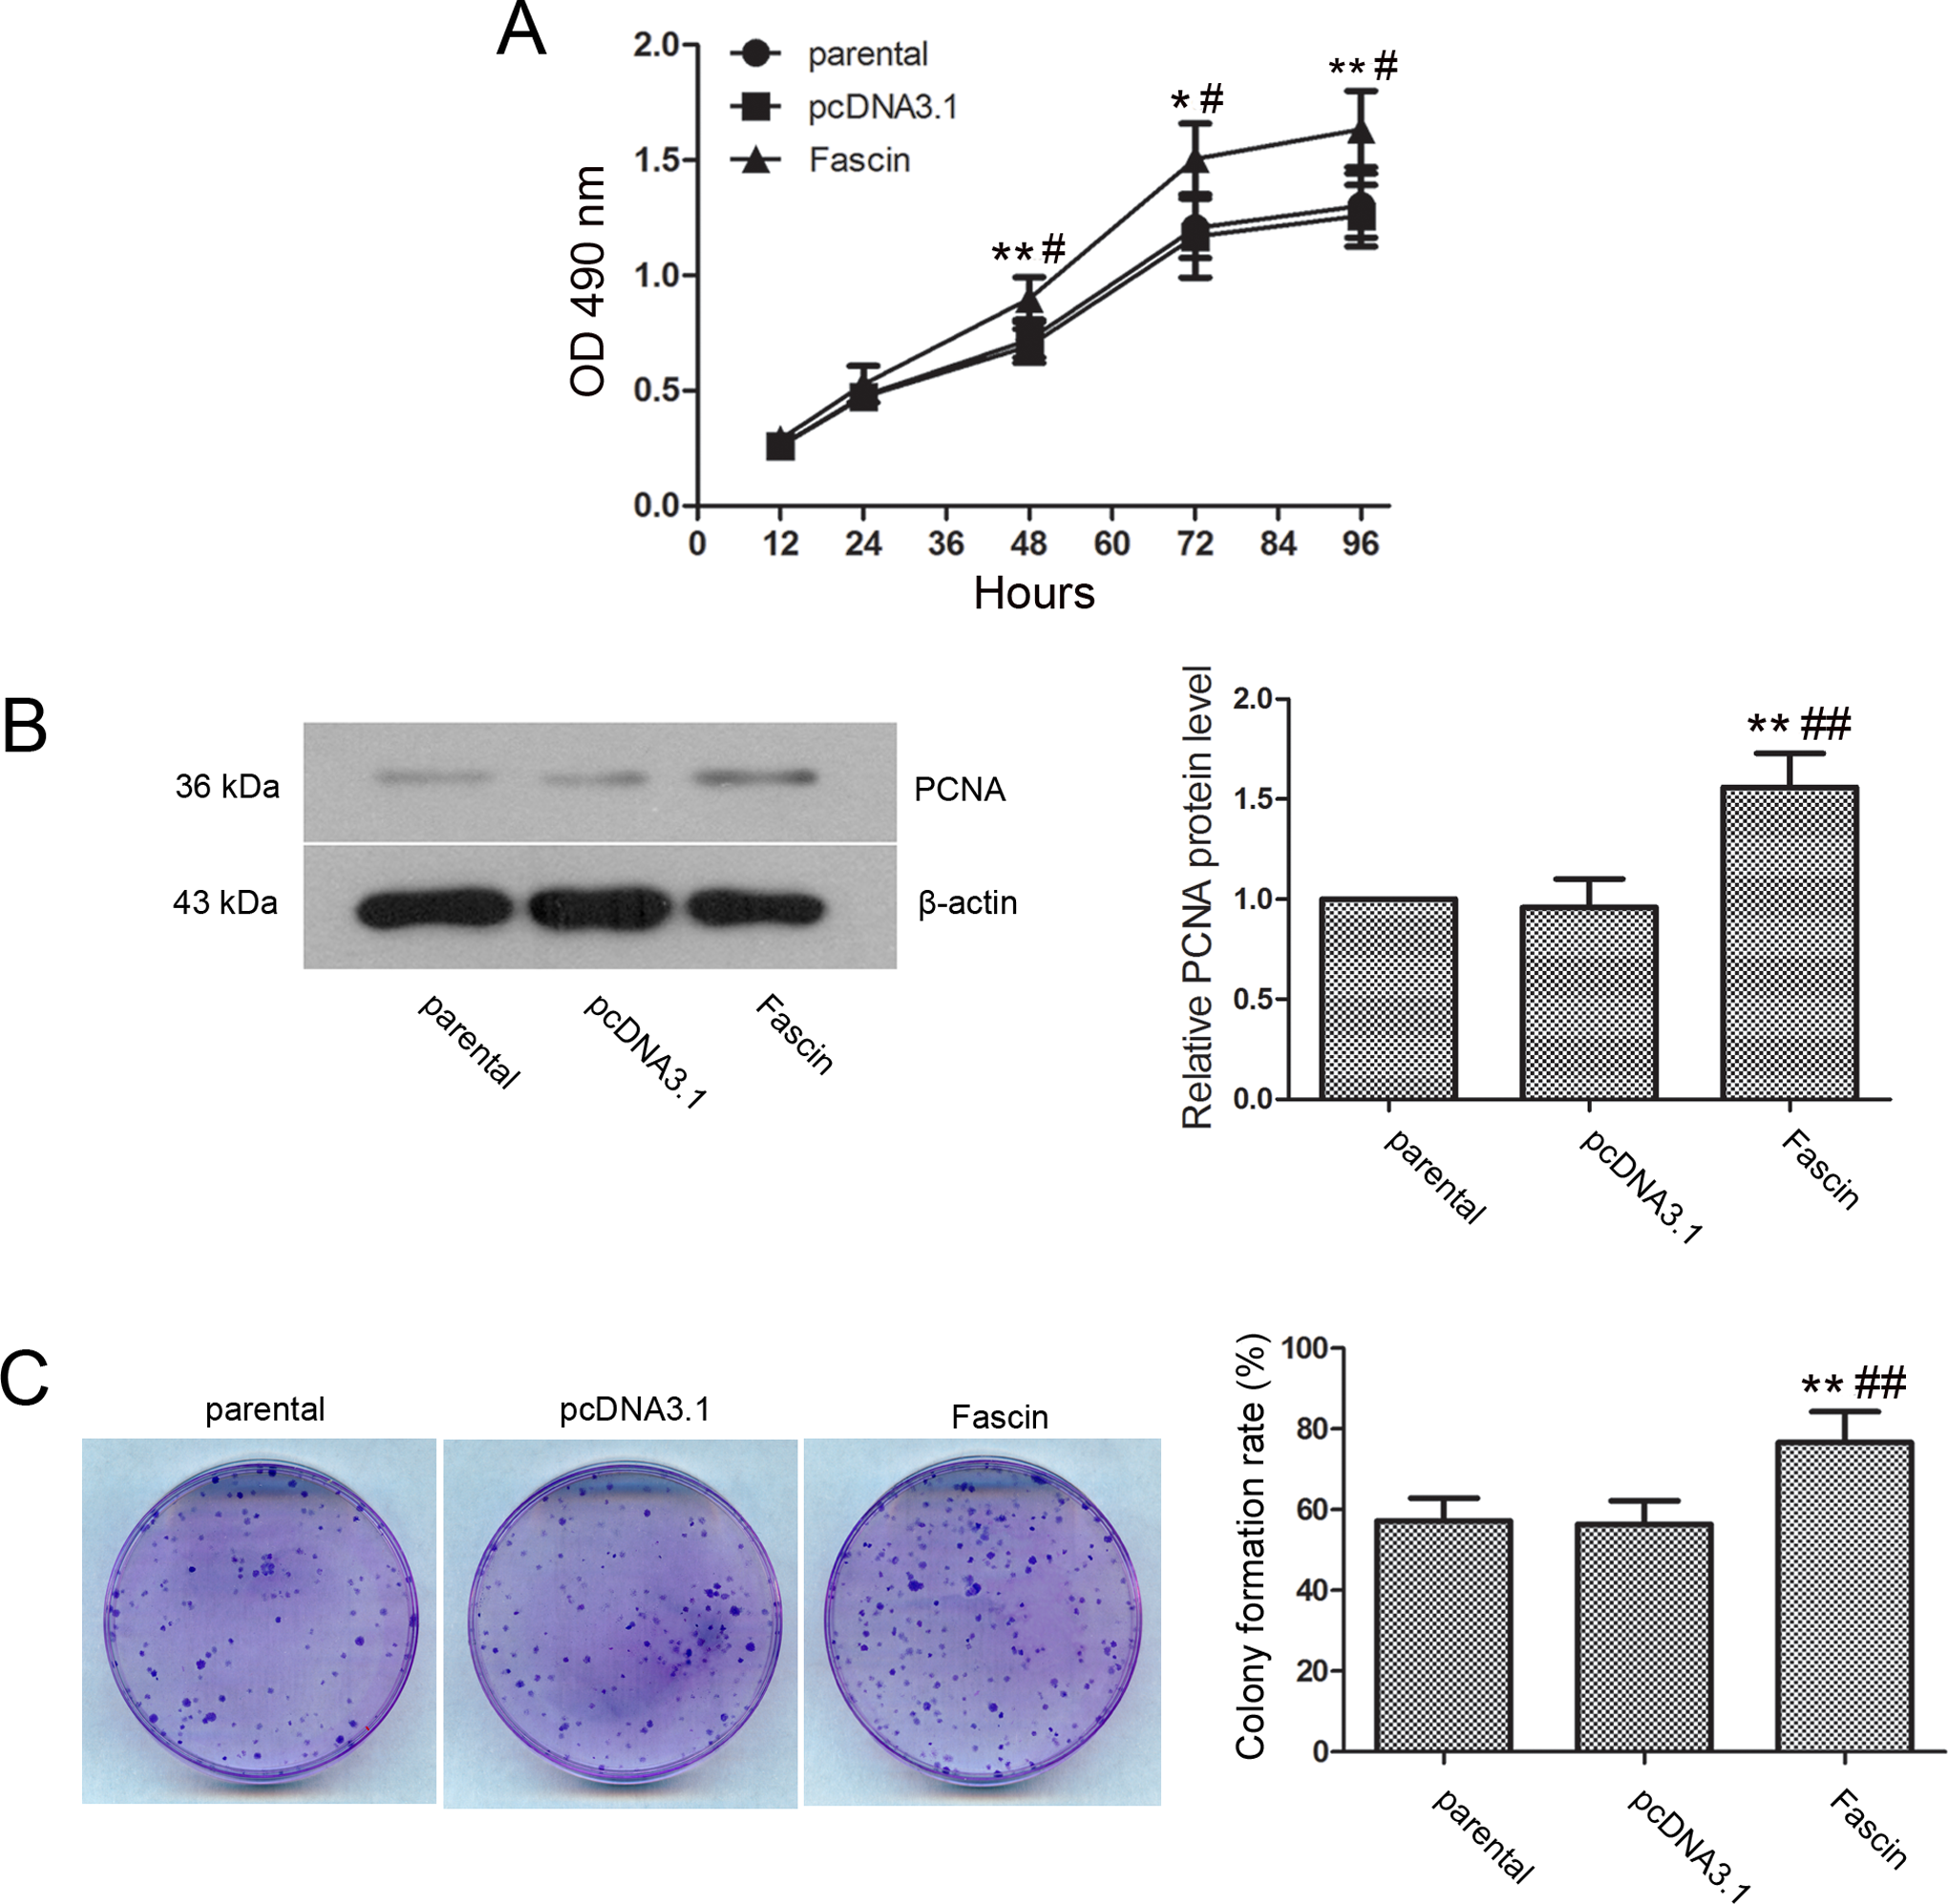
Fascin overexpression promoted cholangiocarcinoma RBE cell proliferation. A, Cell proliferation was detected by MTT assay. The cells were seeded in 96-well plates, with 5 duplicate wells for each condition. Absorbance at 490 nm was measured at 12, 24, 48, 72, and 96 hours after seeding, and the cell growth curve was obtained. B, PCNA protein expression was detected by Western blot. C, The clonogenic capacity of the cells was detected by colony formation assay. Approximately 200 cells from each group were seeded in a Petri dish. The cells were fixed and stained after 14 days, and the colony formation rate was calculated under a microscope. Typical results of the repeated experiments are shown. The data are presented as the mean ± standard deviation. Compared with the pcDNA3.1 transfection group, * indicates P < .05 and ** indicates P < .01. Compared with the parental group, # indicates P < .05 and ## indicates P < .01. MTT indicates 3-[4,5-dimethylthiazol-2-yl]-2,5-diphenyltetrazolium bromide; cDNA, complementary DNA.
Fascin Overexpression Promoted Cholangiocarcinoma RBE Cell Motility and Invasion
The effect of fascin on cholangiocarcinoma cell motility was determined by the wound healing assay, and the results indicated that the cell migration rates in the fascin group at 12 and 24 hours after the cell scratch was significantly higher than those in the pcDNA3.1 group and the parental group (Figure 3A, P < .01). The effect of fascin on cholangiocarcinoma cell invasion was further detected using the transwell assay, and the results indicated that the number of invaded cells in the fascin group, 89.60 ± 12.22 cells, was significantly higher than that in the pcDNA3.1 group (Figure 3B [46.40 ± 6.23] cells, P < .01) and the parental group ([47.20 ± 6.53] cells, P < .01). Correspondingly, the protein and mRNA expression levels of MMP-2 and MMP-9 were significantly increased in the fascin group (Figure 3C and D, P < .01). Fascin overexpression remarkably increased the activity of MMP-2 and MMP-9 (Figure 3E, P < .01).

Fascin overexpression promoted cholangiocarcinoma RBE cell motility and invasion. A, Cell migration capability of the cells in each group was measured by wound healing assay. The cells were seeded and cultured. When the cells grew to 80% to 90% confluence, a scratch was created. The migration distances of the cells were measured at 12 and 24 hours after scratching, and the cell migration rates were calculated. Scale bars 100 µm. B, Cell invasiveness was determined by transwell assay. The invaded cells were fixed after 24 hours and stained with crystal violet. The number of invaded cells was counted under a microscope. Scale bars 50 µm. C, MMP-2 and MMP-9 protein expression was detected by Western blot. D, MMP-2 and MMP-9 mRNA expression was detected by real-time PCR. E, Activities of MMP-2 and MMP-9 were measured using zymography. Representative results are shown. The data are presented as the mean ± standard deviation. Compared with the pcDNA3.1 transfection group, ** indicates P < .01. Compared with the parental group, ## indicates P < .01. MMP indicates matrix metalloproteinase; mRNA, messenger RNA; PCR, polymerase chain reaction; cDNA, complementary DNA.
Fascin Overexpression Inhibited E-Cadherin Expression in Cholangiocarcinoma RBE Cells
To explore whether E-cadherin was involved in regulating fascin-enhanced cholangiocarcinoma cell migration and invasion, E-cadherin mRNA and protein expression was detected in each group of cells using real-time PCR, immunofluorescence, and Western blot analyses. The results indicated that the E-cadherin mRNA expression level in the fascin group was significantly lower than that in the other 2 groups (Figure 4A, P < .01). The immunofluorescence results indicated that the fluorescence intensity of the fascin transfected cells was significantly lower than that of the pcDNA3.1 transfected cells and the parental cells (Figure 4B). E-cadherin protein level in the fascin group was significantly downregulated (Figure 4C, P < .01), which was consistent with the above-mentioned results.

Fascin overexpression inhibited E-cadherin expression in cholangiocarcinoma RBE cells. A, E-cadherin mRNA expression was detected in each group of cells by real-time PCR. B, E-cadherin was detected by immunofluorescence. Fluorescence microscopy showed that E-cadherin was highly expressed in the cells of parental group and the pcDNA3.1 group (red), and the nuclei were stained blue by DAPI. Scale bars 20 μm. C, E-cadherin protein expression levels were detected by Western blot, and β-actin served as an internal control for the grayscale analysis. The data are presented as the mean ± standard deviation. Compared with the pcDNA3.1 transfection group, ** indicates P < .01. Compared with the parental group, ## indicates P < .01. mRNA indicates messenger RNA; PCR, polymerase chain reaction; cDNA, complementary DNA; DAPI, 4′,6-diamidino-2-phenylindole.
The NF-κB Signaling Pathway was not Involved in E-Cadherin Regulation by Fascin in Cholangiocarcinoma RBE Cells
To investigate whether the NF-κB signaling pathway was involved in E-cadherin regulation by fascin, we examined NF-κB signaling pathway activation. The results indicated that the levels of cytoplasmic p-IκB and nuclear NF-κB p65 in the fascin group were significantly higher (Figure 5A, P < .01) than those in the pcDNA3.1 group and the parental group, suggesting that the NF-κB signaling pathway was activated. Next, an NF-κB inhibitor and NF-κB p65 siRNA were used to interfere with NF-κB activation, and the results showed that E-cadherin expression was elevated (Figure 5B and C, P < .01). Furthermore, E-cadherin expression was decreased by fascin overexpression after NF-κB inhibition.
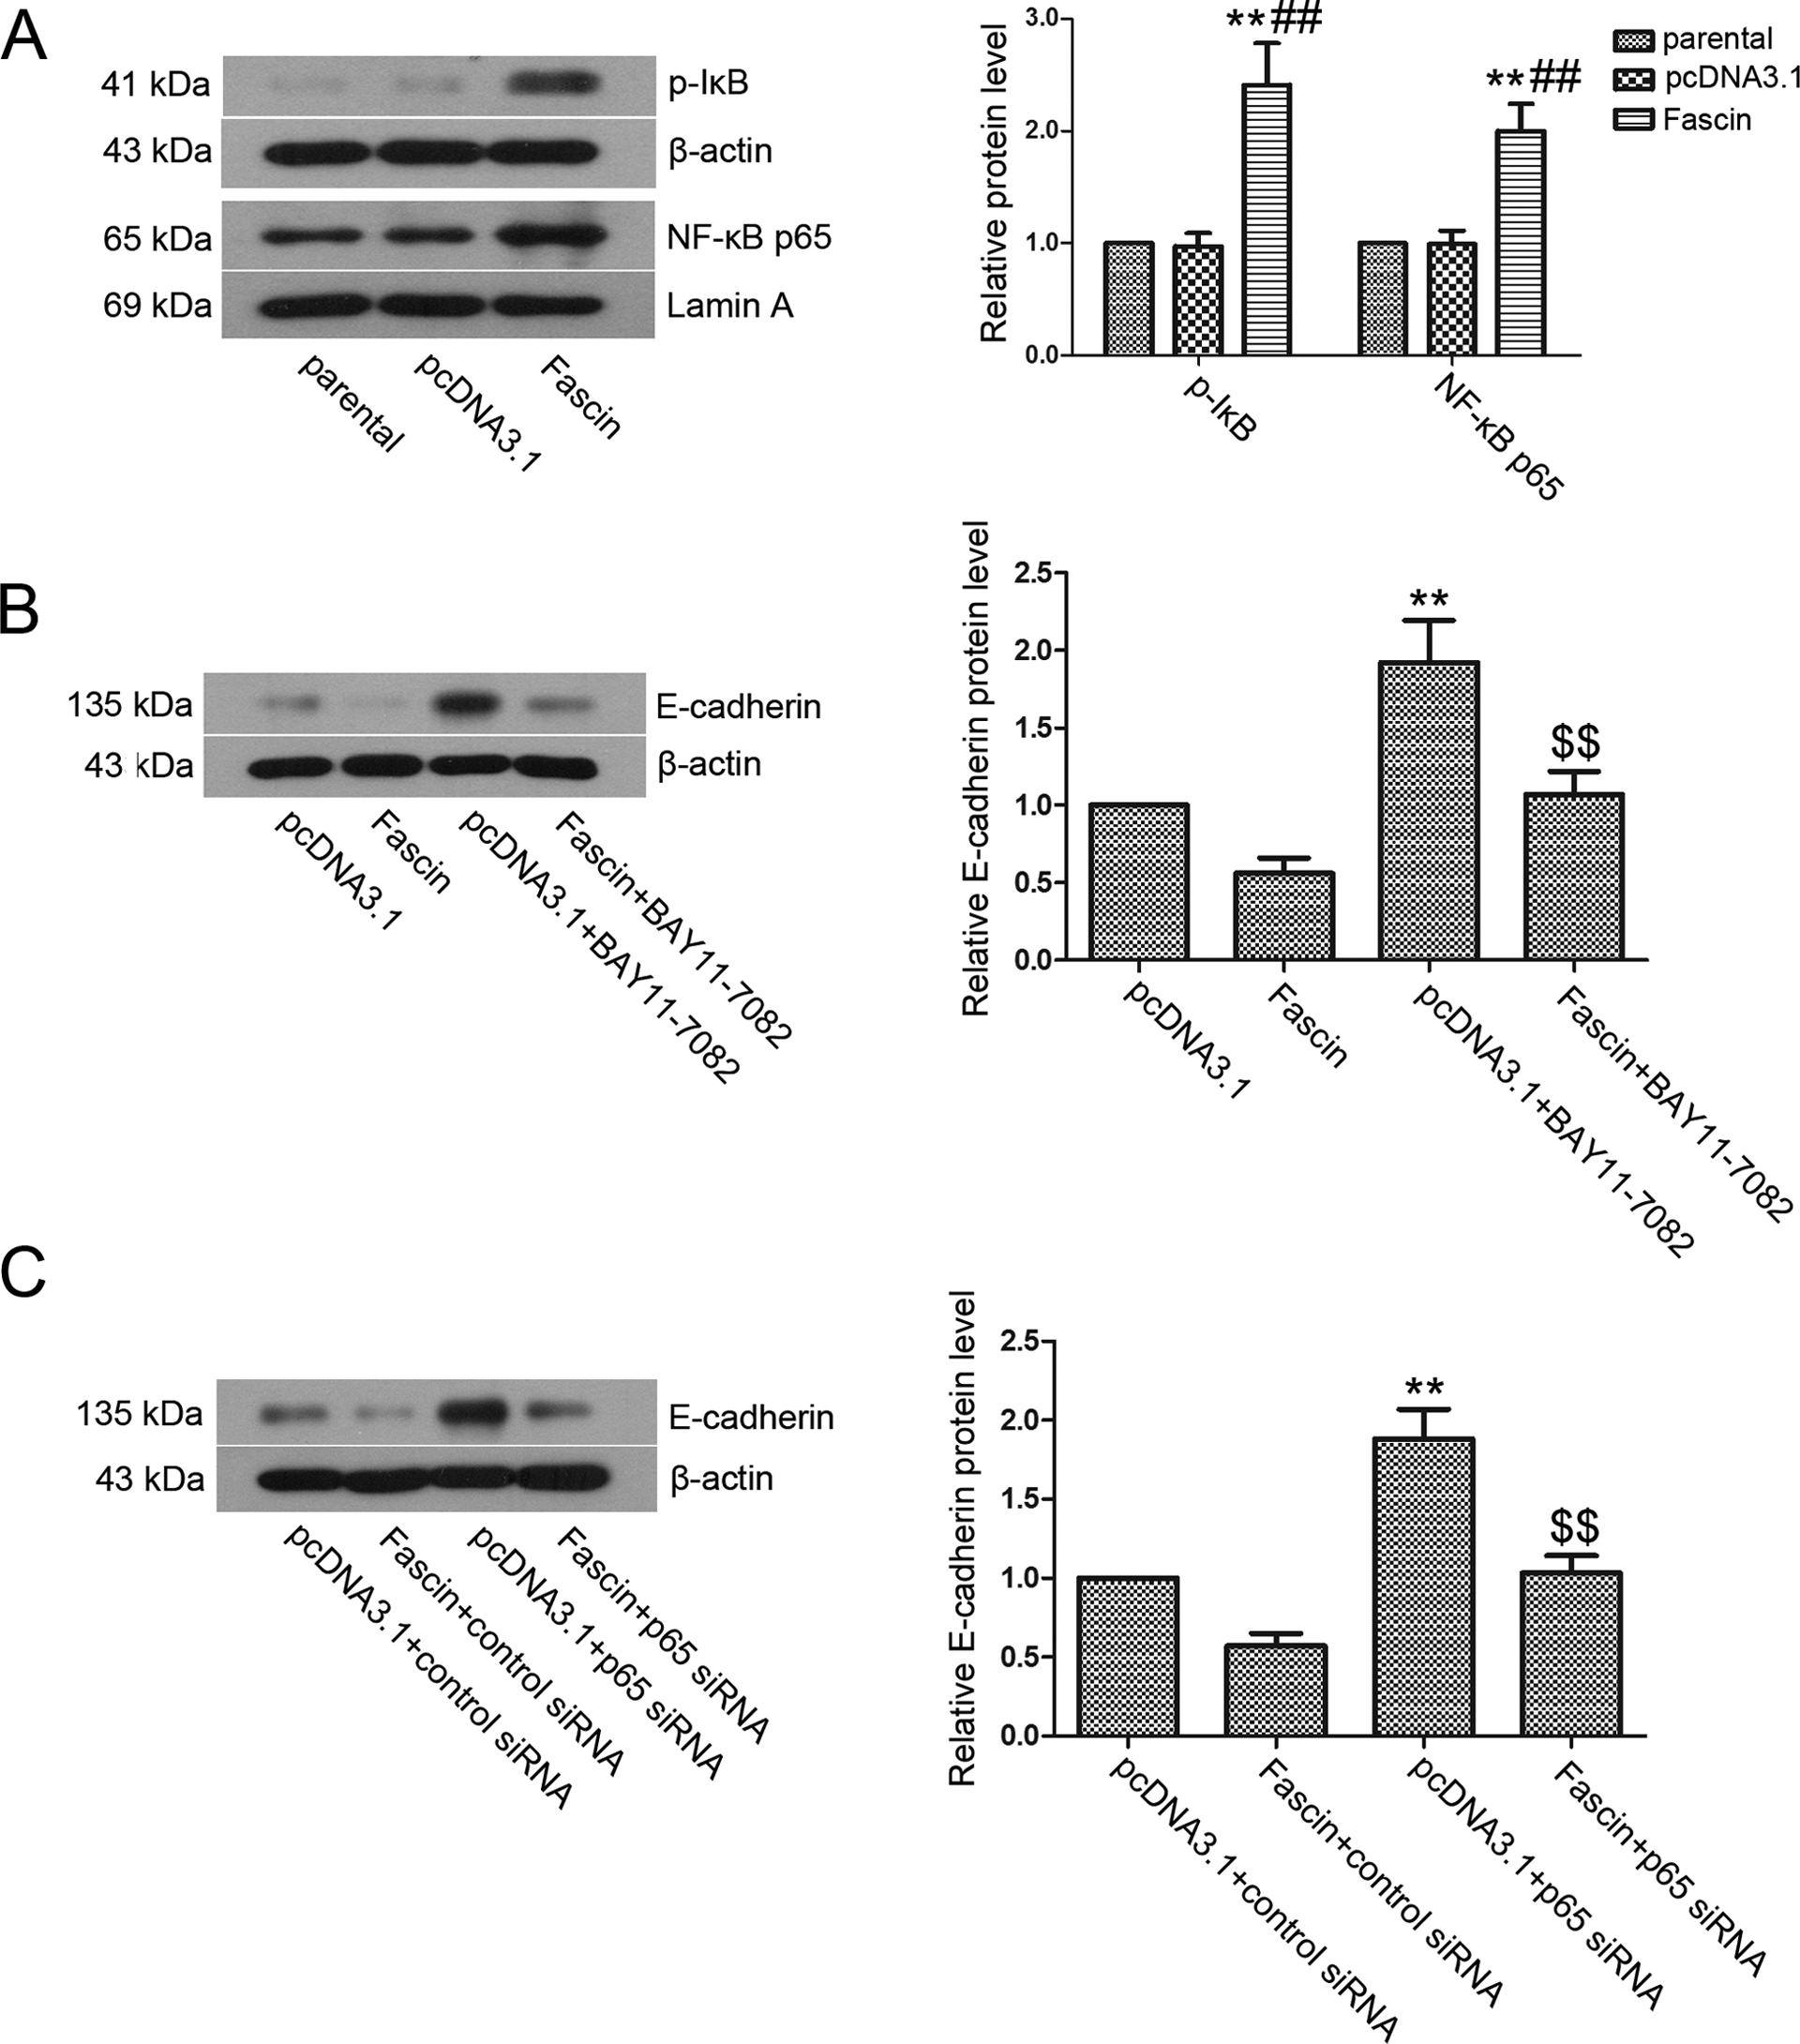
The regulation of E-cadherin expression by fascin was independent of NF-κB signaling pathway. A, Cytoplasmic p-IκB and nuclear NF-κB p65 protein expression levels were detected by Western blot, and the grayscale analysis was performed with β-actin and Lamin A as the internal controls, respectively. The data are presented as the mean ± standard deviation. B and C, E-cadherin protein expression was detected by Western blot. For the NF-κB inhibitor treatment group, BAY11-7082 was added to a final concentration of 3 μmol/L and incubated for 24 hours before analyzing E-cadherin expression. For the NF-κB siRNA intervention group, cell transfection was performed according to the manufacturer’s instructions. Representative results are shown in this figure. The data are presented as the mean ± standard deviation. Compared with the pcDNA3.1 transfection group, ** indicates P < .01. Compared with the parental group, ## indicates P < .01. Compared with the pcDNA3.1+BAY11-7082 group, $$ indicates P < .01. NF-κB indicates nuclear factor-κB; siRNA, small interfering RNA; cDNA, complementary DNA.
Discussion
Fascin expression is upregulated in a variety of malignant tumors. 22 Fascin plays an important role in cell motility and the migratory changes in carcinogenesis. 23 Elevated levels of fascin can enhance the migration capacity of transformed cells in urothelial carcinoma. 24 Previous studies have shown that fascin is significantly correlated with short survival in patients with breast cancer who received chemotherapy. Xenograft experiments have found that this chemoresistance is partially mediated via the PI3K/Akt pathway. 25 Additionally, patients whose tumors abnormally overexpressed fascin have a poorer outcome. 26 Fascin is also recognized as a prognostic indicator in gastric and esophageal cancer 27,28 and intrahepatic cholangiocarcinoma. 26 However, its roles in cholangiocarcinoma RBE cells have not been clearly reported. This study established a cholangiocarcinoma RBE cell line with stable fascin overexpression. Our results indicated that upregulating fascin expression could promote cholangiocarcinoma RBE cell proliferation, migration, and invasion. However, inhibition of E-cadherin by fascin was independent of the NF-κB signaling pathway.
Fascin is primarily distributed in the microvilli and folds of the edge of the cell membrane in active tumor cells or after mitosis 29 –32 or in the adhesive connection area between the cells. 33 Fascin overexpression can affect the function of cadherin–catenin, thereby reducing the adhesion activity between the cells. 34 Recent studies have found that fascin is upregulated in various epithelial malignancies and is involved in regulating tumor cell proliferation. The promoting effect of fascin on tumor cell proliferation has been demonstrated in esophageal cancer, 14 melanoma, 35 and various other cells. This study found that the cell proliferation and the clonogenic capacities of the cells in the fascin group were significantly upregulated. Proliferating cell nuclear antigen is a nuclear protein and is synthesized in the late G1 and S phase of the cell cycle. 36 Proliferating cell nuclear antigen is a characteristic marker of cell proliferation and is involved in DNA synthesis, DNA repair, and cell cycle regulation. 37 In the present study, the expression of a cellular proliferation marker, PCNA, 38 was upregulated, suggesting that fascin can promote RBE cell proliferation, which was consistent with the conclusions of previous studies.
MMP-2 and MMP-9 can degrade a variety of extracellular matrices, participate in tumor metastasis and invasion, 39 and play an important role in tumor metastasis. 40 A study of the hepatoma cell line HLE has found that fascin expression positively correlates with MMP-2 and MMP-9 expression. 41 Downregulation of fascin expression can inhibit the migration and invasion abilities of malignant glioma cells. 42 Previous studies have demonstrated that fascin is significantly associated with MMP-9 expression in cholangiocarcinoma cell lines (CCKS-1 and HuCCT1). Knockdown of fascin expression using fascin siRNA significantly inhibits TNF-α-induced MMP-9 overexpression. Additionally, fascin and MMP-9 overexpression in cholangiocarcinoma cells may have important functions in the progression and invasion of cholangiocarcinoma. 21 In the present study, cholangiocarcinoma cell migration capability and invasiveness were significantly increased after fascin expression was upregulated, accompanied by increases in the activity and expression level of MMP-2 and MMP-9, indicating that fascin may play a major role in promoting RBE cell migration and invasion.
E-cadherin is a single-chain transmembrane glycoprotein 43 in animal and human epithelial cells that maintains the integrity of the morphology and structure of epithelial cells. 44 Downregulation or deletion of E-cadherin expression can lead to the epithelial-mesenchymal transition, thus leading to tumor cell metastasis and invasion. 45 E-cadherin is downregulated in various tumor tissues, which is related to the high motility and invasiveness of tumor cells. 46,47 Studies have shown that the fascin expression level in patients with cholangiocarcinoma is significantly increased and is negatively correlated with the E-cadherin expression level, and loss of E-cadherin is associated with tumor dedifferentiation. 16 Our in vitro study also found that fascin could inhibit E-cadherin expression in cholangiocarcinoma cells and might enhance cancer cell malignant metastasis.
Nuclear factor-κB is an important nuclear transcription factor. The activation of the NF-κB signaling pathway can regulate the expression of many genes and participate in tumor cell proliferation, metastasis, and apoptosis. 48,49 Fascin can activate the NF-κB signaling pathway and promote breast cancer cell motility. 50 Therefore, we hypothesized that NF-κB pathway might be associated with the regulation of E-cadherin by fascin. The results of this study indicated that the cytoplasmic p-IκB and nuclear NF-κB p65 expression levels were upregulated in cholangiocarcinoma cells and that the NF-κB signaling pathway was activated after fascin expression was upregulated. The NF-κB inhibition elevated E-cadherin protein levels. However, further studies have shown that fascin overexpression induced E-cadherin downregulation after NF-κB inhibition. The above-mentioned results demonstrate that E-cadherin regulation by fascin in cholangiocarcinoma RBE cells is independent of NF-κB signaling pathway.
In summary, the results of this study indicated that upregulating fascin expression promoted cholangiocarcinoma RBE cell proliferation, migration and invasion, and reduced the expression of E-cadherin (a tumor metastasis-related factor). The NF-κB pathway was not involved in the regulation of E-cadherin. Our study preliminarily clarifies the role of fascin in the malignant transformation of cholangiocarcinoma RBE cells and provides a theoretical foundation for further study of cholangiocarcinoma. Fascin is expected to become a potential gene therapy target for cholangiocarcinoma.
Footnotes
Declaration of Conflicting Interests
The author(s) declared no potential conflicts of interest with respect to the research, authorship, and/or publication of this article.
Funding
The author(s) disclosed receipt of the following financial support for the research, authorship, and/or publication of this article: This study was supported by a grant from the Natural Science Foundation of Liaoning Province (No.: 201102253).