
Abstract
Introduction:
Intact brain metastases tend to be small and spherical compared to postsurgery brain cavities, which tend to be large and irregular shaped and, as a result, a challenge with respect to treatment planning. The purpose of the present study is to develop guidelines for normal brain tissue dose and to investigate whether there is a dependence on target type for patients treated with hypofractionated volumetric modulated arc radiotherapy (HF-VMAT).
Methods:
Treatment plans from a total of 100 patients and 136 targets (55 cavity and 81 intact) were retrospectively reviewed. All targets were treated with HF-VMAT with total doses ranging between 20 and 30 gray (Gy) in 5 fractions. All plans met institutional objectives for organ-at-risk constraints and were clinically delivered. Dose falloff was quantified using gradient index (GI) and distance between the 100% and 50% isodose lines (R50). Additionally, the dose to normal brain tissue (brain contour excluding all gross tumor or clinical target volumes) was assessed using volume receiving specific doses (Vx) where x ranged from 5 to 30 Gy. Best-fit curves using power law relationships of the form y = axb were generated for GI, R50, and Vx (normal brain tissue) versus target volume.
Results:
There was a statistically significant difference in planning target volume (PTV) for cavities versus intact metastases with mean volumes of 37.8 cm3 and 9.5 cm3, respectively (P < .0001). The GI and R50 were statistically different: 3.4 and 9.8 mm for cavities versus 4.6 and 8.3 mm for intact metastases (P < .0001). The R50 increased with PTV with power law coefficients (a, b) = (6.3, 0.12) and (5.9, 0.15) for cavities and intact, respectively. GI decreased with PTV with coefficients (a, b) = (5.9, −0.18) and (5.7, −0.14) for cavities and intact, respectively. The normal brain tissue Vx also exhibited power law relationships with PTV for x = 20 to 28.8 Gy. In conclusion, target volume is the main predictor of dose falloff. The results of the present study can be used for determining target volume-based thresholds for dose falloff and normal brain tissue dose–volume constraints.
Introduction
The traditional delivery of stereotactic radiosurgery (SRS) using a single fraction, an invasive frame for head immobilization, and a dedicated SRS unit available only in specialized centers has been challenged. The practice of hypofractionated stereotactic radiotherapy (SRT) where a total dose such as 30 gray (Gy) is delivered over 5 fractions using stereotactic technology is increasingly being practiced as an alternative to SRS, in particular for large target volumes (TVs). This advance is facilitated by increased access to state-of-the-art linear accelerator (linac) technology, which includes volumetric image-guidance technology, 1 -3 volumetric modulated arc therapy (VMAT), 4 -6 fine multileaf collimators (MLCs), 7,8 six degree of freedom capable couch motions, 9 and flattening filter-free technology. 10,11 Furthermore, head immobilization requirements have changed with hypofractionated SRT delivered with the patient’s head immobilized in a simple thermoplastic mask. 2,12 This practice does require a planning target volume (PTV) margin, which can be a drawback given the potential for significant increases in the TV and resulting volume of normal brain tissue being irradiated. 13 The benefits of hypofractionated frameless delivery may outweigh the disadvantage of applying a PTV margin and include improved patient comfort and compliance, the ability to dose-escalate and potentially reduce the risk of complications like necrosis due to the advantages of fractionation on the normal brain tissue. 14
At the Sunnybrook Odette Cancer Center, our approach to brain metastases greater than 2 cm in maximal diameter has been to use hypofractionated volumetric modulated arc radiotherapy (HF-VMAT) as our SRT approach of choice. The size cutoff is based on data, which suggest that local control is significantly worse as tumor diameter and volume increase. 15 In addition, our postoperative surgical cavity practice is exclusively based on delivering HF-VMAT. In both cases, we deliver 30 Gy in 5 fractions, and for large volumes greater than 5 to 6 cm in maximal diameter, we reduce the total dose to 25-27.5 Gy. 16 With respect to planning strategy, various groups have investigated multi-isocenter 5,6 and single-isocenter 17 -19 VMAT techniques with or without the use of noncoplanar arcs. 17 Our approach is to employ one arc/isocenter, with the flexibility of adding additional arcs/isocenters under predefined conditions stated subsequently.
Although various approaches for HF-VMAT exist, the practice of 5-fraction HF-VMAT is still considered an emerging technique with no high-level clinical evidence at this time. Moreover, unlike single fraction SRS where there are well-established dose threshold recommendations and treatment planning objectives with respect to plan acceptability, no such data/recommendations exist for HF-VMAT at this time. Therefore, the purpose of the present study was to investigate parameters related to dose falloff and normal brain tissue dose for a large range of TVs based on our experience in order to develop planning guidelines.
Materials and Methods
Between December 2012 and January 2014, 100 patients comprising 136 tumors (intact brain metastases, n = 81, and postoperative surgical cavities, n = 55) were treated using HF-VMAT. All patients received 5 fractions, and the total doses were 30 Gy for 73 lesions, 27.5 Gy for 9 lesions, 25 Gy for 45 lesions, and 20 Gy for 9 lesions. Of the 100 patients, 74 patients had a single lesion, 20 patients had 2 lesions, 4 patients had 3 lesions, and 2 patients had 5 lesions. All patients were treated using the Elekta Synergy model “S” linac (Elekta AB, Stockholm, Sweden) equipped with the Beam Modulator treatment head (Elekta AB, Stockholm, Sweden). The MLC consists of 40 leaf pairs, each 4 mm wide projected at the isocenter, and capable of treating a field of view of 16 cm by 21 cm. All patients were immobilized using a thermoplastic mask (Orfit Industries, Wijnegem, Belgium) on a six degree of freedom (Hexapod, Elekta AB, Stockholm, Sweden). Setup accuracy was confirmed using online cone beam computed tomography (CT), which undergoes daily quality assurance (QA) for kV-MV isocenter calibration.
Treatment planning was performed using the Pinnacle 3 treatment planning system (TPS) v9.0 or 9.2 (Philips Healthcare, Andover, Massachusetts) with the SmartArc option. Dose calculation was performed using the TPS’s convolution algorithm. The calculation was performed on a 2.5 mm grid with gantry spacing of 3° per control. Using a finer resolution added substantial computational time without any improvement to QA reported results. It should be noted that smaller targets (<1 cm diameter) are usually treated with single fraction SRS for which we use another planning system with a 1 mm grid size. The general approach to HF-VMAT treatment planning was to use as few isocenters and arcs as possible. For cases with only 1 brain metastasis or cavity, 1 arc was generally used (examples in Figure 1). For multiple targets, 1 isocenter was considered if the maximum off-axis distance of any leaf would be <5 cm, thereby limiting susceptibility of plan deliverability to off-axis image matching, leaf speed accuracy, and off-axis small field beam modeling. All plans underwent pretreatment verification measurement using ArcCHECK (Sun Nuclear Corporation, Melbourne, Florida) with an objective Gamma Index pass rate of >95%. EBT3 Gafchromic film (Ashland Inc, Covington, Kentucky) was also used in certain cases for which the ArcCHECK may have limitations as follows: For targets that were off-axis or needed noncoplanar arcs, the angular dependence of diodes may be limiting; for small targets <2 cm in diameter, the spacing of diodes on the ArcCHECK may be limiting. All plans passed our pretreatment QA guidelines using ArcCHECK and/or film.

Selected cases from our patient series. Red isodose line = 100% and green isodose line = 50%. A, A spherical intact brain metastasis. B, An irregular shaped cavity proximal to the patient’s posterior surface (dashed arrow). C, Two spherical intact brain metastases for which GI and R50 cannot be faithfully reported for individual targets since the 50% isodose line (green) encompasses both targets. D, Intact brain metastasis for which the planning target volume (PTV; blue) overlaps with the brainstem (orange) resulting in a compromise in target coverage to respect the maximum brainstem dose. The resulting V100 for the PTV was 39%.
The gross tumor volume (GTV) in the case of intact metastases and clinical target volume (CTV) in the case of surgical cavities, and the organs at risk (OARs) consisting of the brainstem, globes, lens, optic nerves, and chiasm were contoured on the axial volumetric T1 postgadolinium magnetic resonance imaging scan fused to the treatment planning CT. For intact metastases, no additional expansion to the GTV was made for microscopic spread; therefore, CTV = GTV for intact brain metastases. A PTV margin of 2 mm was then applied around each CTV. Dose was prescribed to the periphery of the PTV and was on average 85% of the maximum dose. The target object was to cover greater than 98% of the PTV with the prescribed dose. In terms of reporting, we refer to the prescription dose as “100%” and our objectives are thus to achieve a PTV percent volume receiving 100% of the prescription (V100) > 98% and a conformity index (CI) of less than 1.2, defined by the radiation therapy oncology group
20
as
For up-front treatments, the prescription dose was typically 30 Gy in 5 fractions (25 Gy if target >5 cm), and for retreatments, the prescription dose was typically 25 Gy (or 20 Gy if target >5 cm). The OAR dose constraints for the brainstem, optic nerves, and chiasm were typically set to maximum point dose of 25 Gy in 5 fractions as a hard constraint. In cases of retreatments, the maximum point dose allowed varied according to the prior course of radiation. No a priori constraint was set to the normal brain tissue.
Gradient Index, R50, and Regularity Index
The term “dose falloff” refers to how rapidly the dose diminishes outside of the target and is characterized in several ways, including gradient index (GI). Gradient index is defined as the ratio of the volume of the 50% isodose line to the volume of 100% isodose
21
:
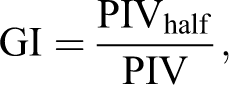
Where PIV is the prescription isodose volume and PIVhalf is the volume receiving 50% of the prescription dose.
Since the interpretation of volume ratios is not intuitive, we also define a 1-dimensional metric, R50 (in mm), which is the radial difference between equivalent spherical volumes corresponding to the 100% and 50% isodose lines:

Where REq(PIVhalf) is the radius of an equivalent sphere with volume PIVhalf and similarly REq(PIV) is the radius of an equivalent sphere with volume PIV.
We also measured a regularity index (RI) for each target as how similar the shape of the target was to a sphere of equivalent volume:

Where TVsphere is a sphere of the same volume as TV. Regularity index can range between 0 and 1 with 1 being a perfect sphere and lower values tending away from perfectly spherical.
For cases involving multiple targets within a centimeter of each other (Figure 1C), reporting GI or R50 per target was not be feasible since the 50% isodose line encompasses both targets. In such cases, the TVs are summed and both GI and R50 are measured relative to the summed TV. For cases involving overlap between the target and an OAR (Figure 1D), treatment planning is more complex than for isolated targets, which may affect how dose falls off outside the target. We, therefore, distinguish between cases where PTV V100 > 98% (ie, meets our guidelines) versus cases where V100 < 98% due to OAR overlap in order to investigate the effect this may have on dose falloff parameters GI and R50.
Reported Metrics for Normal Brain Tissue
The normal brain tissue was defined as the volume of the whole brain tissue minus all CTVs. We recorded the mean dose for each prescription level as well as the volume (cm3) receiving x (Vx, Gy), which is defined as the absolute volume of tissue (in cm3) receiving dose x or above, where x ranges from 5 Gy up to 30 Gy. A value of x = 28.8 Gy was included since it is equivalent to 14 Gy in single fraction based on the linear-quadratic model and has been implicated to be correlated with increased risk of necrosis in a single report. 22 Plots of Vx were generated as a function of the PTV treated.
Results
Gradient index, R50, and RI
The metrics GI, R50, and RI are tabulated in Table 1 and grouped based on intact brain metastasis or postsurgical cavity. Cavities tended to be more irregular in shape than intact brain metastases (RI = 0.74 vs 0.86, P <.0001), but this did not translate into any difference in either conformity or coverage (P = .3 and .5 for CI and V100, respectively).
Summary of Dose Falloff Metrics.

Abbreviations: CI, conformity index; GI, gradient index; PTV, planning target volume; R50, radial difference between equivalent spherical volumes corresponding to the 100% and 50% isodose lines; RI, regularity index; SD, standard deviation; V100, percent volume receiving 100% of the prescription.
Plots of R50 and GI versus PTV volume are shown in Figure 2 separated according to target type (intact or cavity). For R50 versus PTV, a power function was fitted to each of the cavity and intact metastases data separately and together with form [

R50 and gradient index (GI) metrics for intact brain metastases and cavities. A, R50 (in mm) versus planning target volume exhibits power law relationships for cavity (solid line) as for intact targets (dashed line). The dotted line is a fit to the entire set of intact and cavity data. B, GI exhibits power relationships for cavities (solid line) and intact targets (dashed line). The simulation (dashes and dots) generated from R50 data also shows a similar power relationship.
For GI versus PTV, a power function was fitted to each of the cavity and intact data separately and together with form [
Five cases with V100 > 98% for which R50 and GI deviated from the fits in Figure 2 were selected and retrospectively replanned to investigate whether they could be brought to the curves of best fit. The resulting R50 and GI were improved, as shown in Table 2. It should be noted that despite improvements in GI and R50, obviously all treatment planning quality metrics must be considered for any given case.
Selected Cases for Replanning to Improve R50 and GI.
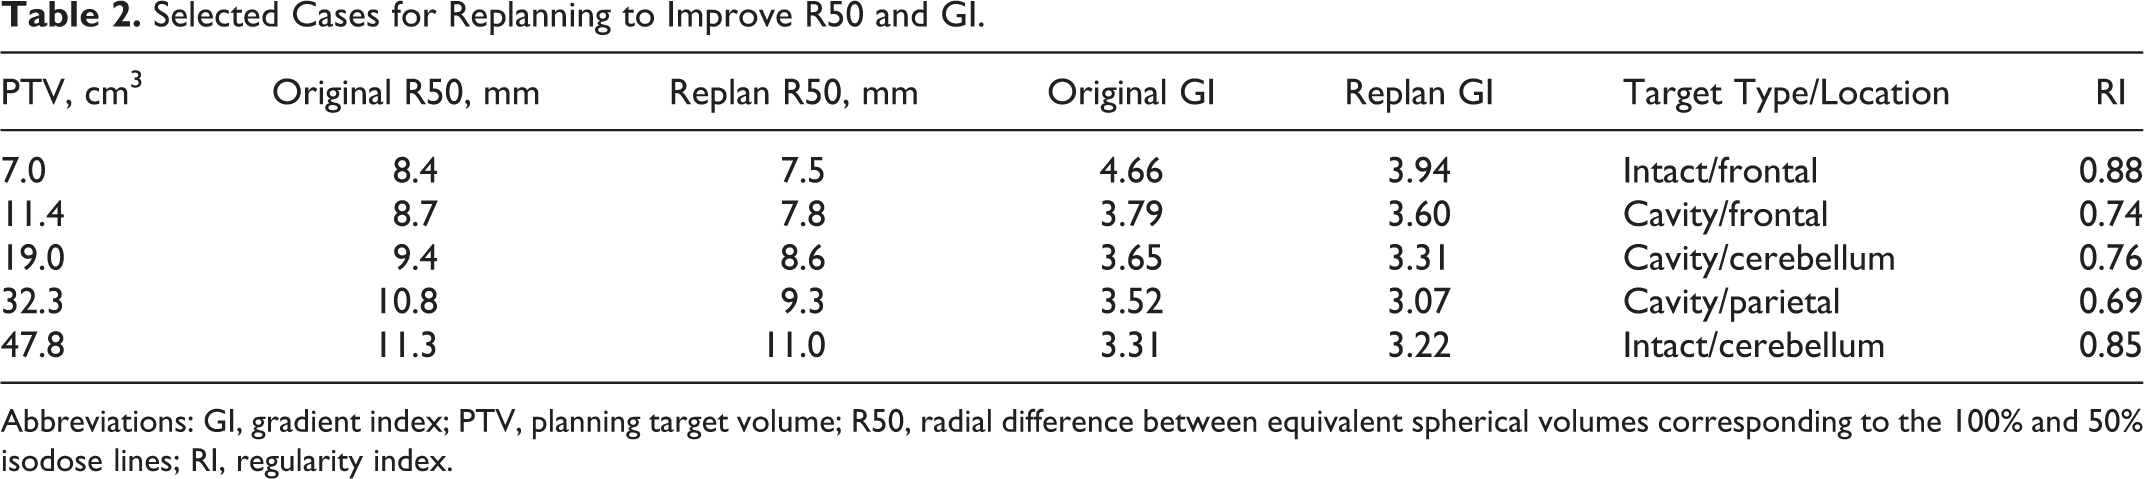
Abbreviations: GI, gradient index; PTV, planning target volume; R50, radial difference between equivalent spherical volumes corresponding to the 100% and 50% isodose lines; RI, regularity index.
Reported Metrics for Normal Brain Tissue
Planning metrics for normal brain tissue are tabulated in Table 3, stratified according to prescription and target type. Although the mean doses were higher for cavities than for intact metastases, they were not statistically significant. For the prescription of 30 Gy, a statistically significant difference was found between cavities and intact for volumes of brain receiving 10 Gy (P = .02) up to 30 Gy (P < .0001), with the volumes receiving those doses higher for cavities due to their larger TVs. For prescriptions of 20 Gy to 27.5 Gy, there was no statistically significant difference found between cavities and intact metastases for any given volume receiving a specified dose.
Summary of Normal Brain Tissue Metrics for Patients Receiving 5-Fraction HF-VMAT.a

Abbreviations: SD, standard deviation; HF-VMAT, hypofractionated volumetric modulated arc radiotherapy.
a For patients who had multiple dose levels, the highest ones were counted for this table. There were only 4 patients who had only a 20 Gy prescription and so were excluded from this table.
Plots of normal brain tissue receiving specific doses versus total PTV are shown in Figure 3 for the prescriptions of 30 Gy (n = 61) and 25 Gy (n = 27, note there were only 8 and 4 cases of 27.5 Gy and 20 Gy, respectively). Curves of best fit exhibited power law relationships for which the fit parameters are shown in Figure 3 adjacent to their respective curves.

Plots of Vx for brain minus clinical target volume versus planning target volume (PTV). On left: V28.8, V25, V20, and V15 for plans with a prescription of 30 Gy in 5 fractions. Right: V25, V20, and V15 for plans with a prescription of 25 Gy in 5 fractions. Fit parameters are included adjacent to their respective power law curves, with the parameter x being the PTV volume in cm3.
Discussion
We report dose falloff dosimetric outcomes for patients receiving 5-fraction HF-VMAT at our institution for both surgical cavities and intact metastases. These results have established in-house guidelines as a benchmark for treatment planning quality; in particular, our clinical outcomes for local control and radiation necrosis are consistent with expected outcomes. 23 For example, for targets less than 30 cm3, we strive to achieve R50 less than 8 mm, otherwise, we strive for R50 less than 10 mm. As shown in Table 2, cases exceeding such thresholds can be replanned in order to bring them in closer to guideline values. Similarly, for targets less than 30 cm3, we expect normal brain tissue V28.8 < 16 cm3, V25 < 24 cm3, and V20 < 38 cm3. Special considerations for targets overlapping with OARs are also factored in when evaluating plans, as data for dose falloff (GI or R50) deviate more often from best-fit curves as shown in Figure 2. Of note, these are all for 5-fraction HF-VMAT and not applicable to other fractionation schemes.
A key observation of the current study is that dose falloff and normal brain tissue dose for a given plan can largely be determined on PTV alone, irrespective of whether the lesion is intact or a cavity as shown in Figures 2 and 3. This volume dependence of GI is consistent with other reports that have demonstrated similar trends, but for a smaller range of TVs than in the present study. 4,24 The parameters R50 and GI were statistically different between cavities and intact metastases, but the curves of best fit in Figure 2 exhibit similar power law coefficients, indicating that this difference between intact metastases and cavity treatment plans is due to the difference in overall TV. The fact that the R50 increases slowly with TV is logical as beam penumbra slowly increases with field size, 25 and field size varies in proportion to TV. Based on an increasing R50, one can simulate/predict a decrease in GI as a function of PTV with reasonable agreement in power law exponent coefficients: −0.22 for simulation versus −0.18 and −0.14 for actual data in cavities and intact, respectively. Similarly, the dose–volume parameters for brain tissue increase with TV as expected.
Another key observation from the current study is that guidelines for dose fall may demand special consideration for cases involving PTV-OAR overlap. When V100 > 98%, we expect metrics such as GI and R50 to fall on our curves of best fit, and we have demonstrated in Table 2 that select outlier cases can be improved via replanning. However, when V100 < 98%, treatment plans exhibit an increased variability in GI and R50 that cannot necessarily be made tighter with replanning as compromises had to be made due to OAR overlap. For cases involving OAR overlap, the OAR dose limit must be respected resulting in modification of the standard optimization parameters and ultimately resulting in nonstandard plans. A class solution to plan these cases is not always possible since the prescribed tolerance of the OAR depends on a number of factors including the prescription dose, and whether the patient has received previous treatments. A promising approach to planning is the use of an overlap volume histogram, which handles target coverage with patient-specific information regarding the magnitude of overlap. 26 Our approach moving forward is to report the dose falloff values during our QA rounds, and in cases where the expected value exceeds the curves of best fit, we can confirm the reason being a complex case involving OAR overlap and accept this deviation. The expectation is that over time we will achieve more consistent plan quality with respect to normal brain tissue doses.
With respect to patient outcomes and toxicity, there is some variation in the literature as to what parameters are most clinically relevant. For example, Ernst-Stecken et al. reported a relationship between the volume of normal brain tissue receiving >20 Gy in 5 fractions exceeded 23 cm3 and an increased risk of necrosis. They recommended a 20 cm3 threshold with respect to necrosis risk. 27 On the other hand, Inoue et al. recommend that the V28.8 Gy in 5 fractions be kept below 7 cm3 to reduce the risk of radiation necrosis. 22 When applied to the present data, each of these recommendations resulted in a different number of our cases exceeding these suggested guidelines. The discrepancies highlight the importance of providing detailed and consistent dosimetry metrics in order to better define clinically relevant dosimetric guidelines.
In terms of technique development, our approach is consistent with the reports in the literature. Of note, Clark et al. assessed the feasibility of using a single isocenter VMAT technique for treating multiple metastases in a single fraction. In that study, a series of 4 simulated patients and simulated lesion sizes less than or equal to 2 cm in maximum diameter were evaluated. 17 Although the present work is hypofractionated and considers much larger TVs, their GI outcomes were approximately 4.7, which is consistent with our GI outcomes for small lesions (Figure 2). Similarly, Audet et al. report their findings for VMAT using up to 6 noncoplanar arcs in series of 12 patients receiving single fraction SRS for relatively small isolated lesions (max 29 cm3). 28 The study by Audet et al. typically used multiple isocenters if any target was greater than 3.5 cm away from an isocenter, which is an approach similar to ours. The study by Audet et al. also reported the volume of brain tissue receiving 50% or 25% of the prescription dose, which increased with increasing target size, and the magnitude of which was similar to our outcomes. The majority of cases in the present study received VMAT with a single arc and single isocenter, as was done by Clark et al. 17 Additional noncoplanar arcs were occasionally used for more complex situations involving OAR overlap. Although the use of additional noncoplanar arcs presented more flexibility in terms of sculpting isodose lines around OARs, the low to intermediate isodose lines in the normal brain tissue must be evaluated on a case-by-case basis when using multiple noncoplanar arcs.
Several limitations of the present study require discussion. First, the GI and R50 metrics are not clearly defined in the literature for multiple targets in which the 50% isodose line is bridged between targets or when the PTV is close to the patient surface. The approach by Clark et al. is to calculate a per lesion average by taking the cumulative 50% isodose line and dividing by the number of targets. 17 Where feasible, the approach taken in the present study was to combine PTVs within 1 cm of each other and treat as one, for the purposes of calculating GI. Second, is the lack of correlative data linking physical/dosimetric metrics with clinical outcomes such as necrosis, and that work is in progress and will be separately reported. Ultimately, modeling of clinical outcomes based on the dosimetric data in the present study will provide a valuable clinical tool that could be used to tailor individual treatments/prescriptions in order to, for example, minimize the risk of necrosis.
Conclusions
The present study summarizes dose falloff data for a large number of patients treated with 5-fraction HF-VMAT for postsurgical cavities and intact brain metastases. The results of the present study indicate that despite differences in shape, dose falloff exhibits similar trends for both tumor types, with TV being the main predictor of dose falloff for each. The results of the present study can be used for determining target volume-based thresholds for dose falloff and normal brain tissue dose–volume constraints.
Footnotes
Abbreviations
Acknowledgments
The authors of the present study would like to thank the dosimetrists Marko Cadonic and Elizabeth Lui for their effort in the clinical development and implementation of the HF-VMAT technique. The authors also acknowledge the advice and effort of Dr. Alexander Lightstone in the development of the technique and advice on quality assurance issues.
Declaration of Conflicting Interests
The author(s) declared the following potential conflicts of interest with respect to the research, authorship, and/or publication of this article: All authors certify that this manuscript has not been published in whole or in part nor is it being considered for publication elsewhere. Dr Sahgal has received honoraria for educational seminars from Elekta AB, otherwise, the authors have no conflicts of interest to declare.
Funding
The author(s) received no financial support for the research, authorship, and/or publication of this article.