
Abstract
Hypoxia microenvironment, as a major feature of solid tumors, increases tumors progression and metastasis. To research whether hypoxia influences the epithelial–mesenchymal transition (EMT) and cancer stem cells (CSCs) of gastric cancer cells and their cell biological behaviors. Human gastric cancer cell lines BGC823 and SGC7901 were cultivated in different oxygen tensions for proliferation, colony formation, soft agar formation, migration, and invasion analyses. Markers of EMT (E-cadherin, N-cadherin, Vimentin, and Snail) and markers of CSCs (Sox2, Oct4, and Bmi1) were investigated by real-time polymerase chain reaction, Western blotting, and immunofluorescent analysis. Cultivated at hypoxic condition, BGC823 and SGC7901 cells morphology began to change significantly. The cells pretreated under hypoxia grew faster than those cells always cultivated in normoxia. Meanwhile, hypoxia pretreatment dramatically promoted cell proliferation, migration and invasion, and increased capability of colony and soft agar colony formation. Furthermore, under hypoxia, E-cadherin decreased and N-cadherin, Vimentin, Snail, Sox2, Oct4, and Bmi1 increased both on the level of messenger RNA and protein. We drew a conclusion that the hypoxic microenvironment induced EMT, upgraded stem-like properties of gastric cancer cells, promoted invasion and metastasis, and behaved more malignantly.
Introduction
Epithelial–mesenchymal transition (EMT) converts epithelial cells to a mesenchymal phenotype, including altering polarity, becoming isolated, and increasing in cell migration and invasion. 1,2 N-cadherin, E-cadherin, and Vimentin, as EMT markers, also change during this transition. 3 Epithelial–mesenchymal transition is induced by genetic and epigenetic changing within the transforming cells. Recently, Snail, Twist1, and Prrx1 as EMT inducers are reported to be associated with EMT in cancer. 4 -6 Epithelial–mesenchymal transition is an important event in the tumor invasion–metastasis cascade. 7 -10
Cancer stem cells (CSCs), a subpopulation of cells within a tumor that possess the self-renewal and generate heterogeneous lineages of cancer cells, 11,12 play a pivotal role in tumor, initiation, invasion, metastasis, and drug resistance. 13 -15 Gastric CSCs have been found in gastric cancer. 16,17 And CD44, Sox2, Oct4, and Bmi1 have been reported as markers for identifying gastric CSCs. 17 -19
Hypoxic environment exists in some regions of solid cancers, which is typically associated with poor patient prognosis, 20 and is actively participating in tumor gastric cancer invasion and progression. 21,22 The mechanism of metastasis and poor prognosis induced by hypoxia should be clarified, it benefits the future development of cancer treatments. 23 It has been reported that hypoxic condition could induce EMT of cancer cells 24 -26 and might regulate the stemness properties in some cancer. 27 -29
The effect of hypoxia on the EMT and cancer stem-like characteristics of gastric cancer cells has not been adequately elucidated. Therefore, we investigate how hypoxia could influence EMT, stem-like properties, and biological characteristics of gastric cancer cell lines in vitro.
Materials and Methods
Cell Culture and Antibodies
Human gastric adenocarcinoma cell lines BGC823 and SGC7901 obtained from the Key Laboratory of General Surgery were maintained in RPMI medium 1640 (RPMI-1640; HyClone, China) supplemented with 10% fetal bovine serum (FBS; HyClone) in a humidified 5% CO2 and normoxic (20% O2) incubators at 37°C.
The antibodies used in this study were as follows: E-cadherin, N-cadherin, Vimentin, Snail, Sox2, Oct4, and Bmi1 antibodies (Abcam); β-actin (Beyotime, China); Alexa Fluor 594-conjugated goat antirabbit immunoglobulin G (IgG; H+L), Alexa Fluor 488-conjugated goat antirabbit IgG (H+L), HRP-conjugated goat antimouse IgG, and HRP-conjugated goat antirabbit IgG (ZSGB-BIO, Beijing, China).
Hypoxic Cell Cultures
Hypoxic condition (1% O2) was maintained by a modular incubator chamber with 5% CO2 and 1% O2 balanced with N2 gas. Cells were cultivated in normoxic (20% O2) for 24 hours, then transferred into chambers with different oxygen controls (1% or 20% O2) for variable period of culture before used for the following examinations. 28 Hypoxic pretreatment for 48 hours designated as hypoxic(+) and not hypoxic pretreatment as hypoxic(−).
Cell Proliferation Assay
The cells were pretreated in normoxic or hypoxic condition for 48 hours before used to study whether hypoxia pretreatment influences the proliferation of cells, and then cultured under normoxia condition before 3-(4,5-dimethylthiazol-2-yl)-2,5-diphenyltetrazolium bromide (MTT) assay. After pretreatment, cells were cultivated in 96-well plates with 2000 cells/well. Each sample had 3 replicates. Cell proliferation was examined after 1, 2, 3, 4, 5, 6, and 7 days. MTT dye of 20 μL (5 mg/mL; Sigma-Aldrich, Saint Louis, USA) was added and cultivated for another 4 hours, then 150 μL of dimethylsulfoxide was added to each well and mixed thoroughly. The 96-well plates were shaken for 30 minutes and were determined in a spectrophotometer (Bio-Rad, Hercules, California) at 490 nm.
Cell Migration and Invasion Assays
Transwell migration and invasion assays were assessed with 24-well 8-μm pore size Boyden chambers according to the manufacturer’s instructions. After pretreatment in normoxic or hypoxic condition for 48 hours, 1 × 10⁵ cells in RPMI-1640 containing 10% FBS were filled in the upper chamber. RPMI-1640 containing 15% FBS was placed in the lower chamber was a chemoattractant. After incubated for 18 hours, the cells on the upper side of the chamber were removed by scrubbing and cells migrating on the lower surface of the membrane were fixed and stained with hematoxylin–eosin. The number of cells was counted in 4 randomly selected microscopic fields for each filter. The invasion assay was performed in a similar method except the transwell chamber inserts were coated with Matrigel (BD Biosciences, San Diego, California) and then incubated for 24 hours. The test was repeated 3 times.
Colony Formation and Soft Agar Formation Assays
The cells were cultivated in normoxic or hypoxic condition for 48 hours, then 500 cells/well were plated in 6-well plates and placed under normoxic condition for 14 days. After fixation, the colonies were stained with 1% crystal violet for 30 minutes and evaluated under inverse miscopy.
5000 cells/well were mixed with 0.33% agar in RPMI-1640 with 10% FBS and plated on 0.5% base agar. After 3 weeks of incubation under normoxic condition, the images of the colonies were acquired and counted with a microscope.
Immunofluorescent Analysis
Cells were grown in dishes and fixed in 4% paraformaldehyde at room temperature for 30 minutes, then permeabilized with 0.04% Triton X-100 for 10 minutes and blocked with 10% normal goat serum for 1 hour at room temperature. The primary antibody, diluted in phosphate-buffered solution (N-cadherin 1:100, E-cadherin 1:100, Vimentin1:150, Snail 1:100, Sox2 1:100, Oct4 1:100, and Bmi1 1:100), was applied overnight at 4°C. Following phosphate-buffered solution washing steps, the cells were incubated with secondary antibodies (Alexa Fluor 488-conjugated goat antimouse IgG or Alexa Fluor 594-conjugated goat antirabbit IgG) for 30 minutes at 37°C. Nuclei of cells were counterstained with 4′,6-diamidino-2-phenylindole, and images were obtained using a fluorescence microscope.
Real-Time Polymerase Chain Reaction Analysis
The cells were cultivated in normoxic or hypoxic condition for 48 hours, total RNA from cells was isolated using TRIzol (TaKaRa, Dalian, China). The concentration and purity of the total RNA were assessed using a ultraviolet spectrophotometer (UltroSPec2100 Pro, Amersham). Total RNA was reverse transcribed using the PrimeScript RT Reagent kit (TaKaRa). Quantitative reverse transcription polymerase chain reaction (PCR) was carried out in the CFX96 Real-Time System (Bio-Rad) using SYBR Premix Ex TaqII (TaKaRa). The experiment was performed in triplicate. Glyceraldehyde 3-phosphate dehydrogenase (GAPDH) was used as an endogenous control and the relative levels of target gene messenger RNA (mRNA) expressed are calculated from the standard curves using the 2-ΔΔCT method. The primers used were as follows: N-cadherin (forward 5′-CAT CCT GCT TAT CCT TGT GCT G-3′ and reverse 5′-CTG GTC TTC TTC TCC TCC ACC TT-3′), E-cadherin (forward 5′-TCG TCA CCA CAA ATC CAG TG-3′ and reverse 5′-CAT TCA CAT CAA GCA CAT CC-3′), Vimentin (forward 5′-TGA ATA CCA AGA CCT GCT CAA-3′ and reverse 5′-ATC AAC CAG AGG GAG TGA ATC-3′), Snail (forward 5′-CACCTCCAGACCCACTCAGAT-3′ and reverse 5′-CCTGAGTGGGGTGGGAGCTTCC-3′), Bmi1 (forward 5′-CCT GAT GTG TGT GCT TTG TG-3′ and reverse 5′-GGT CTGGTC TTG TGA ACT TGG-3′), Oct4 (forward 5′-GCAGCGACTATGCACAACGA-3′ and reverse 5′-CCAGAGTGGTGACGGAGACA-3′), Sox2 (forward 5′-CAT CAC CCA CAG CAA ATG ACA-3′ and reverse 5′-GCT CCT ACC GTA CCA CTA GAA CTT-3′), and GAPDH (forward 5′-AGC CAC ATC GCT CAG ACA-3′ and reverse 5′-GCC CAA TAC GAC CAA ATC C-3′).
Western Blot Analysis
The cells were cultivated in normoxic or hypoxic condition for 48 hours, whole-cell extracts were prepared and lysed in whole cell protein radioimmunoprecipitation assay buffer (150 mmol/L sodium chloride, 0.1 mol/L Tris, 1% Tween-20, 50 mmol/L diethyldithiocarbamic acid, 1 mmol/L ethylenediamine tetraacetic acid, and protease inhibitors at pH 8.0) with added freshly prepared proteinase inhibitors (1.0 mmol/L phenylmethanesulfonylfluoride). The lysates were centrifuged at 12 000 rpm for 30 minutes at 4°C, and the supernatants were collected. Proteins of 50 μg was loaded onto each well. Total proteins were separated by sodium dodecyl sulfate polyacrylamide gel electrophoresis and transferred to polyvinylidene difluoride membranes (Millipore, Billerica, Massachusetts). After blocking with 5% nonfat dry milk in PBS for 1 hour at 37°C, the membranes were incubated with primary antibodies overnight at 4°C. After washing, the membranes were incubated with the second antibodies for 1 hour. Each band was visualized and quantified using the ECL chemiluminescence detection system (ChemiDoc XRS imager; Bio-Rad).
Statistical Analysis
Data were expressed as mean ± standard deviation of at least 3 independent experiments. Comparisons between 2 groups were evaluated by unpaired Student t test. Statistical analyses were performed with the SPSS 11.0 software (SPSS Inc, Chicago, Illinois). P < .05 was considered to be statistically significant.
Results
Effect of Hypoxia on Morphology of Gastric Cancer Cells
During cultivation under hypoxic condition (1% O2), BGC823 and SGC7901 cells showed more polygonal or spindle-like shapes. The cell morphology began to change after 12 hours in the hypoxic culture and the change was significant after 48 hours in hypoxic culture, not much increasing after more than 48 hours, but more time under hypoxic condition meant more death of BGC823 and SGC7901 cells.
Hypoxic Pretreatment Promotes Cell Proliferation, Migration, and Invasion in Gastric Cancer Cells
Under hypoxia for more than 24 hours, the growth of the cells was poor. But BGC823 and SGC7901 cells pretreated with hypoxia for 48 hours grew faster than those control cells always cultivated in normoxia. As shown in Figure 1A, MTT values of BGC823 and SGC7901 cells that pretreated under hypoxia were higher than those cells always kept under normoxia, significantly on 2, 3, 4, 5, 6, and 7 days. Furthermore, to demonstrate the effect of hypoxia on the migration and invasion of gastric cancer cells, assays based on the principle of the Boyden chamber were performed. As shown in Figure 1C and 1D, pretreated under hypoxia, the number of migrate and invasive gastric cancer cells increased significantly compared with the cells always cultivated in normoxia (P < .05). Hypoxia pretreatment promotes migration and invasion in gastric cancer cells.

Hypoxia pretreatment promotes cell proliferation, colony migration, invasion, soft agar colony formation, and sphere formation capability of BGC823 and SGC7901 cells. The cells under hypoxia pretreatment for 48 hours are designated as hypoxia(+), those were always cultivated under normoxia are designated as hypoxia(−). A, Hypoxia pretreatment affected cell proliferation in both BGC823 and SGC7901 cells, tested by the 3-(4,5-dimethylthiazol-2-yl)-2,5-diphenyltetrazolium bromide (MTT) assay. B, Colony formation assays, the colonies were stained with crystal violet. C, Migration assay, the migration of hypoxia(+) or hypoxia(−) of BGC823 and SGC7901 cells were visualized by HE staining. 200×. D, Invasion assays, the invasive properties were analyzed using a matrigel-coated plate. Cells were also stained with HE, 200×. E, The soft agar colony-formation assay, representative images depicting colonies formed by cells hypoxia(+) or hypoxia(−). 100×. F, The sphere formation assay. After pretreatment, cells were cultivated in stem cell medium for 7 days, the sphere images depict colonies formed by cells hypoxia(+) or hypoxia(−). 100×. *P < .05 versus hypoxia(−) groups. HE indicates hematoxylin–eosin.
Hypoxia Increases Colony and Soft Agar Colony Formation Capability of Gastric Cancer Cells
Colony and soft agar colony formation were examined both in BGC823 and SGC7901 cells under normoxia or hypoxia pretreatment condition. Comparatively, hypoxia pretreatment increased the number and diameter of colonies in the colony formation assay (Figure 1B). Moreover, in soft agar colony formation assay, larger and more colonies were observed in the hypoxia pretreated cells than in the cells always kept in normoxia (Figure 1E).
Hypoxia Regulates Markers of EMT in Gastric Cancer Cells
Under hypoxia pretreatment condition, the shape of BGC823 and SGC7901 cells showed more spindle-like fusiform but less sheet-like architecture. The expression levels of EMT markers were quantified by real-time quantitative PCR and Western blot. The mRNA and protein levels of Vimentin, N-cadherin, and Snail increased significantly in cells under hypoxia for 48 hours, in contrast, the expression levels of E-cadherin decreased significantly (Figure 2A, 3A and 3B). These changes were also observed by immunofluorescence staining (Figure 1C). All of the result suggests that hypoxia may be a driving force of EMT in gastric cancer cells.

Hypoxia effected the expression of EMT and CSC makers of BGC823 and SGC7901 cells. Treated in hypoxia for 2 days, BGC823 and SGC7901 cells were then cultivated under normoxia for 7 days, the mRNA change in EMT and CSCs makers was tested by reverse transcription polymerase chain reaction (qRT-PCR) per day. A, The mRNA change in E-cadherin, N-cadherin, Vimentin, and Snail. B, The mRNA change in Bmi1, Sox2, and Oct4. CSC indicates cancer stem cell; EMT, epithelial–mesenchymal transition; mRNA, messenger RNA.

Hypoxia regulated EMT markers of BGC823 and SGC7901 cells. A, The messenger RNA (mRNA) expression level of EMT markers (E-cadherin, N-cadherin, Vimentin, and Snail) in hypoxia(+) or hypoxia(−) group of BGC823 and SGC7901 cells was measured by reverse transcription polymerase chain reaction (qRT-PCR). B, The protein levels of EMT markers were detected by Western blot. C, Immunofluorescence assay for E-cadherin, N-cadherin, Vimentin, and Snail in different groups of cells. Targeted proteins were stained red, and the nuclei were stained with 4′,6-diamidino-2-phenylindole (DAPI). *P < .05 versus hypoxia(−) groups. EMT indicates epithelial–mesenchymal transition.
Hypoxia Upgrades Markers of CSCs in Gastric Cancer Cells
Under hypoxia 48 hours, Oct4, Sox2, and Bmi1, as markers of CSCs, increased in BGC823 and SGC7901 cells on the mRNA and protein levels (Figure 2B, 4A and 4B). Similar changes were observed in immunofluorescence staining, as shown in Figure 4C. Hypoxia increase markers of CSCs in gastric cancer cells. In addition, increasing capabilities of colony and soft agar colony formation, these evidence suggest hypoxia upgrades stem-like properties in gastric cancer cells.
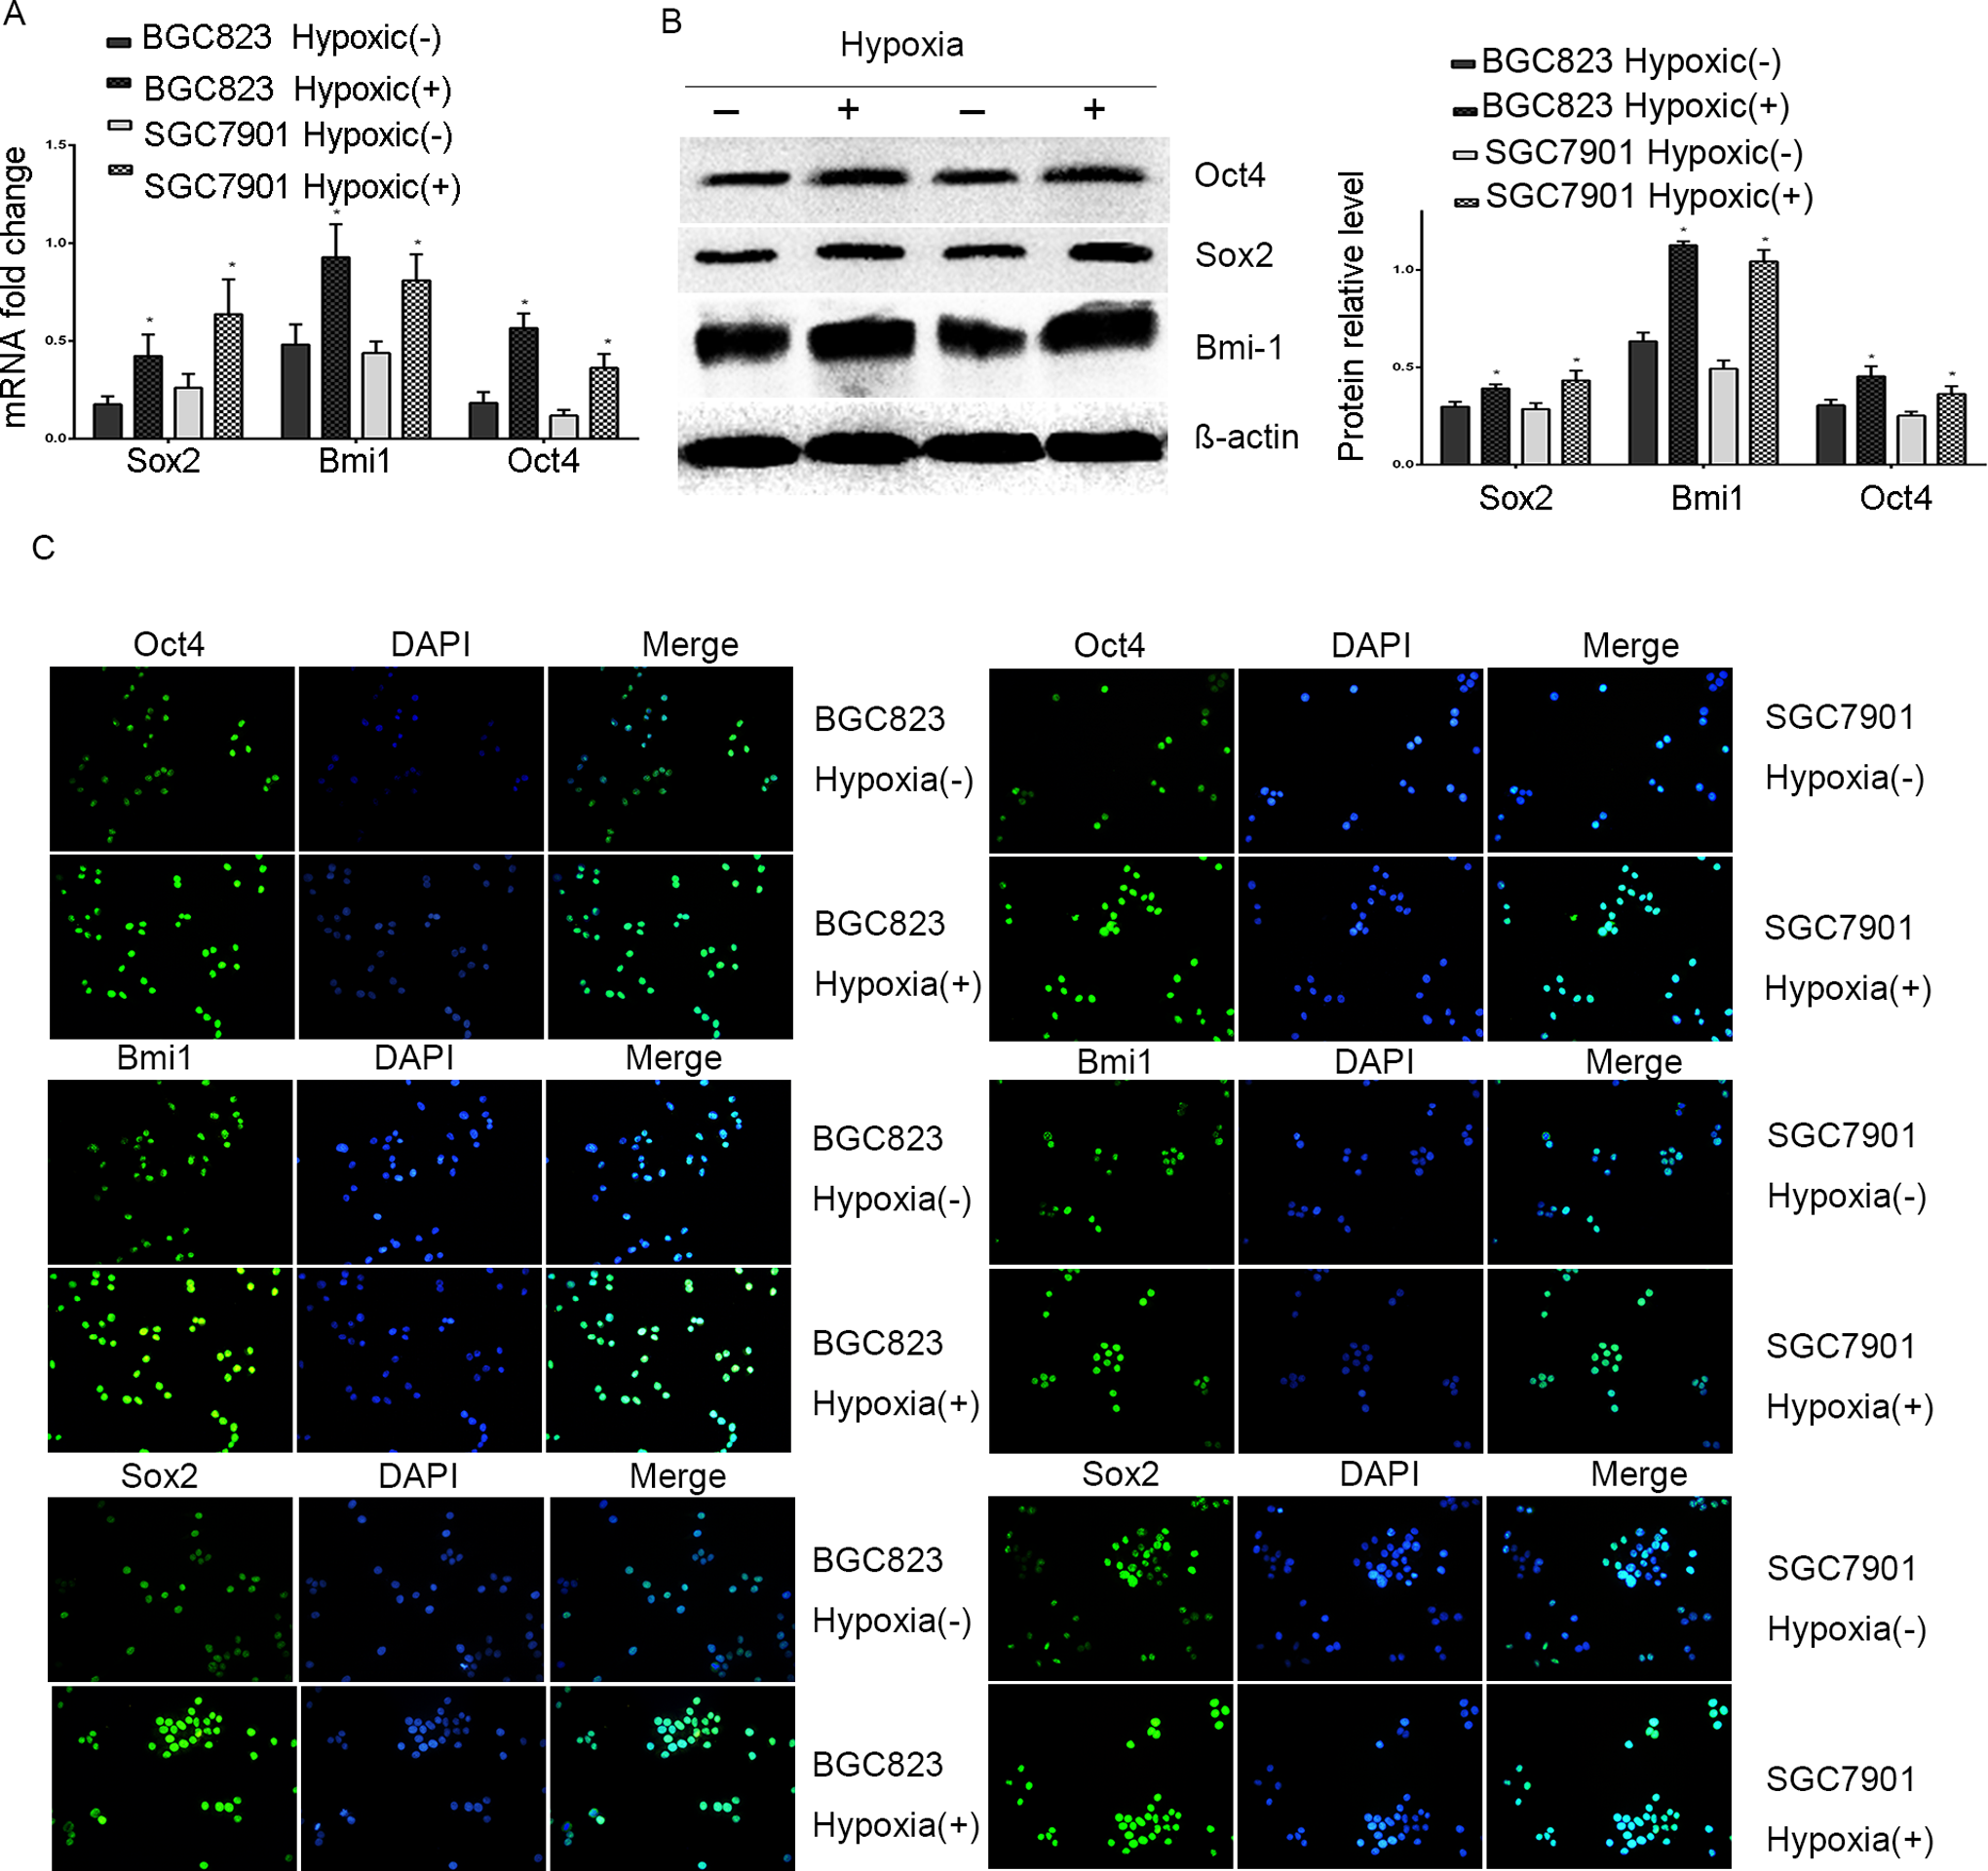
Hypoxia moderated CSC markers of BGC823 and SGC7901 cells. A, The messenger RNA (mRNA) expression level of CSC markers (Oct4, Bmi1, and Sox2) in hypoxia(+) or hypoxia(−) groups of BGC823 and SGC7901 cells, B, The protein levels of CSC markers were detected by Western blot. C, Immunofluorescence assay for Oct4, Bmi1, and Sox2 in different groups of cells. Targeted proteins were stained green, and the nuclei were stained with 4′,6-diamidino-2-phenylindole (DAPI). *P < .05 versus hypoxia(−) groups. CSC indicates cancer stem cell.
Discussion
Hypoxic microenvironment surrounding solid tumor cells might play a pivotal role in regulating invasion and progression of cancer. 20,22,30 However, it remain unclear that the molecular mechanisms responsible for the cancer progression in hypoxia. In recent years, special attention has also been devoted to the effect of EMT and CSCs on cancers invasion and metastasis. 31,32 And it has been reported that hypoxia may be one of the triggers for EMT and CSCs. 33,34
In our study, more polygonal or spindle-like shapes of BGC823 and SGC7901 cells were induced by hypoxic condition, which is in accord with EMT, 2 in addition to this, decreased epithelial cell markers (E-cadherin), and increased mesenchymal cell markers (N-cadherin, Vimentin, and Snail) both in the level of mRNA and protein. And EMT involves several signaling pathways, it was reported that transforming growth factor β, Notch, and Wnt/β-catenin signaling pathways were activated by hypoxic condition, 35 -37 we also found that hypoxia promotes β-catenin nuclear accumulation in gastric cancer cells (not shown). 38 At the same time, hypoxic pretreatment dramatically promoted migration and invasion of BGC823 and SGC7901 cells in vitro. It is well known that EMT plays an important role in invasion and metastasis. 8 Therefore, hypoxia might be proposed as a factor in the initiation of EMT in gastric cancer, 35,39 and hypoxia facilitates cancer invasion and metastasis may be through EMT.
Furthermore, the effect of hypoxia on stem-like cell phenotypes also was researched. As we found in this study, under hypoxia for a long period made the cells grow worse, but the hypoxia pretreatment (1% O2 for 48 hours before back to normoxia) was able to advance the growth of BGC823 and SGC7901 cells, 28 so it was observed that hypoxic pretreatment obviously promoted cell proliferation of gastric cancer cells. Meanwhile, we demonstrated that hypoxia pretreated BGC823 and SGC7901 cells resulted in promoted cell proliferation, increased anchorage-independent colony formation in soft agar and colony formation, reinforce migration and invasion, indicative of malignant transformation of these gastric cancer cells. Additionally, the expression of Sox2, Oct4, and Bmi1, which as markers for identifying gastric CSCs, was obviously increased under hypoxia. And it was reported that using CD44 as a marker to isolate gastric CSCs may not be reliable, 19,40 in our study, flow cytometric analysis showed 99.66% of the SGC7901cells and 99.33% of BGC823 cells expressed CD44, and it was not significantly changed after hypoxia pretreatment (not shown). These findings suggested that gastric cells BGC823 and SGC7901 showed more stem-like cell phenotypes under hypoxic pretreatment.
Hypoxic microenvironment induces EMT and upgrades stem-like properties of gastric cancer cells, which might be responsible for invasion and metastasis. 41 It is reported that the phenotype of CSCs may be associated with EMT, 19,42 the presence of EMT and CSCs contributes to resistance to drug and radiotherapy, 43 as well as therapeutic strategies to overcome this resistance clinically. 29,44 The hypoxic microenvironment seems to be important to primary tumor growth as well as metastasis formation. 45 Combined with the role of hypoxic microenvironment in CSCs and EMT, our data strongly support that the hypoxic microenvironment is an important target for novel therapies.
Footnotes
Abbreviations
Declaration of Conflicting Interests
The author(s) declared no potential conflicts of interest with respect to the research, authorship, and/or publication of this article.
Funding
The author(s) disclosed receipt of the following financial support for the research, authorship, and/or publication of this article: This work was supported by a grant from the National Natural Science Foundation of China (No. 81172295).