
Abstract
Objective:
This preliminary study aims to verify the effectiveness of the additional information provided by spectral computed tomography (CT) with the proposed computer-aided diagnosis (CAD) scheme to differentiate pancreatic serous oligocystic adenomas (SOAs) from mucinous cystic neoplasms of pancreas cystic lesions.
Materials and Methods:
This study was conducted from January 2010 to October 2013. Twenty-three patients (5 men and 18 women; mean age, 43.96 years old) with SOA and 19 patients (3 men and 16 women; mean age, 41.74 years old) with MCN were included in this retrospective study. Two types of features were collected by dual-energy spectral CT imaging as follows: conventional and additional quantitative spectral CT features. Classification results of the CAD scheme were compared using the conventional features and full feature data set. Important features were selected using support vector machine classification method combined with feature-selection technique. The optimal cutoff values of selected features were determined through receiver–operating characteristic curve analyses.
Results:
Combining conventional features with additional spectral CT features improved the overall accuracy from 88.37% to 93.02%. The selected features of the proposed CAD scheme were tumor size, contour, location, and low-energy CT values (43 keV). Iodine–water basis material pair densities in both arterial phase (AP) and portal venous phase (PP) were important factors for differential diagnosis of SOA and MCN. The optimal cutoff values of long axis, short axis, 40 keV monochromatic CT value in AP, iodine (water) density in AP, 43 keV monochromatic CT value in PP, and iodine (water) density in PP were 3.4 mm, 3.1 mm, 35.7 Hu, 0.32533 mg/mL, 39.4 Hu, and 0.348 mg/mL, respectively.
Conclusion:
The combination of conventional features and additional information provided by dual-energy spectral CT shows a high accuracy in the CAD scheme. The quantitative information of spectral CT may prove useful in the diagnosis and classification of SOAs and MCNs with machine learning algorithms.
Keywords
Introduction
Pancreatic cancer is among the most fatal cancers and most patients with this kind of cancer die within 5 years after diagnosis, and the 5-year survival rate is only 6%. Pancreatic cancer mortality has been gradually increasing despite the decreasing death rates of most major cancers, including lung, colorectum, female breast, and prostate cancers. 1,2
There are a number of different types of pancreatic cancer. Neoplastic cysts of pancreas include serous cystic neoplasms (SCNs) and mucinous cystic neoplasms (MCNs). Mucinous cystic neoplasms are mucin-producing and cyst-forming epithelial neoplasia of the pancreas with distinctive ovarian-type stroma. 3 Serous cystic neoplasms account for approximately 25% of all the cystic neoplasms of the pancreas and are considered to be completely benign. 4 The malignant rate of MCNs varies between 6% and 36%, which is still significant. 5 For treatment planning, the invasive MCNs require resection with the least possible delay, whereas asymptomatic SCNs can be observed safely for years. Serous cystadenoma (SCA) is a morphologic variant of SCN. Polycystic patterns comprise a bosselated collection of cysts that are usually more than 6. Honeycomb patterns comprise numerous tiny cysts that mimic a honeycomb or a sponge. Oligocystic patterns may appear as a unilocular cyst and contain several large cysts (larger than 2 cm). 6 On the conventional cross-sectional images, the morphological features of serous oligocystic adenomas (SOAs) are similar to MCNs; both SOA and MCN appear as a solitary macrocystic lesion in the pancreas and difficult to diagnose. 7 The mucinous cysts require more aggressive management. For this reason, distinguishing SOAs from MCNs is important. A previous study 8 reported and discussed a case of unilocular macrocystic SCA preoperatively misdiagnosed as an MCN. The authors 9,10 determined that SOAs and MCNs had distinct characteristic findings on computed tomography (CT) spectral imaging. We analyzed patients with SOAs and MCNs and attempted to identify distinctive information that will be useful for the diagnosis.
Recently, dual-energy spectral CT, a new dual-energy CT scanning mode based on the rapid switching between high- and low-energy data sets from view to view, was introduced. 11 Conventional CT imaging measures the attenuation of an x-ray beam through an object. The x-ray beam quality is commonly defined in terms of the corresponding kilo voltage peak (kVp), which denotes the maximum photon energy, because the x-ray beam is a mixture of various x-ray photon energies. In spectral CT, the attenuation data can be transformed into effective material densities (eg, water- and iodine-based material-decomposition images), which can enhance CT’s tissue characterization capabilities. Monochromatic images can be synthesized from density images, which depict how the image would look if the x-ray source produced only single energy x-ray photons. 12 The present study was designed to evaluate the clinical utility of spectral CT imaging in diagnosing pancreatic cysts. Until now, cyst-fluid analysis is the most reliable technique for confirming the differentiation of serous cysts from mucinous ones. 13,14 However, biopsy is an invasive procedure and may cause certain complications. 15 Therefore, gathering more information is necessary to assist doctors in making a diagnosis and to reduce the required amount of biopsies.
Computer-aided diagnosis (CAD) systems are increasingly being used for providing radiologists second opinions on detection and interpretation of various medical images. Machine learning algorithms have been widely used in many fields, such as CAD, bioinformatics, search engines, computer vision, and information retrieval. 16 –20 Support vector machine (SVM) is among the most popular algorithms in machine learning. Support vector machine is a supervised learning model associated with learning algorithms that analyze data and recognize the patterns used for classification and regression analysis. Feature selection techniques are indispensable for detection, classification, and recognition. 21 In this study, this technique has been used to search for a subset of relevant features that can help doctors to make an efficient diagnosis. 22
In this article, we proposed a CAD scheme for differentiating SOAs from MCNs. The main objective of this CAD scheme is to verify the usefulness of additional information obtained from spectral CT for distinguishing SOAs from MCNs using machine learning algorithms.
Materials and Methods
Patients
This retrospective study has been reviewed and approved by the institutional review board. The patients included in this study signed the informed written consent. From January 2010 to October 2013, 56 patients underwent surgery for pancreatic adenocarcinoma at our affiliated hospital. According to the medical records in the hospital database, 42 patients underwent preoperative dual-energy spectral CT examinations. Thus, the study population consisted of 8 men (mean age, 54.88 years old; in the range, 41-73 years old) and 34 women (mean age, 40.15 years old; in the range, 21-71 years old). Patients were categorized into 2 groups as follows: the SOA group comprised 23 patients and the MCN group comprised 19 patients. The SOA group consisted of 4 cases of oligocystic adenoma and 19 cases of macrocystic adenoma. The MCN group included 18 cases of mucinous cystadenoma and 1 case of mucinous cystadenocarcinoma.
Computed Tomography Protocols
The dual-energy spectral CT images of all the patients were acquired using the GE Discovery CT750 HD scanner (Discovery CT750 HD; GE Healthcare, Milwaukee, WI***). For routine abdominal scanning, each patient was asked to drink 1000 mL of water for approximately 20 minutes before scanning. During scanning, all patients were placed in supine position. Unenhanced scans were initially obtained in the conventional helical scan mode at a tube voltage of 120 kVp. Then, patients were injected with a nonionic contrast medium (iopamidol injection, Iopamiro 300; Shanghai Bracco Sine Pharmaceutical Corp Ltd, China) via antecubital venous access at a rate of 3 to 4 mL/s for a total of 80 to 100 mL during the arterial phase (AP) and portal venous phase (PP). With the gemstone spectral image mode (GSI mode) by fast tube voltage switching between 80 and 140 kVp, AP scanning began 8 seconds after the trigger attenuation threshold (120 HU) was reached at the supraceliac abdominal aorta level. For PP, the delay was 35 seconds after the end of AP. Image processing and analysis were performed using GSI Viewer software 4.4 (GE Healthcare).
Other scanning parameters were as follows: collimation thickness, 0.625 × 64 mm2; scan field-of-view, 50 cm; tube current, 600 mA; rotation speed, 0.6 seconds; and helical pitch, 0.983. The images were constructed using a projection-based material decomposition software and a standard reconstruction kernel.
Image Interpretation
Two experienced radiologists, with 3 and 15 years of experience in abdominal imaging, respectively, reviewed the 42 sets of images retrospectively. Figures 1 and 2 present a comparison of the SOA and MCN on spectral CT images. Figure 1 shows the GSI images of 54-year-old male with SOA in the head of pancreas, whereas Figure 2 shows the GSI images of 28-year-old female with MCN in the tail of pancreas. The 2 cases exhibited unilocular solid cysts, which failed to communicate with the pancreatic ducts on the monochromatic energy images in different phases, thereby making the preoperative diagnosis difficult. However, the water–iodine basis material images and spectral HU curves under monochromatic energy of cyst and normal tissue show distinctions making easy for diagnosis.

Gemstone computed tomography (CT) scan of a patient with serous oligocystic adenoma (SOA) demonstrating a 2-cm unilocular cyst in the body of the pancreas. A and B: Monochromatic image under 68 keV in the AP; (C) iodine-based MD image in the AP; (D) water-based MD image in AP; (E) and (F) monochromatic image under 68 keV in portal venous phase (PP); and (E) spectral HU curve of the head lesion (yellow) and gastric water (red). AP indicates arterial phase.

A typical mucinous cystic neoplam (MCN) demonstrated on Gemstone computed tomography (CT) as a 4-cm unilocular cystic lesion with calcification of the wall (under 68 keV). A, Monochromatic image under 68 keV in AP; (B) iodine-based MD image in AP; (C) water-based MD image in AP; and (D) to (F) spectral HU curve of the tail lesion (yellow), pancreatic parenchyma, and gastric water (pink). AP indicates arterial phase.
The radiologists recorded the location, maximal cross-sectional dimension (long axis), minimal cross-sectional dimension (short axis), and morphological characteristics (eg, nodule and calcification) of each pancreatic lesion. For each patient, an elliptical region of interest (ROI) that encompassed the cystic component of the tumor was placed on the selected monochromatic image, and an Excel file containing monochromatic CT values (Hu) at different energy levels ranging from 40 to 140 keV (at 1 keV increment), iodine and water material density measurements (mg/mL), and effective Z values was created. These measurements were performed at 3 adjacent image levels, and the average values were calculated. This procedure was accomplished using GSI Viewer software 4.4 (GE Healthcare). The radiologist with 3 years of experience determined all ROIs and descriptions of the tumor lesions, whereas the other radiologist with 15 years of experience confirmed these findings. The ground truth of collected data is thus obtained. The ROI sizes and shapes and positions of each patient were constant in the AP and PP.
The full feature set consisted of the same conventional features obtained from conventional CT images and the same quantitative spectral CT features derived from dual-energy spectral CT images. The conventional features included “age,” “gender,” “contour,” “location,” “symptom,” “septa,” “nodular,” “calcification,” “long axis,” “short axis,” and “precontrast CT value.” Among these features, the categorical features were regarded as the nominal variables during analysis. The feature contour described the characteristics (smooth, lobulated, or irregular) of the tumor margins. The feature septa denoted the presence of septa within the cystic cavity. The feature symptom described whether the patients have a history of pancreatitis or not. The feature nodular and calcification denoted the existence of nodules or calcifications within the cyst wall. The feature location depicted the location of the lesion. The features long axis and short axis measured the longest and shortest lengths of the tumor, respectively. The feature precontrast CT value denoted the average CT values of ROI before contrast enhancement. The quantitative spectral CT features comprised 101 monochromatic CT values at different energy levels ranging from 40 to 140 keV (with 1 keV increment), iodine and water material densities, and effective Z values. Accordingly, we extracted 11 conventional features and 104 quantitative spectral features in AP and PP separately. Thus, a total of 219 features were obtained for each case.
Methods
Some basic statistical analyses were conducted using the computer program SPSS for windows, version 20.0 (SPSS, Chicago, Illinois). The comparisons of the nonquantitative descriptive features (eg, gender and location) between the 2 groups were conducted with chi-square test. The comparisons of the quantitative features (eg, age, size, etc) between the 2 groups were performed using independent sample t test.
The flowchart in Figure 3 illustrates the complete CAD process. The radiologist manually extracted the spectral CT data set of pancreatic cysts, and the proposed CAD scheme initially preprocessed the features using normalization method. Then, the Fisher score was calculated for feature selection. A classifier was then trained to distinguish SOA and MCN cases.

Flow chart of the computer-aided diagnosis (CAD) framework.
All data sets were standardized to be zero-mean and normalized through the standard deviation of each dimension. The key idea of Fisher score was to find a subset of features with the largest possible distances between the data points of different classes and the smallest possible distances between the data points of the same class within the data space spanned by the selected features. 23 Support vector machine 24 is a state-of-the-art classification algorithm in the machine learning field. Support vector machine has been commonly used as a benchmark method. Feature-selection algorithms combined with SVM can select the relevant features that can improve classification accuracy and select the informative feature for clinical use.
Finally, the optimal decision thresholds of selected features provided by CAD scheme were determined by the receiver–operating characteristic (ROC) curve analyses. The ROC curves and the corresponding sensitivities and specificities of different features were calculated using MedCalc software version 13.3.3.0 (MedCalc Software bvba, Ostend, Belgium). For all comparison tests and the ROC curve analysis, a P value <.05 was considered to indicate a significant difference.
Results
We tabulated the results of statistical analysis in Tables 1 and 2. From the test results, the P values of chi-square tests of the contour and location feature were less than .05, which meant that contour of the lesions (smooth, lobulated, and irregular) and location (head and neck, body, and tail) were significantly different between the SOA and MCN groups. The tumor lesions located in the body and tail were more likely MCN. Further, the least significant difference multiple-comparison test revealed that the smooth and lobulated and the smooth and irregular contours of the tumor lesion were significantly different between the SOA and MCN groups. The lobulated and irregular contours of the tumor lesion showed no significant difference between the SOA and MCN groups. The P values of chi-square tests of the gender, symptom, septa, nodular, and calcification features were higher than .05. Thus, these features of the SOA and MCN groups were considered to indicate no significant difference in the collected data.
The Characteristics of Patients With Serous Oligocystic Adenoma and Mucinous Cystic Neoplasm.a

Abbreviations: SOA, serous oligocystic adenoma; MCA, mucinous cystic neoplasm; MCN, mucinous cystic neoplasms; SD, standard deviation.
aThis table lists only the conventional features of the patients.
b P value of independent sample t test on continuous variables or chi-square tests on nominal variable.
The significance level of 0.05 is assumed.
Multiple-Comparison Test.

Abbreviation: LSD, least significant difference; std, standard, sig, significant.
The significance level of 0.05 is assumed.
After the data preprocessing step, SVM algorithms were tested on the processed data. Table 3 shows the classification results of the conventional feature and full feature sets of 42 cases. Using only conventional features, 91.3% (21 of 23) of the cases in the SOA group were correctly classified, and 89.5% (17 of 19) of the cases in the MCN group were correctly classified. In the full feature set, 91.3% (21 of 23) of the cases in the SOA group were correctly classified, and 94.7% (18 of 19) of the cases in the MCN group were correctly classified. By adding the additional spectral CT features, the overall accuracy was improved from 88.37% to 93.02%. The results showed that the combination of conventional features and spectral CT features reduced the number of cases misclassifying SOA as MCN, which was more serious than misclassifying MCN as SOA.
PCA With SVM Classification Results.
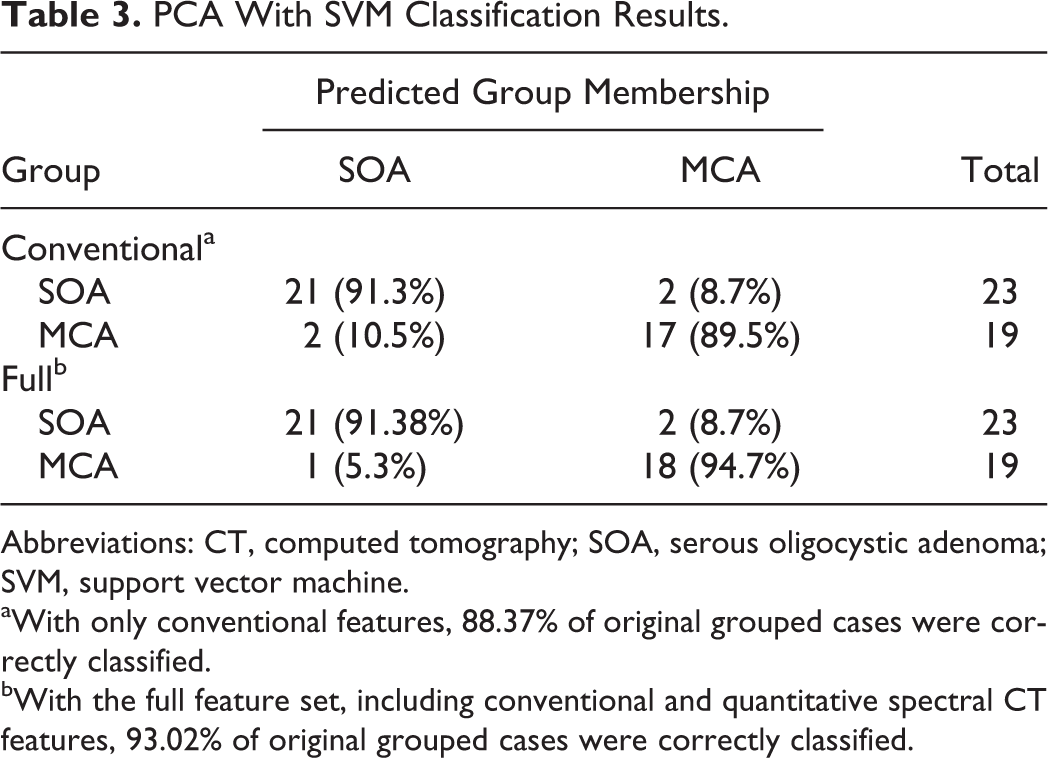
Abbreviations: CT, computed tomography; SOA, serous oligocystic adenoma; SVM, support vector machine.
aWith only conventional features, 88.37% of original grouped cases were correctly classified.
bWith the full feature set, including conventional and quantitative spectral CT features, 93.02% of original grouped cases were correctly classified.
According to the calculated Fisher score of 219 features, the selected features were listed as follows: age, gender, septa, contour, symptom, calcification, nodular, location, long axis, short axis, 42 keV (AP), 40 keV (AP), iodine (AP), 40 keV (PP), and 43 keV (PP). The selected features indicated the importance for CAD scheme to make a prediction. Most selected features were conventional features, and this finding was consistent with the classification accuracy of the SVM algorithm tested on the conventional feature set.
For the continuous features in the selected subset, ROC curve analyses were performed for every possible cutoff value of each variable (Figure 4). The optimal cutoff values and the corresponding sensitivities, specificities, and areas under ROC curve (AUCs) of these selected features were presented in Table 4. The statistical analysis show that there are significant differences of long-axis value, short-axis value, iodine (water) density in AP, and 40 keV monochromatic CT value in AP between SOA group and MCN group. The statistical analysis also shows that there are no significant differences of 43 keV monochromatic CT value in PP and iodine (water) density in PP between SOA group and MCN group. The optimal cutoff values of long-axis value, short-axis value, iodine (water) density in AP, 40 keV monochromatic CT value in AP, 43 keV monochromatic CT value in PP, and iodine (water) density in PP for differentiating SOA from MCN on ROC curve analysis are 3.4 mm, 3.1 mm, 35.7 Hu, 0.32533 mg/mL, 39.4 Hu, and 0.348 mg/mL, respectively.

Receiver–operating characteristic (ROC) curves for selected features. A, long axis, short axis and (B) 40 keV (AP), iodine (AP), 43 keV (PP), and iodine (PP). AP indicates arterial phase; PP, portal venous phase.
Diagnostic Performance of Different Selected Features in Classification of Pancreas Cystic Lesions.

Abbreviations: AP, arterial phase; AUC, area under ROC curve; PP, portal venous phase; ROC, receiver–operating characteristic.
aThe optimal cutoff value was chosen to maximize the sum of the sensitivity and specificity on the Youden index.
Discussion
The experimental results of this proposed CAD scheme demonstrated that combining conventional features with the additional spectral CT features improved the overall accuracy from 88.37% to 93.02%. Lin et al 25 conducted a similar investigation on the imaging characteristics of SOA and MCNs using spectral CT. The obtained results from multiparametric analysis with logistic regression showed that tumor size, location, and contour were the most effective variations. The accuracy of the first reader increased from 70.5% to 86.4%, and the accuracy of the second reader increased from 81.8% to 90.9% with the knowledge of the statistical analysis. The CAD system provides comparable overall accuracy with great reduction in labor force.
The CAD system provided more information other than the overall accuracy. Given the corresponding selected features of Fisher score method, we can conclude that descriptive features, some low energy CT values in both AP and PP (40 and 43 keV monochromatic CT value), and iodine–water basis material pair densities are important factors for diagnosis. Compared with quantitative features, descriptive features are more important. The results of the machine learning algorithms are consistent with the statistical results and observations in previous studies. Morphologic features helped differentiate SCAs from malignant masses. 26 Lin et al 25 indicated that tumor size, location, and contour served an important function in differentiating MCNs from SOAs. Goh et al 4 determined that SOAs differ from MCNs in the relatively higher frequency of tumors occurring in the head of the pancreas and the smaller sizes of these cysts. The SOA could be differentiated from MCN by identifying the imaging features of the lobulated contour, which is the same in T1-weighted MR images. 27 The optimal threshold, which is also known as the operating point or cutoff point, is important in developing guidelines for clinical decision making. 28 Accordingly, to determine the cutoff values of selected features that optimize Youden index in ROC space in terms of distinguishing SOA from MCN, conventional ROC curves were analyzed (Figure 4). The optimal long-axis and short-axis cutoff values for differentiating SOA from MCN on ROC curve analysis were 3.4 and 3.1 mm, respectively. The optimal cutoff value of 40 keV monochromatic CT value in AP, the iodine (water) density in AP, the 43 keV monochromatic CT value in PP, and the iodine (water) density in PP were 35.7 Hu, 0.32533 mg/mL, 39.4 Hu, and 0.348 mg/mL, respectively. In addition to the conventional features, the selected quantitative spectral features were complementary for distinguishing diagnosis.
The most commonly used inspection techniques for pancreatic cancer include endoscopic ultrasonography (EUS), multiple detector computed tomography (MDCT), magnetic resonance imaging (MRI), 29 and endoscopic retrograde cholangiopancreatography. Studies showed that compared with high-quality CT and MRI modality, EUS exhibits superior performance. However, EUS is operator dependent and invasive. 30 The EUS, combined with fine needle aspiration, has recently been proven as a promising tool for cyst fluid analysis. Considering a variety of practical factors, CT is currently the primary imaging modality used in the initial assessment of pancreatic cystic lesion. 31 –33
Given the clinically valuable scanning protocols of spectral CT imaging technology, more information can be obtained with spectral imaging than with other conventional CT techniques (eg, MDCT). The GSI scanning mode enables precise registration of data sets for the creation of virtual monochromatic spectral and material decomposition images for quantitative material concentration measurement. Furthermore, beam-hardening artifacts can be substantially reduced through the monochromatic representation of the spectral CT. 12,34,35 Spectral CT has exhibited several advantages in the imaging of various organs, for example, the brain 36 and liver. 37,38 Comparison results of the monochromatic and polychromatic imaging modes of spectral CT showed that images reconstructed using the monochromatic mode (eg, at 70 keV) yielded higher tissue-to-fat contrast-to-noise ratios and less noise than polychromatic images. 39 Spectral CT provides large amounts of quantitative information and presents a data analysis challenge for doctors. Thus, it is of great significance by verifying useful and concise information to facilitate doctors’ diagnosing procedure. Material decomposition determines the material amount required to produce the observed low and high kVp measurements. The low and high attenuating materials are selected as basis pairs. The basis pairs of water–iodine and water–calcium are common for clinical use in medical diagnoses.
Figure 5 shows the decision-making diagram of the preoperative diagnosis. The conventional image examinations (eg, MRI and CT) were the most basic inspection tools for patients. Pancreatitis was excluded from a clinical point of view, and the remaining pancreatic cystic lesions were viewed as potential cancers. Generally, the patients with pseudocyst can be ruled out by clinical history and imaging features. Intraductal papillary mucinous neoplasm (IPMN) can be diagnosed by using imaging tests that reveal the dilatation of either the pancreatic duct or one of the branches of the pancreatic duct. The detailed diagnosis of IPMNs and pesudocysts will be discussed in our future work. For other subtypes of pancreatic cysts (eg, SOA and MCN that are similar on the images), the diagnosis draws support from quantitative data collected from spectral CT. The EUS with or without fine needle analysis was performed in patients for confirmation. From the decision-making diagram, we can tell that the imaging classification scheme serves an important function in the whole process. The study aimed to improve this scheme by adding machine learning results to help doctors diagnose the disease. This scheme reflects the inner clinical–pathological–radiological correlation with some extent. Clinical descriptive features (eg, age, gender, and location) are more important for diagnosis than quantitative features (ie, monochromatic CT values and MD densities). However, by adding these quantitative features can improve accuracy compared with traditional diagnostic techniques. Especially iodine–water basis pairs and effective Z values provided by spectral CT are helpful for satisfactory prognoses.

Decision-making diagram of preoperative diagnosis on pancreas cystic lesions. 1 Pseudocyst can be diagnosed from a typical history and chemical evidence of pancreatitis and imaging features. 2 intraductal papillary mucinous neoplasm (IPMN) can be diagnosed from the dilation of the duct on the image.
This study had several limitations. The first limitation was the small number of cases. The main advantage of machine learning algorithms is the ability to manage large data. Thus, a high number of cases will produce reliable results. The second limitation was that cases with MRI examination images were insufficient to design a comparison study with spectral images. Third, this study did not taking misclassification cost into consideration. Misclassifying MCNs as SOAs is more serious than misclassifying SOAs as MCNs. Further study is necessary to include a large number of cases and to perform in-depth testing of this diagnostic scheme for validation. Moreover, an algorithm design with cost-sensitive characteristics can also be considered.
In conclusion, the combination of conventional features and quantitative information from dual-energy spectral CT showed high accuracy in the designed CAD scheme. With machine learning algorithms, the quantitative information of spectral CT may prove useful in the diagnosis and classification of SOAs and MCNs.
Footnotes
Abbreviations
Authors’ Note
All authors certify that this article has not been published in whole or in part nor is it being considered for publication elsewhere.
Declaration of Conflicting Interests
The author(s) declared no potential conflicts of interest with respect to the research authorship, and/or publication of this article.
Funding
The author(s) disclosed receipt of the following financial support for the research, authorship, and/or publication of this article: This work was supported by NSFC (No. 81272746), NSFC (No. 81201145) and NSFC (No. 60972110) and the National Basic Research Program of China (973 Program, No.2010CB732506).