
Abstract
The type of algorithm employed to predict drug release from liposomes plays an important role in affecting the accuracy. In recent years, Machine Learning (ML) has shown potential for modeling complex drug delivery systems and predicting drug release dynamics with a greater degree of precision. In this regard, Random Forest (RF) and Support Vector Machine (SVM) are two ML algorithms that have been extensively applied in various biomedical and drug delivery contexts. Yet, direct comparisons of their predictive accuracy in modeling ultrasound-triggered drug release from liposomes remain limited. Existing studies predominantly focus on drug release under static conditions or with limited external stimuli rather than the dynamic, nonlinear responses observed under ultrasound exposure.
Objective
This study presents a comparative analysis of RF and SVM for predicting calcein release from ultrasound-triggered, targeted liposomes under varied low-frequency ultrasound (LFUS) power densities (6.2, 9, and 10 mW/cm2).
Methods
Liposomes loaded with calcein and targeted with seven different moieties (cRGD, estrone, folate, Herceptin, hyaluronic acid, lactobionic acid, and transferrin) were synthesized using the thin-film hydration method. The liposomes were characterized using Dynamic Light Scattering and Bicinchoninic Acid assays. Extensive data collection and preprocessing were performed. RF and SVM models were trained and evaluated using mean absolute error (MAE), mean squared error (MSE), coefficient of determination (R²), and the a20 index as performance metrics.
Results
RF consistently outperformed SVM, achieving R2 scores above 0.96 across all power densities, particularly excelling at higher power densities and indicating a strong correlation with the actual data.
Conclusion
RF outperforms SVM in drug release prediction, though both show strengths and apply based on specific prediction needs.
Keywords
Introduction
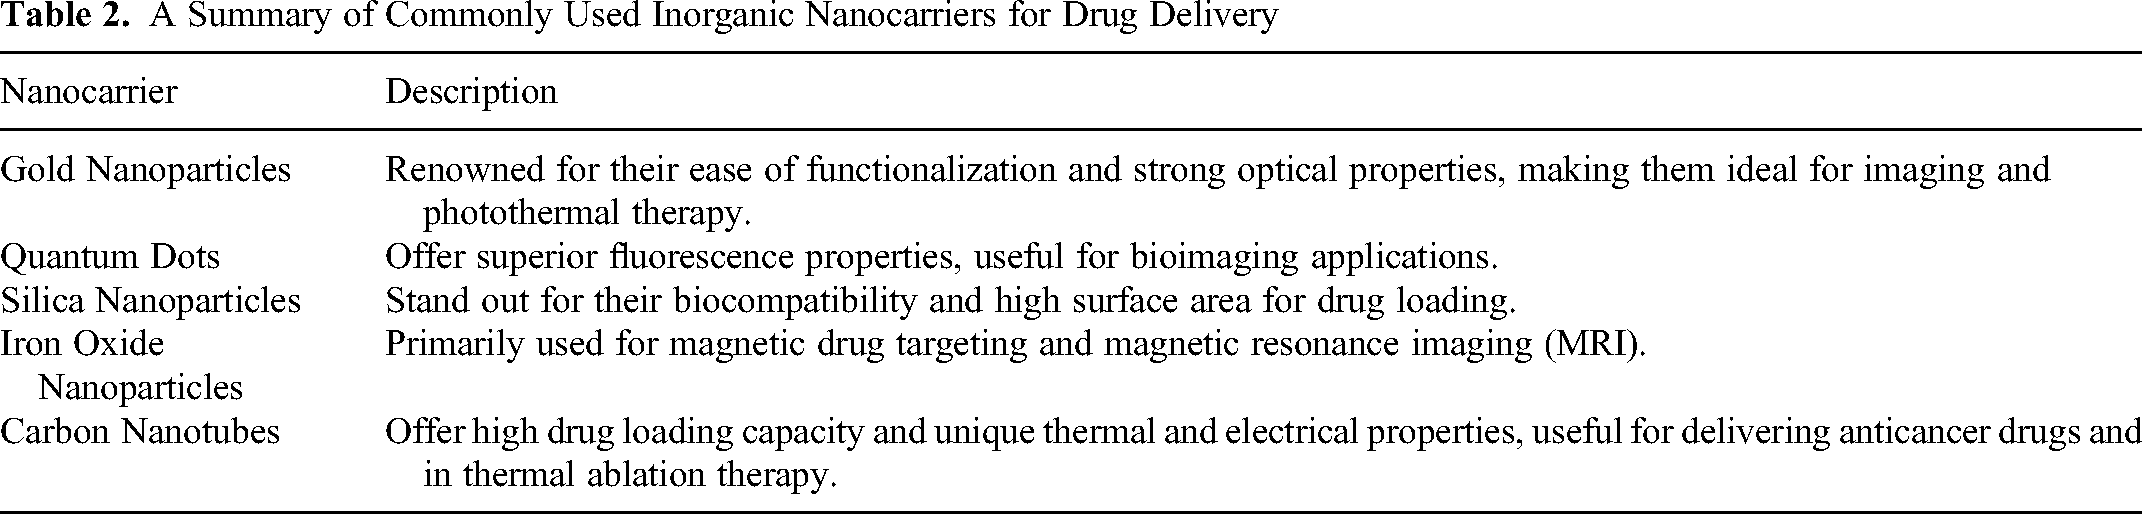
Drug Delivery Systems (DDS) have been exploited extensively to enhance the therapeutic index, pharmacokinetic properties, and safety of medical treatments.1-5 Nanotechnology has been employed in DDS for decades, with nanoparticulate liposomes being first introduced over 50 years ago.6-8 These systems can optimize the administration of therapeutic agents by fine-tuning the drug's release rate, timing, and location within the body. Nanocarriers are critical components in the evolution of DDS, enabling the precise delivery of therapeutic agents to target sites while minimizing systemic side effects. Nanocarriers can be classified into organic and inorganic types, as summarized in Tables 1 and 2.
A Summary of Commonly Used Organic Nanocarriers for Drug Delivery

A Summary of Commonly Used Inorganic Nanocarriers for Drug Delivery
Among these nanocarriers, liposomes are one of the most intensively investigated drug-delivery vehicles.12,13 They are particularly superior due to their structural and functional versatility, biocompatibility, ease of surface modification, favorable safety profile, long systemic circulation half-life, and ability to encapsulate both hydrophilic and hydrophobic drugs.9,12,14,15 Today, several chemotherapeutic, liposomal drug formulations have been approved by the FDA for clinical applications, such as Doxil (doxorubicin liposomes), which was first approved in 1995.6,9,15-17
Liposomes can enter tumor cells and release their contents through passive targeting, specifically via the enhanced permeability and retention (EPR) effect. The EPR effect is a phenomenon where the unique physiology of tumor blood vessels allows for the preferential accumulation of nanoparticles within the tumor tissue. Tumors often have leaky vasculature with poorly aligned endothelial cells, wide fenestrations, and a lack of effective and adequate lymphatic drainage. This ultimately results in enhanced permeability, allowing nanoparticles to passively diffuse into the tumor interstitial space. Once inside, the poor lymphatic drainage leads to the retention of the nanoparticles. The size of the liposomes is an important factor in this process. Typically, liposomes that range from 100 to 200 nanometers in diameter are optimal for exploiting the EPR effect. Smaller particles may diffuse out too quickly and be cleared via renal excretion, while larger ones may not penetrate the tumor vasculature efficiently.
In addition to passive (size-based) drug delivery, active targeting can also boost specificity. This is achieved by conjugating a moiety to the surface of the liposomes. These specific ligands can bind to overexpressed receptors on target cell surfaces prior to receptor-mediated endocytosis, allowing for more efficient internalization of the liposome and its cargo relative to the EPR effect alone. Ligands for active targeting can include small molecules, proteins, polypeptide sequences, antibodies, and other molecules that specifically recognize and bind to these cell surface receptors, depending on the tumor. The information utilized in this study will be explained in further detail in the following subsections.
Although liposomes are effectively endocytosed into the target cells, the release of the encapsulated drug is often sub-optimal. 18 Intrinsic and extrinsic stimuli have been employed as triggering mechanisms to facilitate intracellular drug release from the liposomes. Intrinsic stimuli, such as pH changes,19,20 redox reactions, 21 and enzymatic activity, 22 depend on the tumor environment and can trigger the release of therapeutic agents from liposomes. Extrinsic stimuli, such as light,23,24 heat,25-27 electromagnetic triggers,28-30 and ultrasound (US),31-34 are applied externally and non-invasively to control drug release. US, in particular, plays an important role in Active-Targeted Nano-Drug Delivery (ATDD), and offers deep tissue penetration, precise targeting capabilities, and dual functionality for both imaging and therapy. These advantages make US highly effective for liposomal drug delivery and will thus be our trigger of focus in this study. Figure 1 shows an excellent depiction of the various targeted drug delivery techniques: passive targeting, active targeting, and stimuli-responsive liposomes. 35

Targeted drug delivery techniques: (a) intravenous injection of drug-loaded nanoparticles, (b) passive targeting (EPR effect), (c) active targeting through ligand conjugation and stimuli-responsive targeting. 35
ATDD employs US in conjunction with liposomal nanocarriers and biological targeting strategies to overcome the limitations of traditional chemotherapy.36,37 The synergy between US and ATDD enhances tumor treatment by increasing cell membrane permeability and facilitating drug release from thermally-responsive carriers, such as micelles and liposomes, through tissue temperature elevation.38,39 Such strategies have been shown to achieve deeper tumor penetration, more precise targeting, and more effective infiltration into biological systems, delivering advanced treatments with minimal impact on healthy tissues. 40
The precise delivery and release of therapeutic agents at pathological sites are crucial, especially in treating malignancies, where monitoring and predicting drug release can significantly influence therapeutic outcomes. The inherent complexity of DDS, arising from dynamic physiological interactions and biochemical processes, poses a persistent challenge to achieving precise drug release predictions. Addressing these challenges, the integration of Machine Learning Algorithms (MLAs) into DDS represents a noteworthy advancement. By harnessing the strengths of MLAs, it is possible to analyze and interpret complex datasets derived from DDS, unveiling patterns and correlations that elude traditional analytical techniques. This facilitates the development of predictive models capable of anticipating drug release with unprecedented precision and reliability.
Research Significance
Random Forest (RF) and Support Vector Machine (SVM) are two MLAs extensively employed in various biomedical and drug delivery applications. Despite the proven efficacy of liposomal carriers and the potential of ultrasound-triggered release mechanisms, research comparing the predictive capabilities of different MLAs in this context is scarce. Furthermore, existing studies predominantly focus on drug release under static conditions or with limited external stimuli rather than the dynamic, nonlinear responses observed under ultrasound exposure. Our investigation is among the first to compare RF and SVM regressors across a diverse library of targeting moieties under Low-Frequency Ultrasound (LFUS). This study will further offer a valuable resource for researchers and clinicians to optimize drug release parameters such as the US power density, length of time to sonicate for optimum release, and targeting moiety. The targeting moieties investigated include small molecules – folate and estrone, saccharides – lactobionic acid and hyaluronic acid, antibodies – Herceptin, and proteins and peptides – albumin, cRGD, and transferrin. While our detailed analyses will focus on the cRGD moiety, evaluation metrics for all tested moieties will be presented. We hypothesize that this approach will highlight the versatility of LFUS as well as the potential of each targeting moiety to enhance the delivery and efficacy of therapeutic agents. The findings of this study are poised to highlight the specific strengths and weaknesses of each algorithm in this novel application area, thereby contributing significantly to the advancement of precision medicine.
Targeting Moieties
The selection of appropriate moieties is important for enhancing the specificity and efficacy of therapeutic agents, especially in cancer treatment, where overexpression of certain receptors and proteins can be exploited for targeted therapy. The following moieties are investigated:
Folate: A vitamin B derivative. As a small molecule, folate is efficient in crossing the cellular membrane and is essential for DNA synthesis, repair, and methylation. Its receptors are overexpressed in various types of cancers, including ovarian, lung, and breast cancers. Folate binds with high affinity to the folate receptor, allowing for the targeted delivery of drugs via receptor-mediated endocytosis. Estrone: A naturally occurring estrogen steroid hormone. Estrone is implicated in the pathology of estrogen receptor-positive breast cancer. These receptors, when activated, promote tumor proliferation by modulating gene expression related to cell growth and survival. Lactobionic Acid (LBA): A disaccharide formed from galactose and gluconic acid. LBA targets asialoglycoprotein receptors that are prevalent on the surface of hepatocellular carcinoma cells. These receptors are part of the liver's natural system for clearing aged glycoproteins from circulation, which cancer cells exploit to promote tumor growth and evade immune surveillance. Hyaluronic Acid (HA): A naturally occurring polysaccharide that is abundant in the extracellular matrix and interacts with CD44 receptors, which are overexpressed in many types of breast, colon, and skin cancers. CD44 assists in tumor cell growth, migration, and metastasis by facilitating adhesion and mobility in the tumor microenvironment. Herceptin: A monoclonal antibody that specifically targets the HER2 receptor, which is overexpressed in approximately 20–30% of breast cancers and is associated with aggressive growth and poor outcomes. Albumin: The primary protein in blood plasma, essential for maintaining osmotic pressure and transporting various biomolecules. The overexpression of albumin receptors like albondin (gp60) on endothelial cells in tumor tissues facilitates the transendothelial transport of albumin. The enhanced permeability and retention (EPR) effect in tumor environments further supports this targeting mechanism, as it enables larger molecules like albumin to preferentially accumulate in tumor tissues. This is notable in cancers such as melanoma and colon carcinoma, where the microenvironment and the presence of albumin-binding proteins like SPARC (secreted protein acidic and rich in cysteine) contribute to high albumin uptake. Cyclic Arginine-Glycine-Aspartate (cRGD): The cRGD peptide sequence specifically targets and binds to integrin receptors such as αvβ3 and αvβ5, which are significantly upregulated in angiogenic blood vessels and various tumor cells. This targeting is particularly effective for delivering drugs to tumor sites with active angiogenesis, facilitating the internalization of the conjugated drug-liposome complexes through integrin-mediated endocytosis. The cyclic nature of cRGD enhances its stability and affinity compared to its linear counterparts, making it a potent moiety for cancer targeting. Transferrin: A glycoprotein responsible for iron transport. It targets the transferrin receptors that are overexpressed on the surface of many cancer cells due to their high iron demand. Transferrin-conjugated nanoparticles can efficiently cross cellular barriers, showing promise in their ability to overcome multidrug resistance in cancer cells.
Biophysical Principles and cRGD-Targeting Strategies with Low-Frequency Ultrasound
LFUS presents itself as a reliable modality for non-invasive drug delivery, particularly through the mechanism of stable cavitation. Unlike high-frequency ultrasound, which typically induces transient cavitation leading to violent bubble collapse and potential tissue damage, LFUS operates in a regime that promotes gentle oscillation of microbubbles within the vasculature. This stable cavitation facilitates a sustained and controlled increase in cell membrane permeability. Consequently, it allows for the transport of therapeutic agents across cellular barriers without the undesirable effects associated with transient cavitation, such as lipid peroxidation and mechanical disruption of tissues. The application of LFUS in targeted liposome-mediated drug delivery exploits this nuanced control over cavitation to improve the bioavailability and efficacy of encapsulated drugs. Specifically, the use of cRGD as a targeting moiety capitalizes on its affinity for integrin receptors, which are overexpressed in various pathological states, including tumor tissues. The tripeptide sequence of cRGD enables precise targeting, facilitating the accumulation of drug-loaded liposomes at the site of disease. Moreover, the small molecular structure of cRGD ensures that its conjugation to liposomes does not compromise the stability of the vesicular structure. This stability is crucial for maintaining the integrity of the liposomes during circulation, thereby preventing premature release of the therapeutic payload. The robustness of cRGD-conjugated liposomes under LFUS further amplifies the drug's therapeutic index, ensuring that the release is explicitly triggered at the target site via mild mechanical forces generated by stable cavitation.
Machine Learning
Machine Learning (ML), a branch of Artificial Intelligence (AI), is extensively applied in various science and technology sectors. MLAs create computational models capable of learning from vast datasets by analyzing patterns and drawing inferences, showing immense potential to expedite cancer detection and drug delivery, particularly through predictive models for drug response and synergy in cancer treatment.41-47 For instance, He et al demonstrated the potential of MLAs in customizing therapies to combat complex infections. 48 Training an RF classifier on physicochemical, structural, and geometric attributes to distinguish drug-binding from non-drug-binding surface cavities was another pursuit by Nayal and Honig to predict druggable targets. 49 RF algorithms have generally been employed to handle high-dimensional data and enable the identification of prognostic biomarkers and drug-binding sites, the analysis of digital pathology data, as well as the prediction of drug properties. These methods have demonstrated noteworthy utility in improving data-driven drug discovery and development decision-making. Similarly, SVM has been utilized to classify proteins into drug targets and non-drug targets for various cancers, using genomic datasets and key classification features such as gene essentiality, mRNA expression, and protein-protein interaction network topology.50-52 These methods have been particularly effective in identifying targets for breast, head, and neck cancers. SVM is widely applied to predict the biological activity of new ligands, docking studies, and virtual screening in drug design. 53 This algorithm helps construct models that can predict compounds’ pharmacokinetic and toxicological profiles, significantly aiding in the early stages of drug development. 54 Despite the increasing number ML applications in drug delivery, literature specifically addressing RF and SVM regressors remains limited. Given the multifaceted interactions involved across DDS, such as those between drug physicochemical properties, biological pathways, as well as patient-specific responses, no single ML algorithm is universally optimal. However, there is certainly a critical need for comprehensive, comparative analysis to identify the best-suited algorithms for DDS challenges.
Random Forest
As an ensemble learning method, RF constructs multiple decision trees at training time and aggregates their predictions to form a final output. This process, supported by bagging and boosting techniques, not only amplifies the predictive accuracy but also minimizes the risk of overfitting – a common challenge in model development.
55
For regression tasks, the aggregation of predictions made by multiple decision trees is typically achieved by averaging the predictions, as shown by Equation 1, where YRF is the final prediction of the RF regression model, Yi is the prediction of decision tree i, and n is the total number of decision trees.
In regression tasks, the decision to split at each node of a tree is often based on minimizing the variance. The variance reduction from a split is a measure of how much a given feature decreases the variance of the target variable and is computed using Equation 2. ΔV denotes the reduction in variance, Vparent is the variance of the target variable before the split, Vleft and Vright are the variances of the target variable in the left and right child nodes, respectively, Nleft and Nright are the number of observations in the left and right child nodes, respectively, and N is the total number of observations at the parent node. By optimizing for variance reduction, RF ensures that each split contributes to a more homogeneous grouping of data with respect to the target variable, thereby improving the predictive accuracy of the model.
Support Vector Machine (SVM)
SVM is a versatile supervised learning algorithm recognized for its proficiency in classification, regression, and outlier detection tasks. SVR, a derivative of the SVM algorithm, is designed for numerical predictions. The construction of both SVM and SVR models involves the identification of support vectors (SVs), which are defined differently for classification and regression. As illustrated in Figure S1 in the Supplemental material, SVM delineates two classes by establishing a hyperplane – a conceptual line that separates the classes. This is further reinforced by the creation of two margin lines, positioned equidistantly from the hyperplane, which aid in the linear segregation of data points.
64

These margin lines, parallel to the hyperplane, extend through the nearest positive or negative data points of either class, forming two flanking hyperplanes. The delineated space, termed the margin (H + and H−), is crucial in developing a model that generalizes well, enhancing its predictive accuracy across both classification and regression tasks. The primary objective of SVM is to maximize this margin, thus ensuring the selected hyperplane yields the largest possible separation. Predictions are made by identifying which plane most accurately categorizes each data point, a fundamental principle of SVM.
A key characteristic of SVM is the kernel trick – a sophisticated technique that enhances SVM's ability to process data within high-dimensional feature spaces. This technique eliminates the need for direct computation of high-dimensional coordinates by mapping input data to a higher-dimensional feature space. Such a transformation allows for linear separations even in scenarios where the original feature space does not permit linear distinctions. The selection among common kernel functions – linear, polynomial, and Radial Basis Function (RBF) – is critical. Each offers unique pathways to construct nonlinear decision boundaries that are fundamental in optimizing the algorithm's performance across different datasets. The effectiveness of SVM in high-dimensional spaces and its versatility are counterbalanced by challenges in kernel selection and the need for extensive parameter tuning. These aspects emphasize the importance of a meticulous approach to SVM model configuration to optimize its performance in complex DDS datasets. The choice of kernel for a specific problem does not follow a fixed rule in the literature; rather, it is contingent on the model's performance. For the purpose of this study, we employed all three kernel types to model drug release. Subsequently, we evaluated their performance to determine the optimal kernel function, detailed in the results section. This comparison concluded with the selection of the RBF kernel as the most suitable.
SVR is the most commonly used MLA in drug delivery and infectious disease management research.66-68 Developed in the late 1970s by Vapnik et al, SVMs originally addressed binary classification challenges, efficiently handling multi-dimensional datasets. 65 This foundation facilitated the adaptation of SVMs to SVR for numerical prediction, leveraging their ability to mitigate overfitting and succinctly model complex relationships. 69 SVMs are recognized for their adept use of kernel functions to navigate and model within high-dimensional feature spaces, enabling the construction of nonlinear decision boundaries through the application of linear, polynomial, Gaussian (or RBF), and sigmoid kernels. 70
The application of SVMs spans bioinformatics, drug delivery, and infectious disease treatment, performing in both classification and regression tasks. 71 For instance, Poorinmohammad et al utilized SVM combined with pseudo-amino-acid composition descriptors in their research, achieving a notable prediction accuracy of 96.76% for classifying anti-HIV peptides. 72 In a study conducted by Wang et al, the success of SVM was documented for drug categorization with an 83.9% accuracy rate. 73 Beyond these applications, SVMs have proficiently modeled drug-target interactions, achieving F1 scores of around 80% from interaction matrices. 74 A similar study focused on forecasting the impact of drugs on tumor cell lines using gene expression data from various tumor responses to the drug. 75 This study utilized diverse tumor types and implemented transfer learning to leverage information from different tumor line datasets, resulting in an Area Under the Curve (AUC) of 70%. 75 Another sophisticated application of SVMs is Multiple Kernel Learning (MKL), where different SVMs with varying parameters or kernels are combined linearly to address the same issue, enabling the integration of diverse data sets, though this increases computational demands. Yan et al illustrated the use of an MKL model to predict drug-target interactions with an area under the curve (AUC) of 90%. 76 This was achieved by integrating 1332 known interactions from different datasets, including interaction matrices and data on side effects, pathology, or sequences. 76 Furthermore, the recent integration of SVMs with ANNs underscores their robust capabilities in generalizing nonlinear relationships, a synergy that enhances predictive accuracy and model performance.77-79
Materials and Methods
Materials
1,2-dipalmitoyl-sn-glycero-3-phosphocholine (DPPC) and 1,2-distearoyl-sn-glycero-3-phosphoethanolamine-N-[amino (polyethylene glycol)-2000] (ammonium salt) (DSPE-PEG2000-NH2) were obtained from Avanti Polar Lipids Inc. (Alabaster, Alabama, USA, representative supplier LABCO LLC. Dubai, United Arab Emirates). 24,6 trichloro-13,5 triazine (cyanuric chloride (NCCl)3), cholesterol, estrone (ES), human holo-transferrin (Tf), human serum albumin (HSA) (MW: 68 kDa), hyaluronic acid (HA) (MW: 170 kDa), N-Ethyl-N-(3-dimethylaminopropyl)carbodiimide (EDC), N-Hydroxysuccinimide (NHS), 2-(N-Morpholino) ethane sulfonic acid hemisodium salt (MES), Triton™ X-100, calcein disodium salt, ammonium sulfate salt, and Sephadex® G-25 and G-100 were purchased from Sigma-Aldrich Chemie GmbH (representative supplier LABCO LLC. Dubai, United Arab Emirates). Chloroform was obtained from Panreac Quimica SA (Barcelona, Spain, representative supplier LABCO LLC. Dubai United Arab Emirates). cRGD was obtained from Musechem (Fairfield, NJ, USA). Tri-ethylamine (TEA) was obtained from Reidel-de Haёn (Germany, representative supplier LABCO LLC. Dubai, United Arab Emirates). Doxorubicin-hydrochloride (DOX) was obtained from Euroasian Transcontinental (Mumbai, India). Herceptin was obtained from Hoffmann-La Roche Limited (Basel, Switzerland).
Synthesis of DSPE-PEG2000-NH2 Liposomes Targeted with cRGD Moiety and Loaded with Calcein
Liposomes were synthesized using the thin-film hydration method, as shown in Figure S2 in the Supplemental material. This technique is well-established for producing lipid vesicles with uniform size distribution and high encapsulation efficiency. As a result, the liposomes had a consistent size (100 nm) and morphology, both of which are needed to achieve predictable drug release behavior under US stimulation. The synthesis process began by dissolving a lipid mixture consisting of 784 ml of DPPC, 5.6 mg of DSPE-PEG(2000)-NH2, and 4.7 mg of cholesterol in 4 ml of chloroform. Cholesterol stabilizes the liposomal bilayer to improve both its mechanical properties as well as its ability to retain hydrophilic drugs. The organic solvent was then evaporated under vacuum at 50 °C and during rotation at 120 rpm for 15 min to form a thin lipid film. This film was subsequently rehydrated using a solution of 40 mg of calcein (the model drug), 130 ml 1 M of NaOH, and 1.87 ml of PBS at pH 7.4, creating an aqueous phase that encapsulated the calcein within the liposomes. This hydration step was followed by vigorous vortexing at 60 °C and 120 rpm for 50 min to ensure uniform liposome formation. Sonication was then performed at 60 °C for 50 min to convert multilamellar vesicles into smaller unilamellar vesicles. Extrusion was then done through a 100 nm polycarbonate filter at 60 °C to further control the size of the liposomes and refine them into uniform, unilamellar vesicles of the desired size. Finally, the prepared liposomes were passed through a column containing 0.5 g of Sephadex G-100 and 10 ml of pre-cooled borate buffer, which removed any residual free calcein that had not been encapsulated. This step was essential for ensuring the purity of the liposomal solution and maintaining accurate calcein concentration within the liposomes for the subsequent drug release studies.
To target specific tumor cells, cRGD peptide conjugation was achieved via a two-step chemical reaction. First, 10 mg of cyanuric chloride, a coupling agent, was dissolved in 1 ml of pure acetone and mixed with 500 µl of deionized water in an ice-water bath while stirring at 80 rpm for 3 h. This solution was then slowly added, drop by drop, to the liposomal suspension, which reacted with the DSPE-PEG(2000)-NH2 functional groups on the liposome surface. Following this, 5 mg of cRGD peptide dissolved in 1 ml of borate buffer was added to the mixture. The reaction was left at room temperature overnight under continuous stirring. The final purification step involved passing the liposomes through another 0.5 g Sephadex G-100 column with 10 ml of PBS buffer to change the pH of the medium and remove excess reagents and byproducts, ensuring that the liposomes were fully functionalized with cRGD. Figure S3 shows the underlying chemical reaction in the Supplemental material.
Characterization of DSPE-PEG2000-NH2 Liposomes Targeted with cRGD Moiety and Loaded with Calcein
Characterizing the liposomes ensures their stability, functionality, and suitability for drug delivery applications. The size distribution and surface charge (zeta potential) of the liposomes can directly influence their circulation time, cellular uptake, and ability to release their contents at the target site. Dynamic Light Scattering (DLS) was employed to measure the hydrodynamic radius and polydispersity index (PDI) of the liposomes. A DynaPro NanoStar instrument (Wyatt Technology Corp, California, USA) was used for these measurements, which were performed in PBS at room temperature. The DLS data provided insights into the average size of the liposomes and the uniformity of the size distribution, with a lower PDO indicating a more homogeneous population of liposomes. This is particularly important because the size of the liposomes affects their ability to exploit the EPR effect. In addition, the integrity of the cRGD conjugation to the liposome surface was confirmed using the Bicinchoninic Acid (BCA) assay, which quantified the peptide content relative to a standard curve of known cRGD concentrations. The BCA assay confirmed protein and peptide conjugation and ensured consistent functionalization of the liposomes across different synthesis batches. This is particularly necessary for ML model training because small deviations in the input data can lead to significant variations in model performance.
Data Collection
The collected dataset, which is extensive in scope and obtained from the Drug Delivery Laboratory at the American University of Sharjah, includes over 300,000 data points. These data points are numerically structured across three distinct US power densities: 6.2, 9, and 10 mW/cm2, at a constant US frequency of 20 kHz, reflecting the conditions under which the targeted liposomes were tested. Seven specific liposome-targeting moieties were selected: Albumin, Estrone, Transferrin, Herceptin, Hyaluronic Acid, cRGD, and Lactobionic Acid. For each liposome type, data was organized to capture responses across the three US power densities. The dataset for each liposome type and US power density combination comprises 11 columns: time, power density, and the release data of nine experimental runs. These runs represent a robust dataset, capturing the variability and repeatability of the drug release response to controlled US stimulation. Calcein was selected as the model drug for this study due to its intrinsic fluorescence and cost-effectiveness.
To determine calcein release from the liposomes, we began monitoring fluorescence changes within the surrounding environment, employing pulsed US stimulation (alternating cycles of 20 s of US application followed by 20 s of rest) to trigger the release of the model drug. This methodology was designed primarily to mitigate sample heating, preserving the integrity of the collected data. Figure 2 shows that when ultrasound is off, no release is observed (percent release stays constant). The Cumulative Fraction Released (CFR) was then determined for all release data corresponding to the nine experimental runs to ensure consistency and comparability across the dataset. The CFR represents the proportion of the drug released from the liposomes over time and was calculated using Equation 4:

The setup used to measure release from liposomes at LFUS.
Where I0 is the baseline intensity (before ultrasound was turned on, and it signifies 0% release), It is the intensity at time t, and I∞ is the fluorescence intensity value obtained following the addition of the Triton X-100 surfactant, simulating 100% release. LFUS was set up, as illustrated in Figure 2, using a low-frequency ultrasonic piezoelectric transducer to initiate and trigger drug release. This employed a 3-mm probe, connected to a VCX 750 actuator, with a water-resistant tip that emitted an ultrasonic beam at 20 kHz. A fluorescence measurement device was used to quantify the release. The liposomal solution was placed in a cuvette with a 1 cm × 1 cm opening for optimal energy transfer.
Data Preprocessing
Prior to model training, extensive data preprocessing was undertaken to ensure the dataset's readiness for analysis, which is necessary for achieving reliable predictive performances in both RF and SVM models. Employing the min-max scaling technique, feature values were normalized to a 0–1 range. This standardization is essential to minimize the influence of feature scale on the models, ensuring that each variable contributes evenly to the prediction process. Min-max scaling was also aimed at boosting the convergence speed of the SVM algorithm used in our study. Table 3 provide a statistical summary of the input and output parameters used in the models for the three distinct US power densities used in this study.
Statistics of Database's Input and Output Parameters at 6.2, 9, and 10 mW/cm²

Modeling with RF and SVM
A critical step in ML model development is partitioning the dataset into training and testing sets. For this study, an 80/20 ratio was employed, allocating 80% of the dataset for model training and the remaining 20% for model evaluation and testing. This split is in alignment with standard ML practices, supporting the rationale that a larger training set enhances the model's ability to generalize and accurately predict unseen data.61-65 To ensure an unbiased training and evaluation process, the dataset was divided using a randomized data-splitting technique. This approach guarantees that both training and testing datasets are representative of the overall data distribution, thus minimizing any potential bias.
Data simplification was necessary for analysis, given the multiple runs or replicates for each liposome under specific power densities. A user-defined variable, “melted_df”, in pandas combined the 9 release columns into a single column, ensuring that each release was clearly specified. This “melting” approach was adopted to transform our DataFrame from a wide format with multiple columns into a long format with just one column in order to streamline our data for analysis. The independent variables selected for the modeling process were time and US power density. The dependent variable was the melted column representing CFR from the liposomes. This selection was consistent across all datasets for both RF and SVM models to maintain comparability in the analysis.
For the purpose of this study, we concentrated on data related to the cRGD moiety. The data collected at 6.2 mW/cm² comprised approximately 12,852 entries, 12,762 for 9 mW/cm², and 12,141 for 10 mW/cm². We employed a randomized method for segregating these entries, which, for instance, allocated 10,282 entries at 6.2 mW/cm² for training and 2570 for testing. The same method was applied for partitioning data at 9 and 10 mW/cm². Table S1 in the Supplemental material provides a detailed breakdown of the datasets available for each targeted liposome at different power densities.
In the algorithm parameterization section of the study, for the RF regressor, critical parameters such as the optimal number of trees, maximum depth, and the criteria for node splitting were carefully determined. This selection process, conducted through a cross-validation approach, aimed to find a balance between model complexity and predictive accuracy. Subsequently, the RF model was trained on the processed dataset, utilizing cross-validation techniques to fine-tune the parameters and enhance the model's performance. For the SVR model, the study investigated linear, polynomial, and RBF kernels, with the RBF kernel being chosen for its high performance in handling the nonlinearities inherent in the drug release data. Furthermore, optimizing the SVM's hyperparameters, including the regularization parameter (C) and the gamma parameter for the RBF kernel, was executed using a grid search process, augmented by cross-validation. This comprehensive approach enabled the identification of the most conducive model configuration.
Model Evaluation
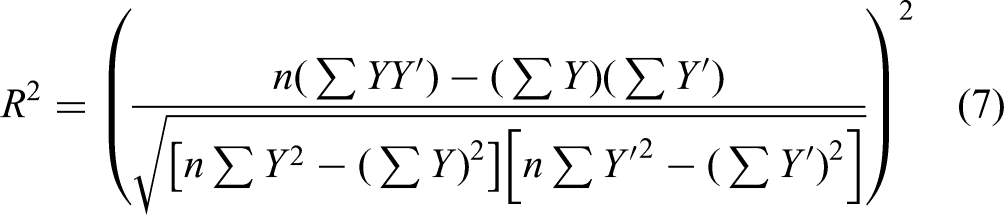
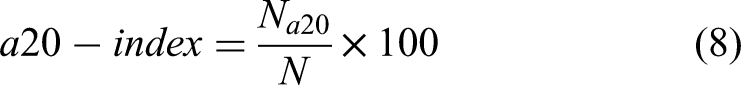
To objectively assess model performance, we utilized a set of three statistical metrics: Mean Absolute Error (MAE), Mean Squared Error (MSE), the Coefficient of Determination (R²), and the a-20 index. Equations 5–8 show how these metrics are computed. MSE and MAE serve as measures of how accurately the model's predictions align with the actual data. Smaller values of MSE and MAE denote a stronger correlation and greater accuracy in the model's predictions. Conversely, larger values of these metrics indicate a greater deviation between predicted and actual values, signifying lower prediction accuracy. In particular, MAE serves as a more straightforward metric to asses prediction accuracy. MSE, on the other hand, emphasizes larger errors more than MAE due to the squaring of the error terms, thus penalizing large deviations. This metric is useful in assessing the robustness of the model, especially in cases where outliers or significant deviations could impact drug release predictions. The R2 value, varying from 0 to 1, represents the proportion of variance in the actual data that is explained by the model's predictions. An R2 value nearing 1 indicates a more optimally fitted model and suggests that the model is effectively capturing the drug release dynamics. The a20-index, also known as accuracy within 20%, is the proportion of predictions that fall within 20% of the actual or experimental value. Essentially, it assesses the predictive accuracy relative to a 20% tolerance band around the actual value. A higher a20-index indicates better predictive accuracy of the model, as more predictions are within the 20% tolerance.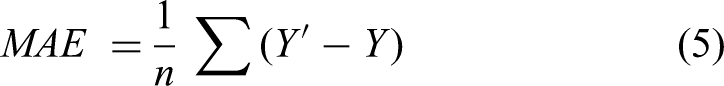

The development and evaluation of the models were conducted using Python (version 3.9.7), within the Anaconda environment (version 22.11.1, available at https://www.anaconda.com/; Anaconda Inc., Austin, TX, USA). The Jupyter notebook (version 6.5.2, accessible at https://jupyter.org) and the scikit-learn library (version 0.24.2, found at http://scikit-learn.org/stable/) were also utilized. For all statistical analysis and data visualization, Python (version 3.9.7) was employed, along with key packages, including SciPy (version 1.9.3, https://www.scipy.org), matplotlib (version 3.6.0, https://matplotlib.org), and seaborn (version 0.11.2, available at http://seaborn.pydata.org).
Results and Discussion
Performance Evaluation Metrics
In this section, we evaluate and discuss the performance of RF and SVM in predicting the release of a model drug from targeted liposomes across three distinct US power densities: 6.2, 9, and 10 mW/cm2. Utilizing normalized datasets to represent CFR over time, we provide a comparative analysis of both MLAs with a focus on cRGD liposomes as a primary example. For the SVM algorithm, different kernels such as RBF, linear, and polynomial have been explored to optimize prediction accuracy, with the RBF kernel being particularly emphasized due to its previous establishment as a suitable choice for this analysis. The results are presented in Tables 4 and S2.
Regression Evaluation Metrics (R2, MAE, MSE, and a20-index) for cRGD Release

Table 4 compares the regression evaluation metrics for release from cRGD liposomes at all three US power densities. The MAE, MSE, R2 scores, and a20-index for RF and SVM (across different kernels) serve as a quantitative foundation for evaluating model performance. Regarding SVM, R2 scores for the three kernels across all power densities are above 0.8, signifying that each model possesses predictive relevance. At the lowest power density of 6.2 mW/cm2, the SVM's RBF kernel demonstrates superior performance over the linear and polynomial kernels in all metrics by attaining the lowest MAE, MSE, and the highest R2 score. This suggests the RBF kernel's proficiency at lower power densities in capturing the complex dynamics of drug release, possibly where nonlinear dynamics become increasingly significant. At 9 mW/cm², the SVM's RBF kernel continues to display strong performance, particularly in its R² score. However, the polynomial kernel narrows the performance gap and exhibits comparable effectiveness at this increased power density. At 10 mW/cm², the RBF kernel maintains a competitive R² score despite higher MAE and MSE among the kernels, suggesting that its predictions correlate well with the actual data. Notably, the polynomial kernel excels in this setting, achieving the lowest MAE and MSE, indicating its particular suitability for higher power densities. Furthermore, As evident in Table 4, the a20-index results across different power densities vary significantly depending on the kernel type. The RBF kernel consistently performs the best, with a20-index values of 83.94% at 6.2 mW/cm², 86.02% at 9 mW/cm², and 63.11% at 10 mW/cm². The linear kernel shows moderate performance, while the polynomial kernel performs poorly at lower power densities, with an a20-index of 57.95% at 6.2 mW/cm², but improves at higher power densities, reaching 84.81% at 10 mW/cm². These results indicate that the RBF kernel generally provides better predictive performance across most power densities, whereas the linear and polynomial kernels exhibit more variability and lower accuracy. Overall, these findings reinforce the conclusion that while all kernels are capable of predicting release to some degree, the RBF kernel stands out as the most consistently effective, particularly at lower power densities, and will thus be the SVM kernel of focus in this analysis.
Comparatively, the RF model shows robust predictive performance across all three power densities. With R2 scores consistently above 0.96, RF's ability to maintain the highest R2 scores among both models indicates its effectiveness in modeling the release with a stronger correlation between the independent and target variables. This offers a robust alternative that may complement the more nuanced specificity of SVM kernels by performing well in applications that require high predictive accuracy from the outset. RF's MSE values suggest that calcein release is most effective at 10 mW/cm2. At this power density, the MSE value for the dataset is 0.0002 – lower than for the other two power densities. Its R2 score for this setting is also the highest among the three power densities. Furthermore, when comparing a20-index values, RF consistently outperforms SVM across all power densities. Even SVM's highest performance (86.02% with the RBF kernel at 9 mW/cm²) remains below RF's lowest value (95.57%). This suggests that while SVM performs well with RBF kernels, RF's ensemble method better captures the complexities of the data.
The findings presented in Table 4 imply that the RF algorithm serves as an appropriate model for forecasting cRGD release based on the input variables. Furthermore, the outcomes also indicate that the prediction of calcein release remains highly representative across all power densities examined.
Table S2 in the Supplemental material lists the regression evaluation metrics for releases from various targeted liposomes at the three power densities based on RF and SVM with the RBF kernel. A key aspect of this study was to assess whether the targeting moiety affected the accuracy of the predictive models. For liposomes conjugated with Albumin, Estrone, and cRGD, RF consistently outperformed SVM across all power densities. However, there is an interesting pattern: SVM outperforms RF in terms of all evaluation metrics for release from liposomes conjugated with transferrin, Herceptin, hyaluronic acid, and lactobionic acid. This performance difference is most pronounced at the lower and intermediate power densities, whereas at the highest power density, RF regains its superiority across most moieties.
This suggests that the structural and physicochemical properties of the targeting moieties plays a critical role in influencing the release dynamics. One possible explanation is that moieties like transferrin, Herceptin, hyaluronic acid, and lactobionic acid, may induce more complex interactions with the liposome bilayer, leading to nonlinear release dynamics, particularly at lower US power densities. These moieties vary in molecular sizes and charges, which may affect the mechanical stability and responsiveness of the liposomal membrane under US. With its strength in capturing nonlinear patterns, SVM could be better suited to model the variability introduced by these moieties in solution, where US-triggered release is not purely mechanical but also influenced by how the liposome and its targeting ligand interact with the surrounding solution.
At lower and intermediate power densities, the energy imparted by the US may be insufficient to uniformly disrupt the liposomal membrane, particularly for liposomes functionalized with complex moieties like Herceptin or hyaluronic acid. Instead, the release may occur in a more gradual, uneven way. SVM's RBF kernel is adept at handling such nonlinearities and would be better equipped to predict release patterns under these conditions. On the other hand, the intensity of US at higher power densities likely overwhelms any specific molecular interaction effects from the moieties, resulting in a more uniform release. In this scenario, RF performs better because the release process becomes more linear and predictable, allowing the ensemble decision-tree approach to capture the overall release behavior with high accuracy. The uniform membrane disruption at higher US power densities reduces the complexity of the release dynamics, making RF the superior model in this context.
Experimental Release Patterns
This section examines the experimental release behavior under different US power densities. Understanding these release patterns is crucial for later assessing the predictive capabilities of RF and SVM relative to the original release data. Figure S4 (see Supplemental material) shows that the plots delineated with varying release titles (from Release1 to Release9) showcase a remarkable uniformity across their trajectories. This agreement in release patterns is indicative of the reproducibility and reliability of the experimental setup. The observed release profile can be characterized by an initial rapid release phase when US is turned on, subsequently tapering into a more moderated and sustained release mechanism when US is turned off. This, alongside the trend of higher overall CFR at elevated US intensities, is reminiscent of the typical ‘burst release’ observed in numerous drug delivery systems, where a significant fraction of the drug is released initially, followed by a controlled, steady release.80-82
Comparative Analysis of RF and SVM
Modeling Capabilities of RF and SVM Relative to Original Release Data
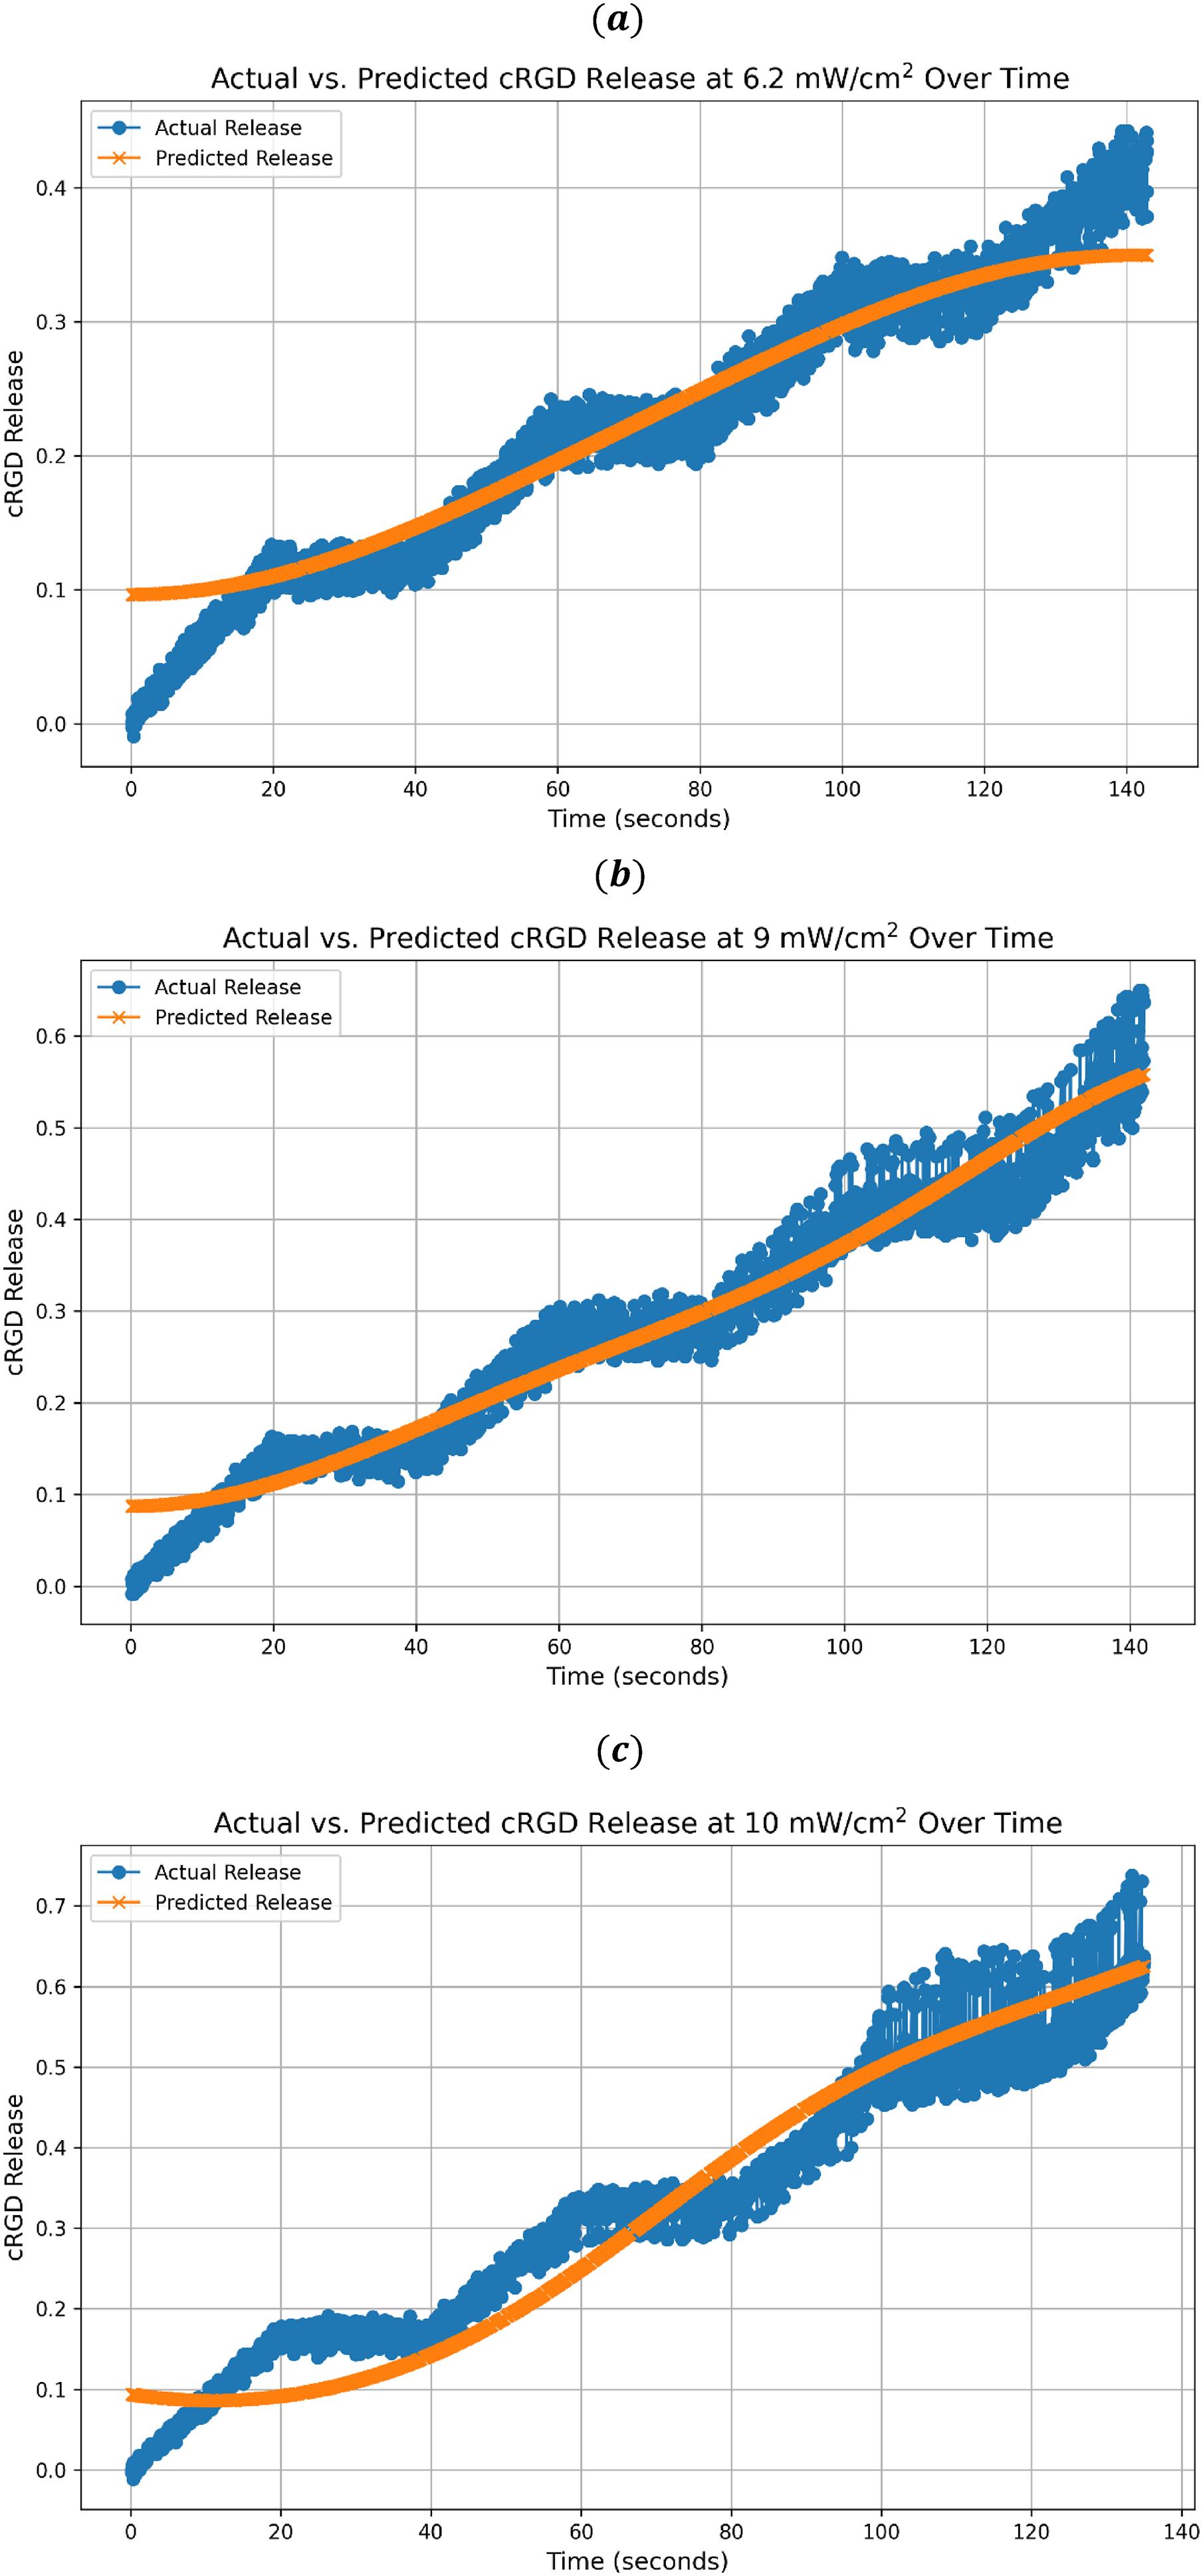
The results shown in Figures 3 and 4 reveal that both RF and SVM models exhibit commendable accuracy. However, they display distinctions in their alignment with the actual calcein release data. As shown in Figure 3, the RF model demonstrates a remarkable capacity to replicate the actual release trends closely, capturing the characteristic burst and plateau phases of liposomal drug delivery with high fidelity, especially in the initial and mid-release phases. This suggests that the RF model effectively captures the fundamental drug release mechanisms, albeit with some late-stage discrepancies. The actual release datasets exhibit more pronounced variability during the latter release stages, indicating potential experimental intricacies not fully captured by the model.

The normalized release profile of both actual and predicted cRGD release versus time using RF at (a) 6.2 mW/cm2, (b) 9 mW/cm2, and (c) 10 mW/cm2.
The normalized release profile of both actual and predicted cRGD release versus time using SVM with the RBF kernel at (a) 6.2 mW/cm2, (b) 9 mW/cm2, and (c) 10 mW/cm2.
Conversely, Figure 4 shows that the SVM model with the RBF kernel exhibits nuanced predictive capabilities. Unlike the RF model, which precisely mirrors the actual release trends, SVM's predictions exhibit slight undulations. These trends reflect an appropriate alignment with the actual release data, particularly at the 6.2 and 9 mW/cm2 power densities, indicating the model's ability to capture the release dynamics for most of the timeframe at the lower to mid-power densities. The increasing trend reflected in both the actual and predicted data points indicates a consistent and continuous release from cRGD liposomes over time, possibly converging toward a stabilization point in the latter stages. It is important to note regions where the model deviates from the actual release. These deviations, although slight, signify potential external factors or inherent subtleties in the drug release process that might not have been entirely captured by the SVM model with the RBF kernel. This presents opportunities for further refinement of the SVM model through parameter adjustments or by accounting for additional influential variables.
Prediction of Calcein Release at Power Densities of 7.5 and 8 mW/cm2
In this section, our objective was to predict the release of calcein from cRGD liposomes at a power density not previously examined experimentally. To accomplish this, we combined the release data at 6.2, 9, and 10 mW/cm2 using the Python's concatenate function. 83 The aggregated data was then saved as a CSV file, which served as the foundation for training both our RF and SVM models. Upon training, each model was tasked with making predictions on test datasets, with a focus on extrapolating to untested conditions.
Figure 5 represents the normalized release profile for predicted calcein release from cRGD liposomes using RF as the training model. Figures 5(a) and 5(b) show that the predicted release profiles at 7.5 and 8 mW/cm² closely match the actual release profiles for the nearest tested US power densities, 6 and 9 mW/cm², respectively. This occurs due to a lack of experimental release data at a wider variety of US power densities, which limits the model's ability to interpolate accurately between the known data points. This is also expected since the RF MLA is based on decision trees, by which, at each node of the tree, a decision is made by evaluating a specific feature, and the dataset is split accordingly. Since the model does not have intermediate data points to guide the predictions more accurately, it defaults to the closest known values. See Figure S5 in the Supplemental material for the normalized release profile from cRGD liposomes overtime at all three US power densities (6.2, 9 and 10 mW/cm2). We conclude that while RF is a valuable algorithm for predicting release under specific experimental conditions, its effectiveness does not extend to other conditions. These findings reveal a critical limitation of the RF model: its predictive capacity is bounded by the granularity and scope of the training data.

Normalized release profile from cRGD liposomes using RF; (a) with the predicted release at 7.5 mW/cm2 and (b) with the predicted release at 8 mW/cm2.
Figure S6(a-b) in the Supplemental material displays the normalized release profiles for the predicted release from cRGD liposomes over time, using SVM for training. These results highlight differences from the RF model, offering an alternative perspective on drug release dynamics under US influence. The SVM predictions for 7.5 and 8 mW/cm2 power densities appear to demonstrate a unique release behavior. Contrary to the RF model's predictions, which presented a more segmented and stepwise pattern reflecting the decision tree structure, the SVM model exhibits a smoother trend across the entire range of power densities. There is a characteristic initial delay in the predicted release, which ultimately reaches its highest value at completion – the latter faithful to the experimental response. This initial delay does not necessarily imply a poor prediction and is likely due to SVM's ability to capture complex, nonlinear relationships within the data through the RBF kernel. It could suggest that the SVM is capturing a real phenomenon in the data where the release process starts more slowly and then accelerates. This could be reflective of the actual behavior of the release from liposomes under US stimulation, where there might be a lag phase before the release mechanism fully activates.
The predicted release rates at both 7.5 and 8 mW/cm² are observed to surpass those at 6.2 mW/cm². Figure S6a illustrates that the predicted release at 7.5 mW/cm² begins similarly to that at 6.2 mW/cm², but diverges around the 60-s mark. At this midpoint, we observe a noticeable, yet gradual, increase in the predicted release. This could be indicative of a threshold point where the drug release accelerates, a dynamic that SVM consistently models effectively. Figure S6b, for the release prediction at 8 mW/cm2, echoes the findings of Figure S6a. It is worth noting that the SVM model predicts a shorter initial delay at this higher power density. Additionally, the profile at 8 mW/cm² demonstrates a sharper increase in release after this initial delay, overtaking the 6.2 mW/cm² release rate earlier.
In contrast to RF's challenge with interpolating data at untested power densities (7.5 and 8 mW/cm²), SVM's analysis reveals a more differentiated release profile at these intermediate densities. The SVM model, unlike RF, can provide a discernible release pattern for these intermediate power densities, which is absent in the predictions from RF. This difference is especially marked in the behavior observed at 8 mW/cm², where a more pronounced release efficiency post-initial delay is noted. This further reinforces the existence of a threshold point where drug release is accelerated but at a faster rate upon exposure to higher US power densities. This finding is significant for controlled release applications, where a delayed start followed by a rapid release phase is advantageous. Therefore, the predictions made by the SVR model at various power densities provide valuable insights for determining the most optimal settings to achieve the desired release kinetics in cRGD liposome-based drug delivery systems.
Another notable aspect of the SVM's prediction is the absence of ON and OFF pulses for the 7.5 and 8 mW/cm² rates, which are otherwise present in other power densities, as shown in Figure S6a. These pulses, corresponding to the ultrasound's activation and deactivation, are not evident in the 7.5 and 8 mW/cm² predictions. This is likely due to several factors. Firstly, the absence of pulses could be related to the nature of the RBF kernel used in SVM, which may inherently produce smoother predictions that do not capture abrupt changes well. The model may be less sensitive to the pulsed nature of the US stimulus at the tested power densities, potentially due to the kernel's handling of the data's nonlinearity. This kernel is good at handling smooth transitions and may not represent sharp discontinuities in the data without rigorous fine-tuning or if the underlying feature space does not support it. One example of what might cause the feature space to fail in capturing sharp discontinuities is insufficient data points. If the dataset does not include enough ON/OFF pulsing examples at specific power densities, the model will not learn to predict these events. Similarly, if the data around the ON/OFF events is sparse or noisy, the SVM may be unable to define a clear boundary representing these events.
In comparison, RF's decision-making process becomes constrained by the sparsity of training data. The absence of sufficient data points across a broader range of power densities limits its ability to capture finer dynamics in the release that may occur at lower and intermediate power densities. This lack of granularity in the data reduces the precision of RF's predictive capacity in scenarios where new, untested conditions are introduced. If more experimental data were available across a broader range of power densities, the RF model would have a more detailed set of training data from which to make more accurate splits in the decision trees. Each new data point would help the model better understand how small changes in US intensity affect the release kinetics, leading to more precise predictions. Specifically, RF would be able to build trees that more finely distinguish between small differences in release behavior, rather than relying on coarse generalizations between more distant power density values. However, even with more data, it is important to recognize a limitation of RF in this application. As RF splits the data into distinct branches, it performs better when the relationships between variables are somewhat linear or stepwise, as seen in more uniform power densities (like 9 and 10 mW/cm²). In cases where the release dynamics follow highly nonlinear patterns, RF may still struggle compared to algorithms like SVM, which are better suited for capturing complex, continuous relationships. Therefore, while additional data would improve RF's interpolation capacity, it might not completely resolve the challenges presented by more intricate nonlinear dynamics.
On the other hand, SVM operates on fundamentally different principles. SVM uses the RBF kernel function to transform the data into a higher-dimensional space, which allows the model to capture more intricate relationships between features, such as subtle changes in ultrasound intensity and time, and their effects on the drug release kinetics. SVM's strength lies in its ability to handle nonlinear relationships, making it better suited for scenarios where the release profile exhibits gradual changes or nonlinear patterns that are difficult to split accurately using decision trees. This is particularly relevant at lower power densities, where the release kinetics may not follow simple linear relationships. SVM can do well in these situations by using a continuous decision boundary that adapts to the underlying complexity of the data. This can provide a more refined prediction for these dynamic, nonlinear interactions. However, SVM does come with its own set of limitations. While SVM is more adept at capturing nonlinear dynamics, it can struggle with larger datasets and higher dimensionality, as it tends to be computationally expensive. In this particular study, where a large dataset with multiple features is used to model release, SVM's predictive performance struggled to replicate the burst-release pattern exhibited throughout the actual release data. RF is highly scalable and efficient with much larger datasets due to its ability to parallelize tree-building processes.
Conclusions
This study provides a comparative analysis of RF and SVM for predicting calcein release from ultrasound-targeted liposomes at varying power densities. RF showed superior performance at higher power densities, capturing linear and uniform release patterns with high accuracy (R² > 0.96), making it well-suited for real-time, high-precision drug delivery applications. However, RF's effectiveness was limited by the granularity of the dataset, requiring more intermediate data points to better model subtle release variations at lower power densities. Conversely, SVM with the RBF kernel performed better at lower and intermediate power densities, capturing the complex, nonlinear dynamics influenced by the physicochemical properties of specific targeting moieties like Herceptin and hyaluronic acid. This makes SVM ideal for applications requiring controlled or sustained drug release where maintaining consistent therapeutic levels is essential. The findings emphasize that neither RF nor SVM is universally superior; their effectiveness depends on the specific release conditions. RF is preferable for linear, high-power-density scenarios and for modeling larger datasets, while SVM is more adept at handling nonlinear interactions at intermediate conditions. This highlights the need for careful algorithm selection based on the nature of the drug delivery system and experimental parameters. The study's implications for precision medicine are significant. Accurate prediction of drug release under controlled ultrasound conditions can facilitate more personalized treatment protocols and, thus, optimize drug delivery for individual patient conditions. Future work should focus on expanding datasets to improve model training and exploring hybrid approaches that combine RF and SVM's strengths for better predictive accuracy across a broader range of conditions.
Supplemental Material
sj-docx-1-tct-10.1177_15330338241296725 - Supplemental material for Predicting Calcein Release from Ultrasound-Targeted Liposomes: A Comparative Analysis of Random Forest and Support Vector Machine
Supplemental material, sj-docx-1-tct-10.1177_15330338241296725 for Predicting Calcein Release from Ultrasound-Targeted Liposomes: A Comparative Analysis of Random Forest and Support Vector Machine by Ibrahim Shomope, Kelly M. Percival, Nabil M. Abdel Jabbar and Ghaleb A. Husseini in Technology in Cancer Research & Treatment
Footnotes
Acknowledgments
The authors would like to acknowledge the financial support of the American University of Sharjah Faculty Research Grants.
Data Availability Statement
The data that support the findings of this study are available from the corresponding author upon reasonable request.
Declaration of Conflicting Interests
The authors declared no potential conflicts of interest with respect to the research, authorship, and/or publication of this article.
Funding
This research was funded by the American University of Sharjah Faculty Research Grants, grant number FRG23-E-E44.
Faculty Research Grants- American University of Sharjah, (grant number FRG23-E-E44).
Institutional Review Board Statement
Not applicable.
Informed Consent Statement
Not applicable.
Supplemental Material
Supplemental material for this article is available online.
References
Supplementary Material
Please find the following supplemental material available below.
For Open Access articles published under a Creative Commons License, all supplemental material carries the same license as the article it is associated with.
For non-Open Access articles published, all supplemental material carries a non-exclusive license, and permission requests for re-use of supplemental material or any part of supplemental material shall be sent directly to the copyright owner as specified in the copyright notice associated with the article.