
Abstract
Radiographic changes occur in over half of patients treated with stereotactic body radiotherapy (SBRT) to the lung, correlating histopathologically with injury. We quantified radiographic density changes (ie, fibrosis) at 3, 6, and 12 months and investigated the relationship between these volumes and clinical and dosimetric parameters. The study population consisted of patients treated with SBRT to the lung for stage I primary lung cancers (n = 39) or oligometastatic lesions (n = 17). Fractionation schemes included 3 fractions of 12, 14, or 18 gray (Gy) and 4 fractions of 12 or 12.5 Gy prescribed to cover 95% of the planning target volume (PTV). Planning computed tomography (CT) scans were rigidly registered to follow-up CT scans obtained at intervals of 3, 6, and 12 months. Fibrotic volumes were contoured on the follow-up scans. Associations between the volume of fibrosis and clinical and dosimetric parameters were investigated using univariate linear regression. Scans were available for 65 and 47 lesions at 6 and 12 months, respectively. Age, years since quitting smoking, and GOLD Global Initiative for Chronic Obstructive Lung Disease score were significantly associated with increasing volume of fibrosis (P < .05). Total dose, dose per fraction, PTV, and volumetric parameters (V0-V55) were also significantly associated with increasing volumes of fibrosis (P < .01). For dosimetric parameters, the effect was largest for V55. Age, significant smoking history, and GOLD score were significantly associated with increasing volumes of fibrosis following SBRT. In a multivariate model adjusted for age and smoking history, V10 through V50 and PTV size remained significant predictors of fibrotic volume. Further, there is a strong dose–response relationship between the volume of lung exposed to a certain dose and the fibrotic volume. The predominant kinetic patterns of fibrosis demonstrate peaking fibrotic volumes at 6 and 12 months. These results provide insight for expectations of fibrosis after SBRT.
Keywords
Introduction
Stereotactic body radiotherapy (SBRT) is a validated treatment modality for both early-stage primary lung cancer and pulmonary oligometastases, with local control rates paralleling those of surgical resection. 1,2 Stereotactic body radiotherapy is particularly appropriate for patients who are poor surgical candidates or prefer noninvasive procedures. Rates of clinically significant radiation pneumonitis (RP) following SBRT are low, with grade ≥3 RP occurring in 10.4% to 16.3% of patients with peripheral lesions. 1,2 Although pulmonary dose–volume toxicity relationships following conventionally fractionated radiotherapy are better understood, they are not as well defined for SBRT. 3,4 Dosimetric parameters such as V2.5 through V50 have been associated with grade 2 RP in some series 5,6 but not in others. 7 Additionally, long-term consequences remain unknown. Based on collective experience with conventional fractionation, radiation effects can be divided into early RP and late fibrosis. Imaging density changes occur in over 50% of patients treated with SBRT, 8 –10 and changes in computed tomography (CT) density have been shown to correlate histopathologically with fibrosis. 11,12 Because no clinical tests appear to predict clinical changes in a robust and reproducible fashion, radiographic changes constitute a valuable proxy for fibrosis.
Predictive factors for the extent of fibrosis following SBRT remain an area of active study, with no predictive clinical factors identified. 13 –18 Such factors would help guide patient selection, while dosimetric factors will guide plan optimization. Further, since young patients with oligometastases are receiving SBRT more frequently, a better understanding of chronic complications is needed. We sought to identify clinical and dosimetric parameters predictive of fibrotic volume up to 1 year post-SBRT in a cohort of patients with either early-stage primary lung cancer or pulmonary oligometastases. We hypothesized that there would be a strong dose–volume effect for radiation fibrosis.
Materials and Methods
Patient Selection
The study population consisted of patients treated with SBRT to the lung for either stage I primary lung cancers (n = 39) or pulmonary oligometastases (n = 17) between October 2008 and January 2012 at the University of California, Los Angeles. Patients with metastatic disease had primary diseases including colorectal adenocarcinoma, 4 soft tissue sarcoma, 4 renal cell carcinoma, 3 bladder urothelial carcinoma, 2 breast adenocarcinoma, 1 hemangiopericytoma, 1 melanoma, 1 and uterine carcinosarcoma. 1 Patients were eligible for inclusion in this study only if they had follow-up CT scans at least 3 and 6 months post-SBRT. Overall, follow-up data were available for 65 and 47 lesions at s6 12 months, respectively. For patients with chronic obstructive pulmonary disease (COPD), pulmonary function test data were used to determine the GOLD score, a validated scoring metric for COPD severity. 19
Radiation Planning and Treatment
All treatment planning scans were 4-dimensional scans under free-breathing conditions using a Siemens SOMATOM Definition AS scanner (Siemens Healthcare Diagnostics, Los Angeles, CA) with intravenous contrast and 1.5-3 mm thick slices. The internal target volume (ITV) was contoured on the iPlan system (Brain Lab, Munich, Germany) using images from the 0%, 50%, and 100% time points during the breathing cycle. The planning target volume (PTV) was generated as a 3 mm anteroposterior, 3 mm mediolateral, and 6 mm superoinferior expansion of the ITV. Prescription dose and treatment planning criteria were based on guidelines provided by protocols from the Radiation Therapy Oncology Group 20,21 0618 and Chang et al. 22 Fractionation schemes included 4 fractions of 12 gray (Gy; n = 2), 3 fractions of 12 Gy (n = 6), 14 (n = 3), or 18 Gy (n = 49), and 4 fractions of 12.5 Gy (n = 9), prescribed to cover 95% of the PTV. Dose calculations were performed using the Monte Carlo algorithm, and the dose calculation grid size was 2 mm with 1% variance. Three lesions were treated with volumetric modulated arc therapy, 5 with conformal arc therapy, 12 with dynamic arc therapy, and 45 with intensity-modulated radiotherapy. Treatments were delivered using 8 to 12 noncoplanar beams of 6 MV energy photons, without gating. All patients received treatment on a Novalis Tx linear accelerator (BrainLab, Munich, Germany). 23 –25 Daily image guidance was performed using stereotactic x-ray images (ExacTrac) and cone-beam CTs. Image guidance was not used to manage intrafraction motion.
Follow-Up Scans, Image Registration, and Regions of Injury
Computed tomography scans were conducted for all patients at 3 (range, 4-20 weeks) and 6 (range, 21-39 weeks) months, respectively. These were generally obtained using multidetector 64-slice scanners (Siemens Healthcare, Los Angeles) with 1-, 3-, and 5-mm reconstructions. For 47 lesions, a third scan at 12 months (range, 40-58 weeks) was also available. The scans were rigidly registered to the planning CT via alignment with the carina. Two investigators (AUK and PL) contoured fibrotic volumes (Figure 1).

Schematics of contouring. The treatment planning computed tomography (CT) is shown on the left. The target and contoured regions of fibrosis are shown at 6 months and 12 months. Superimposed isodose lines are shown in the bottom row. The follow-up scans were registered rigidly to the planning CT.
Statistical Analysis
The primary study hypothesis concerning the association between clinical and dosimetric parameters and fibrotic volume was tested using linear mixed effect repeated measure models. 26 –29 Mixed effect models are based on generalized linear models that can easily handle time-dependent covariates. For example, the model takes into consideration repeated measures of fibrotic volume over time. The within-patient correlations among longitudinal outcome measures were modeled as random effects to generate random time slopes for each patient. We used the Aikake Information Criterion to evaluate model fitting and adopted a restricted maximum likelihood approach for estimating the parameter in mixed effect models for repeated measured data. Time was taken into account for each independent factor. The model took into account heterogeneous slopes between groups over time. All analyses were performed using SAS software (v9.3, SAS Institute, North Carolina).
Results
Patient Characteristics
Patient characteristics are listed in Table 1. Most lesions (71%) occurred in patients who had smoked and the mean pack-year history was 48 (range, 1-100). Most lesions (66.7%) occurred in patients who did not have comorbid lung conditions, but a substantial minority (20.3%) were in patients with COPD. Of the 14 patients with COPD, 9, 2, and 3 of these patients had GOLD score I, II, and III disease, respectively. Only 5 (8.9%) patients experienced grade 2 RP. Sixty-eight percent of lesions were treated with doses of 18 Gy per fraction.
Characteristics.

Abbreviations: Gy, gray; COPD, chronic obstructive pulmonary disease.
Clinical and Dosimetric Parameters Associated With Fibrosis
Results of a univariate linear mixed effect model from analysis of clinical and dosimetric parameters are shown in Table 2. Estimate size refers to the expected absolute increase in fibrotic volume, in cm3, caused by an increase in the dependent factor, at a time point of 1 year. Gender, race, coronary artery disease, and smoking status (ever smoked or not) were not associated with volumes of fibrosis. Age (in 10 year increments; P < .0001), years since quitting smoking (P = .0015), and GOLD score (P = .017) were all significantly associated with increasing volumes of fibrosis (P < .0001). The association with pack-years smoked was of borderline significance (P = .05). The total dose and PTV size were significantly associated with the volume of fibrosis (P < .0001). Further, V5 through V55 were significantly associated as well (P < .0001 for all except V55, P < .01). A significant increasing trend was observed for V5 to V55 (see Figure 2). Finally, both dose per fraction (comparing doses per fraction of 18 Gy with those <18 Gy) and central versus peripheral location were significantly associated with fibrotic volumes (P < .05), whereby patients with larger doses per fraction and peripheral lesions had greater volumes of fibrosis. Note that for assessment of tumor location (upper versus lower lobe), lesions in the right middle lobe were counted as part of the “lower lobe” group of lesions.
Absolute Increase In Fibrotic Volume By Parameter In a Univariate Analysis.a
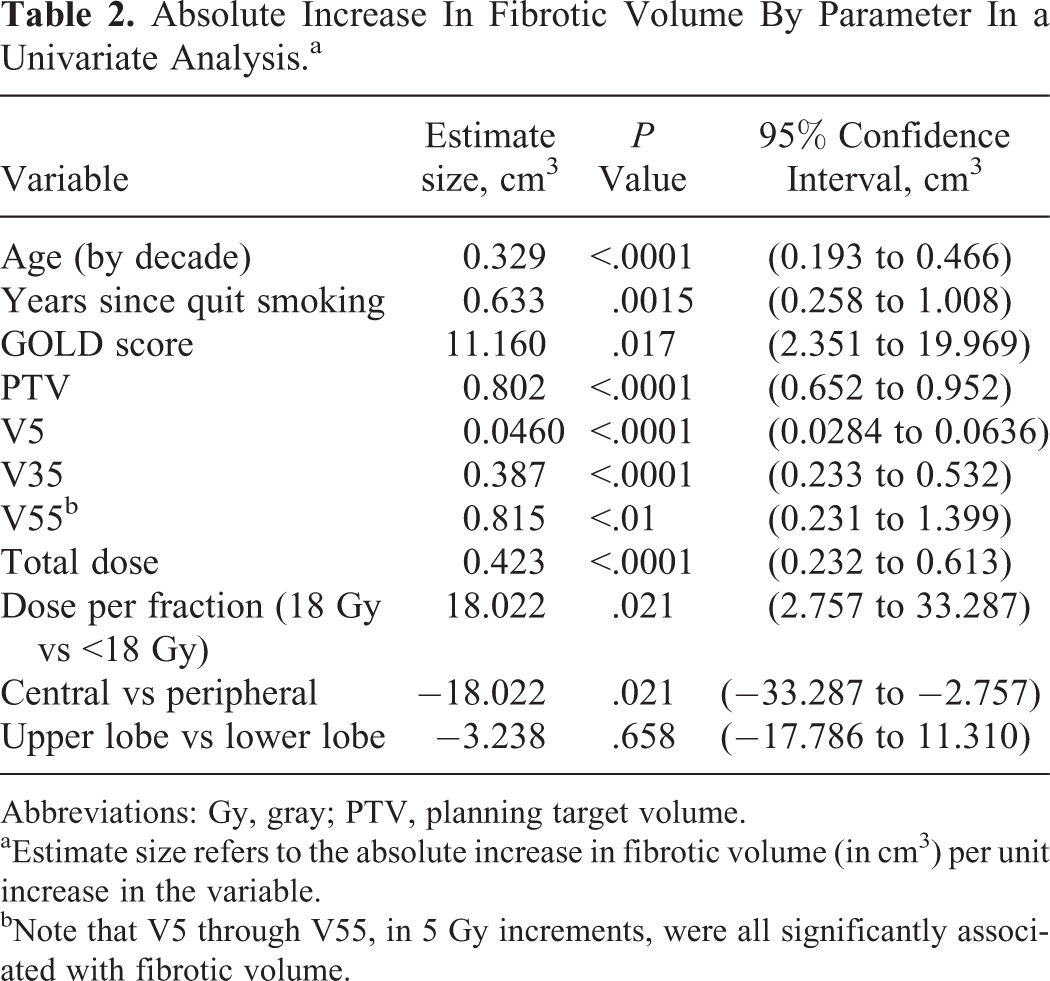
Abbreviations: Gy, gray; PTV, planning target volume.
aEstimate size refers to the absolute increase in fibrotic volume (in cm3) per unit increase in the variable.
bNote that V5 through V55, in 5 Gy increments, were all significantly associated with fibrotic volume.

Fibrotic volume change and dosimetric parameters. The y-axis indicates the size of the estimate from univariate regression of a linear mixed effect model, for example, the change in cm3 of the fibrotic volume resulting from a single cm3 change in V60 Gy. The associations of V5 through V55 with fibrotic volume are statistically significant; that is, there is a significant dose–response effect for fibrosis through a large dose range.
Results of a multivariate analysis controlling for age and pack-years of smoking are shown in Table 3. The size of the PTV and V10 through V50, but neither V5 nor V55, remained significant predictors of fibrotic volume. Dose per fraction and total dose were also no longer significant predictive factors for fibrotic volume. A graphical representation of true fibrotic volume (ordinate) versus the predicted fibrotic volume (abscissa) is shown in Figure 3. Of note, the best correlation between the predicted and actual fibrotic volumes is seen in the intermediate dose ranges of V15 to V35.
Absolute Increase In Fibrotic Volume By Parameter In a Multivariate Analysis.a

Abbreviations: Gy, gray; PTV, planning target volume.
aFor this multivariate analysis, parameters and outcomes were adjusted for pack-years smoking and age. There were too few patients with COPD to include GOLD score in the multivariate analysis.
bNote that V10 through V50 in 5 Gy increments were all significantly associated with fibrotic volume.

Comparison of true fibrotic volumes (ordinate) versus predicted fibrotic volumes (abscissa) in the setting of multivariate modeling, for various V0 through V55 parameters.
Time Course of Fibrosis
Among the 47 lesions with follow-up scans at 12 months, the fibrotic volumes displayed 3 kinetic patterns (see Figure 4). In all, 9 (19%) displayed an “acute” (peak volume at 3 months), 25 (53%) a “delayed” (peak volume at 6 months), and 13 (28%) a “late” (peak volume at 12 months) predominance. Of the 10 lesions in patients with COPD, 7 displayed a “delayed” and 2 a “late” predominance.

Kinetic patterns of fibrosis. Three general patterns are observed based off when the peak fibrosis occurs: acute predominance (3 months), delayed predominance (6 months), and late predominance (12 months).
Discussion
To our knowledge, this study is the first to identify predictive clinical factors—age, smoking history, PTV size, and GOLD score—for the volume of pulmonary fibrosis following SBRT. This study also demonstrated a clear dose–response effect and identified both total dose and the volume of normal lung exposed to doses ranging from 5 to 55 Gy as predictive parameters.
Several investigators have reported on radiographic injury following SBRT. 13 –17,18,30 In all of these studies, the rate of clinically significant Grade ≥2 RP ranged from 0% to 16%. Two studies evaluated radiation density changes as binary events, 13,14 while the remainder looked at volume, 15 changes in CT density, 16,17 and spatial parameters. 18 Aoki et al found that the minimum dose associated with the development of radiation-induced changes ranged from 16 to 24 Gy and was inversely associated with V20. 13 Kyas et al found that equivalent uniform dose, mean dose, V7, and V10 were predictive of developing density changes. 14 Hof et al derived a linear model for fibrotic volume after single fraction treatment, wherein for doses above 6 Gy, increasing the dose by 1 Gy increased the volume of density change by 2.08%. The maximum changes were seen at 4 months. However, the authors only included the 26 of 50 patients who developed radiologic evidence of damage in their analysis. 15
More recently, Palma et al showed that increases in density after SBRT were associated with dose, time after radiation, and PTV size. Most changes were seen in patients receiving >20 Gy, with a plateau at 30 Gy. 16,30 Diot et al subsequently showed that density increases linearly with dose until 35 Gy, with the highest rate of increase at 6 months above 20 Gy. 17 In a further subset analysis, Vinogradskiy et al found that, on average, the centroid of the fibrosis region was shifted 2.6 cm from that of the GTV. 18 In 10.9% of cases, however, the centroid was shifted over 5 cm. The investigators noticed that the fibrotic volume declined until 18 months and then plateaued. 18
In contrast, we did not observe a plateau in the dose–response effect and we observed 3 different kinetic patterns for fibrotic volumes. Regarding the dose–response effect, we observed a significant association between volumes of the lung exposed to doses as low as 5 Gy and the volume of fibrosis. Because the V5 can be associated with the V55, the association between V5 and the volume of fibrosis could represent an indirect link of each parameter with V5. This could explain why the magnitude of the change in fibrotic volume manifested by a change in the volume of lung exposed to a given amount of radiation increases greatly in magnitude from 5 Gy to 55 Gy (Tables 2 and 3). Alternatively, our finding could suggest that there is no threshold dose, or a very low threshold dose, for radiation fibrosis (ie, fibrosis can occur even if normal lung receives a very low dose of radiation). In order to better characterize the dosimetric contributions to fibrotic volumes, we recently analyzed different dose contributions to the volumes of fibrosis in a subset of 24 patients treated with 54 Gy in 3 fractions. Specifically, we were able to demonstrate that the volume of lung exposed to 35 Gy contributed significantly to the region of fibrosis seen at later time points. 25 These data, along with the present findings, suggest that fibrosis does not have a threshold dose below which it does not occur and that low-dose spillage is important. Additionally, it may be the case that dose per fraction, rather than total dose, is more important. Indeed, the estimate size for doses of 18 Gy per fraction, compared with lower doses, is nearly 30 times greater than the estimate size for total dose. However, neither parameter retains significant predictive value in the multivariate analysis. Notably, because only peripheral lesions received doses per fraction of 18 Gy, the estimate size in our models for central versus peripheral location is identical. Because 68% of the lesions in the cohort were treated with 18 Gy, our study was not powered to further differentiate between subsets of doses per fraction less than 18. We did not identify any correlation between fibrotic volume and whether the lesion was in the upper or lower lobe.
The lack of a plateau in this study and in Hof et al study, 15 which also used volume as an end point, may reflect a difference in the selected end point from other reports. It should be noted that in this study, the volume of radiographic fibrosis was correlated with several clinical parameters, a novel finding that underscores that patients receiving the same physical dose of radiation can have different physiologic responses.
This study is also the first to our knowledge to demonstrate a significant association between the volume of radiation-induced fibrosis and the severity of COPD. Such a relationship has, however, been suggested earlier. 31 –33 In a series of 128 patients treated with SBRT, Takeda et al reported grade 3 RP in 7 patients, 2 of whom had COPD. 31 The association reported here is particularly important, as patients with severe COPD are ideal candidates for SBRT (ie, inoperable). Interestingly, patients with COPD tended to display a “delayed predominance” pattern of radiographic injury. Indeed, the existence of different kinetic patterns suggests there could be interesting radiobiological differences between the responses to radiation in different patients, perhaps governed by a relative proclivity to acute inflammation versus chronic fibrosis.
Our study had several limitations. First, the radiographic density changes did not have clinical correlates. Only 5 patients experienced self-limited grade 2 RP, likely independent of postradiation fibrosis. This low RP incidence was likely guided by patient selection, but in general, the reported incidence of clinically significant RP after SBRT is on the order of 10% to 20%. 1,2,7 On the other hand, fibrotic changes occur in 50% of patients after SBRT, 8 –10 and thus most radiographic changes do not have a clinical correlate at 1 year. Pulmonary function testing was not routinely performed, but recent data suggest that functional changes are minor in this time frame. 34,35 However, animal models for correlating radiographic density changes with histopathologic and functional changes in the lung have been reported, 12 and it is conceivable that radiographic fibrosis will have long-term functional consequences. Additionally, understanding post-SBRT changes is important in distinguishing recurrent lesions from fibrosis. 36 In fact, misdiagnosis could be a potential source of error in this study. However, in this cohort, the 1- and 2-year local control rates were 100% and 95.5%, respectively. In 4 cases of serially increased PET on FDG, lesions were biopsied and these all showed radiation change. 37 The possibility of misdiagnosing recurrence as fibrosis cannot be ruled out, however, we are less concerned. Instead, the data suggest that understanding the kinetic patterns of fibrosis may be particularly important, as patterns other than expected may prompt clinician to query the possibility of recurrence.
Additionally, the contours of fibrotic regions were done by a single investigator and verified by another; therefore, interobserver variability could have affected our results. For quality control, contours for 7 patients were performed in an independent, blinded fashion. The volumes differed on average by only 4.5 cm3, and overlapped geometrically (Figure 5), so we do not feel interobserver variability had a major effect.

Independent contours of fibrotic volumes agree. Contours were performed in an independent, blinded fashion for 7 patients. As an example, a pair of contours is shown on the left, and the contoured volumes for the 7 patients at 6 months are shown on the right.
Finally, we did not utilize deformable registration (DR) when contouring fibrotic volumes. Some investigators have argued that, due to respiratory motion causing either inflation or deflation of the lung parenchyma, DR should be utilized when comparing CT scans. 38,39 However, in a series examining different registration algorithms for 60 pulmonary nodules compared to follow-up scans at an average of 2 years follow-up, Gu et al showed that rigid registration (RR) had equivalent accuracy compared with DR. 40 In their series, Diot et al found discrepancies of <5% for doses less than 60 Gy in a subset of their patients when comparing DR and RR. 17 We performed a subset analysis using DR in 23 patients for geometric modeling purposes. 41 When using DR-derived volumes in our linear effects model, we found the same statistical associations as with RR-derived volumes. We also physically overlaid the pairs of contours to assess for overlap and found that contours derived from RR and DR overlapped with each other and with the isodose lines.
Conclusion
This study indicates that there are several clinical and dosimetric parameters that can be used to predict the extent of radiation fibrosis following SBRT at up to 1 year. Namely, age, significant smoking history, GOLD score, PTV size, total dose, and volume of lung exposed to doses ranging from 5 to 55 Gy are predictive of fibrosis. However, the strength of the prediction increases as larger volumes of lung are exposed to increasing doses, consistent with a strong dose–response effect. There are also 3 kinetic patterns of fibrotic changes following SBRT. This knowledge may help radiation oncologists when assessing patients for long-term complications and recurrences following SBRT and can also help optimize plans by underscoring the necessity of careful attention to dose falloff outside the PTV. Our group is actively assessing in more detail the geometric parameters of the density changes and how these relate to the dose–volume profile of the PTV and normal lung. As SBRT becomes increasingly employed, we anticipate that these fibrotic changes will have clinical implications.
Footnotes
Abbreviations
Authors’ Note
All authors certify that this article has not been published in whole or in part nor is it being considered for publication elsewhere.
Declaration of Conflicting Interests
The author(s) declared no potential conflicts of interest with respect to the research, authorship, and/or publication of this article.
Funding
The author(s) received no financial support for the research, authorship, and/or publication of this article.