
Abstract
Introduction
Nab-paclitaxel is a mainstay of treatment for a broad spectrum of cancers and is typically administered over multiple cycles. The anti-mitotic effects of nab-paclitaxel are well-established. However, the systemic impact of consecutive treatment cycles on host physiology remains largely unexplored. Of particular interest is the gut microbiota and its regulatory role in drug metabolism. This study aimed to investigate the effects of consecutive nab-paclitaxel chemotherapy cycles on gut microbiota composition, intestinal barrier function, and pharmacokinetic (PK) behavior in rats.
Methods
Twenty-four Sprague–Dawley rats were randomly assigned to one-, two-, or three-cycle chemotherapy groups and received nab-paclitaxel via tail vein injection. Plasma drug concentrations were measured by Liquid Chromatography–Tandem Mass Spectrometry (LC–MS/MS), gut microbial composition was analyzed using 16S Ribosomal RNA (16S rRNA) sequencing, and hepatic CYP3A and CYP2C expression was assessed by Western blot and Quantitative Polymerase Chain Reaction (qPCR).
Results
Consecutive nab-paclitaxel administration significantly altered the gut microbiota, decreasing Actinobacteriota and Firmicutes while increasing Proteobacteria and Cyanobacteria in a cycle-dependent manner. Microbial diversity indices, including Observed species and Rao's quadratic entropy, increased after multiple cycles. Pharmacokinetic analysis showed that clearance, mean residence time, and volume of distribution decreased, whereas Area Under the Curve (AUC) and Maximum Plasma Concentration (Cmax) increased significantly after repeated dosing. However, no significant differences were observed in CYP3A1 or CYP2C11 protein or Messenger RNA (mRNA) expression, suggesting that nab-paclitaxel may influence pharmacokinetics through non-CYP–dependent pathways potentially mediated by gut microbiota–host interactions.
Conclusion
In conclusion, consecutive nab-paclitaxel chemotherapy cycles induce gut microbiota dysbiosis and alter pharmacokinetic profiles via non-CYP–dependent mechanisms, highlighting the critical role of the microbiota–gut–liver axis in chemotherapeutic drug disposition and providing a theoretical basis for microbiota-targeted interventions to optimize chemotherapy efficacy.
Introduction
Chemotherapy remains one of the most effective strategies for cancer treatment, significantly improving patient survival across various malignancies. However, its therapeutic benefits are often accompanied by adverse effects, particularly gastrointestinal toxicity, which severely compromises patients’ quality of life and treatment compliance. 1 The impact of chemotherapeutic agents on the gut microbiota is increasingly recognized as a critical factor influencing both efficacy and toxicity. Chemotherapy can disrupt intestinal epithelial integrity, suppress microbial growth, and alter bacterial metabolic activity, leading to dysbiosis. 2 Such disturbances in microbial composition and function may further influence drug absorption, metabolism, and systemic exposure. Emerging evidence suggests that modulating the gut microbiota may enhance chemotherapeutic efficacy while mitigating toxicity, underscoring the need to better understand the dynamic interplay between chemotherapeutic drugs and the intestinal microbial ecosystem.3,4
Paclitaxel, a classic microtubule-stabilizing agent, promotes tubulin polymerization and inhibits depolymerization, leading to G2/M-phase arrest and apoptosis in tumor cells. It has demonstrated broad clinical efficacy against breast, ovarian, and non–small cell lung cancers. 5 Nevertheless, conventional paclitaxel formulations require polyoxyethylated castor oil and ethanol as solubilizers, which are associated with hypersensitivity reactions and neurotoxicity, thereby limiting their clinical use. 6 To overcome these limitations, nab-paclitaxel (albumin-bound paclitaxel) was developed using human serum albumin as a carrier to facilitate receptor-mediated transport via gp60 and SPARC pathways. This formulation enhances intratumoral drug accumulation while avoiding solvent-related toxicities and improving overall tolerability.7,8
Although nab-paclitaxel has been widely adopted in clinical oncology, its PK behavior under repeated or continuous administration remains insufficiently characterized. In clinical settings, patients typically receive multiple chemotherapy cycles, which may cause drug accumulation, metabolic adaptation, or altered systemic exposure, potentially affecting therapeutic outcomes and safety profiles. Furthermore, whether consecutive nab-paclitaxel administration modulates the gut microbiota and whether such changes contribute to altered drug disposition have not been comprehensively explored.9–11
In this study, we established a rat model to simulate clinically relevant consecutive chemotherapy cycles. To eliminate the potential impacts of the estrous cycle on drug-metabolizing enzyme activity, intestinal permeability, and gut microbiota composition, male Sprague–Dawley rats were selected. The rats received one, two, or three cycles of nab-paclitaxel treatment. Pharmacokinetic parameters, including AUC, Cmax, Time to Maximum Concentration (Tmax), Half-life (t1/2), and clearance, were evaluated using LC–MS/MS. The gut microbiota composition and diversity were analyzed through 16S rRNA high-throughput sequencing to assess alterations in microbial structure and function following repeated dosing. This work aims to elucidate how consecutive nab-paclitaxel chemotherapy affects both gut microbiota and drug pharmacokinetics, providing experimental evidence for optimizing dosing regimens and minimizing treatment-related toxicity.
Materials and Methods
The reporting of this study conforms to ARRIVE 2.0 guidelines. 12
Chemicals and Reagents
Paclitaxel reference standard (purity 99.8%, Lot number 100382-201904,National Institutes for Food and Drug Control, China) and propranolol reference standard (purity 94.3%, Lot number 130593-202004, National Institutes for Food and Drug Control, China) were used. Nab-paclitaxel injection (albumin-bound, 100 mg,Lot number B042308606) was purchased from CSPC Ouyi Pharmaceutical Co., Ltd (China). Sodium chloride injection (0.9%, Lot number 2406231402) and heparin sodium injection (Lot number 230416-2) were obtained from Shijiazhuang Fourth Pharmaceutical Co., Ltd (China) and Maanshan Fengyuan Pharmaceutical Co., Ltd (China), respectively. HPLC-grade methanol and acetonitrile were obtained from Fisher Scientific (USA), and formic acid (HPLC grade) from Aladdin (USA). Agarose gel reagents (Lot number 75510-019), electrophoresis buffers (Lot number AM9870), DNA markers (Lot number DL2000), and Quant-iT PicoGreen dsDNA Assay Kit (Lot number P7589) were purchased from Invitrogen (USA). TruSeq Nano DNA Library Prep Kit (Lot number FC-121-4001) was obtained from Illumina (USA). RIPA lysis buffer (Lot number G2002-100ML), protease inhibitor cocktail (Lot number G2006-250UL), PMSF (Lot number G2008-1ML), phosphatase inhibitor (Lot number G2007-1ML), and BCA protein assay kit (Lot number G2026-200 T) were obtained from Servicebio (China). SDS-PAGE loading buffer (Lot number G2075-100ML), precast gels (Lot number G2043-50T), prestained protein markers (Lot number G2087-250UL), PVDF membranes (Lot number WGPVDF45), blocking solution (Lot number G2052-500ML), and ECL chemiluminescence kits (Lot number G2014-50ML) were also purchased from Servicebio. Primary antibodies against CYP3A1 (Lot number pa3-034) and CYP2C11 (Lot number 231-330) were obtained from Thermo Fisher Scientific (USA) and Antibodies Online, respectively. HRP-conjugated secondary antibodies (Lot number GB23303) and β-actin antibodies (Lot number GB11001) were purchased from Seville Biotechnology (China). For RNA extraction and qPCR, RNA extraction reagent (Lot number G3013), chloroform substitute (Lot number G3014), isopropanol (Lot number 80109218), ethanol (Lot number 10009218), nuclease-free water (Lot number G4700), RNA dissolving solution (Lot number G3029), SweScript All-in-One RT SuperMix (Lot number G3337), SYBR Green qPCR Master Mix (Lot number G3326), and primers were purchased from Seville Biotechnology (China).
Experimental Instruments
The following instruments were used in this study: liquid chromatography system LC-20AD (Shimadzu, Japan) coupled with API4000 + triple quadrupole mass spectrometer (AB Sciex, USA); vortex mixer XW-80A (Shanghai Medical University Instrument Factory, China); high-speed centrifuge 40166599 (Abbott Laboratories, USA), high-speed refrigerated centrifuge SLX-1024F, and microcentrifuge SMC-5000F (Servicebio, China); analytical balance CPA225D (Sartorius, Germany); low-temperature freezer MDF-U3396S (Sanyo, Japan) and low-temperature tissue grinder KZ-III-FP (Servicebio, China); vertical electrophoresis unit SVE-2 and transfer electrophoresis unit SVT-2 (Servicebio, China); ultrasonicator JY92-11N (Ningbo Xinzhi Bio, China); chemiluminescence imaging system SCG-W3000 and gel imaging system BG-gdsAUTO(130) (Servicebio and Beijing Baijing Biotechnology, China); microplate readers RT-6100 (Rayto, China) and FLX800T (BioTek, USA); UV–Vis spectrophotometer NC2000 (Thermo Scientific, USA); agarose gel electrophoresis system DYY-6C (Beijing LiuYi Biotechnology, China); PCR thermal cycler 2720 (ABI, USA) and real-time PCR system CFX Connect (Bio-Rad, USA); Bioanalyzer 2100 (Agilent, USA); mini fluorometer QuantiFluor™-ST (Promega, USA); and NovaSeq 6000 sequencing platform (Illumina, USA).
Experimental Animals
Specific-pathogen-free (SPF) male Sprague–Dawley rats, weighing 200 ± 10 g, were obtained from Beijing Huafu Kang Biotechnology Co., Ltd (Beijing, China; license no. SCXK[Beijing]2024-0003). Rats were group-housed under specific pathogen-free conditions, with animals from the same experimental group cohabiting in a single cage, while cages of different groups were maintained separately. They were allowed free access to standard chow and water, and kept under controlled environmental conditions with a temperature of 25 ± 5 °C and a relative humidity of 55 ± 10%. Rats were anesthetized by intraperitoneal injection of tribromoethanol at a dose of 0.2 ml per 10 g body weight. Euthanasia was performed by exsanguination under deep anesthesia.
All experimental procedures were approved by the Animal Ethics Committee.
This study fully anticipated the potential harms to animals, primarily acute pain and stress induced by invasive procedures such as tail vein injection and serial blood sampling. To minimize animal suffering, a systematic prevention and control protocol was implemented: (1) Proficient Pre-experimental Training: All procedures were performed by skilled personnel to maximize the reduction of intraoperative distress. (2) Humane Euthanasia: At the experimental endpoint, animals were euthanized via intravenous injection of an anesthetic agent through the tail vein, ensuring death under deep anesthesia to eliminate terminal pain and stress. Furthermore, well-defined humane endpoints were established as criteria for early intervention. Euthanasia was to be performed immediately if any of the following conditions occurred during the study: (1) completion of the designated dosing regimen and final blood collection; (2) rapid body weight loss of 10% to 20%; (3) loss of appetite for 24 h or persistently poor appetite for more than 3 days; (4) inability to eat or drink voluntarily; or (5) signs of depression or self-injurious behavior in unanesthetized or unsedated animals. Throughout the study, all animals were closely monitored, and fortunately, none met the criteria requiring early humane intervention.
This study was conducted in accordance with the ‘Guide for the Care and Use of Laboratory Animals, eighth Edition’. 13 The investigator performing the group allocation and interventions was not blinded due to the nature of the procedures. To minimize bias, outcome assessment and data analysis were performed by researchers who were blinded to the group identity.
Experimental Methods
Statistical Analysis
All statistical analyses were conducted in the Python programming environment (version 3.12.7) within the Anaconda platform (version 24.11.3). The sample size (n) represents the number of independent biological replicates. The sample size was determined based on preliminary data and power analysis to ensure adequate statistical power. Normality of continuous variables was assessed using the Shapiro–Wilk test. For normally distributed data, comparisons between two groups were performed using independent samples t-tests, and comparisons among multiple groups were conducted using one-way ANOVA. Non-normally distributed variables were analyzed using the Mann–Whitney U test (two-group comparison) or the Kruskal–Wallis test (multiple-group comparison). All tests were two-tailed, with significance set at α = 0.05. Analyses were implemented primarily using the SciPy (v1.13.1), Pandas (v2.2.2), and Statsmodels (v0.14.2) Python libraries.
The beta diversity PCoA plot employs the Bray-Curtis distance matrix type, with statistical testing conducted using PERMANOVA.
Determination of Paclitaxel Concentration in Plasma
Plasma paclitaxel concentrations were measured using LC–MS/MS with propranolol as the internal standard.
Chromatography and Mass Spectrometry Conditions
Separation was performed on a Symmetry C18 column (4.6 × 150 mm, 3.5 μm). The mobile phase consisted of 0.1% formic acid in water (A) and methanol (B) using the following gradient: 0-2.0 min, 75%-95% B; 2.0-6.5 min, 95% B; 6.5-7.0 min, 95%-75% B; 7.0-8.0 min, 75% B. The flow rate was 0.7 mL/min, column temperature 40 °C, and injection volume 10 μL. Electrospray ionization in positive mode with multiple reaction monitoring (MRM) was used for detection. The ion transitions for paclitaxel and propranolol were m/z 876.7→308.7 and m/z 260.5→116.5, respectively, with declustering potentials of 99.48 V and 92.74 V, and collision energies of 44.85 V and 23.66 V.
Standard and Quality Control (QC) Solutions
Paclitaxel stock solution (1 mg/mL in methanol) was serially diluted with acetonitrile to prepare working solutions of 0.2, 0.5, 1, 2, 5, 10, 20, and 50 μg/mL. QC solutions were prepared at concentrations of 0.2, 0.5, 5, and 40 μg/mL. The internal standard (propranolol) was prepared at 50 ng/mL. Simulated plasma samples were prepared by spiking 10 μL of paclitaxel working solutions into 90 μL of blank rat plasma to yield final concentrations of 20, 50, 100, 200, 500, 1000, 2000, and 5000 ng/mL for calibration, and 20, 50, 500, and 4000 ng/mL for QC samples.
Plasma Sample Preparation
Plasma samples (100 μL) were mixed with 10 μL internal standard, vortexed for 1 min, then protein-precipitated with 500 μL acetonitrile and vortexed for 2 min. Samples were centrifuged at 10,900 × g for 5 min, the supernatant collected, and centrifuged again under the same conditions before LC–MS/MS analysis.
LC-MS/MS Method Validation
The analytical method for determining paclitaxel in rat plasma was validated according to standard bioanalytical guidelines, including assessments of specificity, linearity, precision, accuracy, extraction recovery, matrix effect, and stability.
Specificity
Blank plasma, blank plasma spiked with paclitaxel, and blank plasma spiked with both paclitaxel and the internal standard were processed as described in Section 2.4.5 and analyzed under the LC–MS/MS conditions specified in Section 2.4.3. The retention times of paclitaxel and the internal standard were 6.02 and 4.60 min, respectively, with good chromatographic peak shapes. No significant interference from endogenous plasma components was observed at the retention times of the analyte and internal standard, indicating good specificity.
Calibration Curve and Lower Limit of Quantification (LLOQ)
Calibration samples were prepared and analyzed according to Sections 2.4.4 and 2.4.6. The peak area ratio of paclitaxel to the internal standard (Y) was plotted against the nominal paclitaxel concentration (X), and linear regression was performed using a 1/X2 weighting factor. The calibration curve equation was Y = 0.0032X + 0.4112 (R2 = 0.9993), showing good linearity over the range of 20-5000 ng/mL. The LLOQ was determined to be 20 ng/mL.
Precision and Accuracy
Quality control (QC) samples at low, medium, and high concentrations were analyzed in five replicates within a single day (intra-day) and on three consecutive days (inter-day). Precision was expressed as the relative standard deviation (RSD), and accuracy was calculated as the relative error (RE) between measured and nominal concentrations.
Extraction Recovery and Matrix Effect
Extraction recovery was assessed by comparing the peak areas (A) of analytes obtained from extracted QC samples with those of post-extraction spiked samples (B) at equivalent concentrations, using the formula (A/B × 100%). Matrix effects were evaluated by comparing the peak areas of post-extraction spiked samples (B) with those prepared in pure methanol (C), with matrix factors (MF) calculated as (B/C × 100%). The IS-normalized MF was obtained as the ratio of the paclitaxel MF to the internal standard MF × 100%. The RSD values of MF were below 15% (n = 5), indicating negligible matrix effects.
Stability
The stability of paclitaxel in plasma was evaluated using QC samples at low, medium, and high concentrations (n = 5) under different conditions, including short-term storage at 4 °C for 4 h, three freeze–thaw cycles (−40 °C to room temperature), and long-term storage at −40 °C for 15 days. The measured concentrations showed RSD values below 15% under all conditions, indicating good stability of paclitaxel in plasma.
Gut Microbiota Analysis
A total of 24 male Sprague–Dawley rats were randomly assigned to three experimental groups (n = 8 per group): Group A, Group B, and Group C. All rats received intravenous administration of albumin-bound paclitaxel at a dose of 19.3 mg/kg, with a 7-day treatment cycle. Food and water were withheld 12 h prior to drug administration. 11 The dosing regimens were as follows: Group A, a single dose on Day 1; Group B, two doses on Days 1 and 8; and Group C, three doses on Days 1, 8, and 15. During the experimental period, rats had free access to food and water. (see Figure 1)

Treatment regimens and timelines for the three experimental groups (A, B, and C).
Fresh fecal samples were collected from each rat at the same time of day prior to the first administration and immediately stored in sterile tubes at −80 °C. Microbial DNA was extracted and subjected to high-throughput 16S rRNA sequencing (performed by Shanghai Paisenno Biotech Co., Ltd). Sequencing data were processed and analyzed using the Greengenes database. Differences in microbial composition, alpha diversity, and beta diversity between groups were assessed. Beta diversity was evaluated using distance matrices and principal coordinates analysis (PCoA) to assess the similarity of bacterial communities among samples, where greater spatial separation indicates more pronounced compositional differences. Results were visualized using boxplots and scatterplots.
Pharmacokinetic Study
For the pharmacokinetic analysis, six rats were randomly selected from each group (n = 6 per group). Blood samples (0.4 mL) were collected via the retro-orbital plexus into heparinized centrifuge tubes at 0.08, 0.25, 0.50, 1, 3, 5, 8, and 12 h following intravenous administration of albumin-bound paclitaxel. Samples were centrifuged at 10,900 × g for 5 min to obtain plasma, which was processed according to the procedure described in Section 2.4.5 and analyzed under the LC–MS/MS conditions specified in Section 2.4.3. Paclitaxel concentrations in plasma were calculated using the corresponding calibration curves. Pharmacokinetic parameters were computed using DAS 2.0 software, and statistical analyses were performed in Python, following the methods described in Section 2.4.1.
Effects of Gut Microbiota Dysbiosis on Hepatic and Intestinal CYP Expression in Rats
Three rats were randomly selected from each group in Section 2.4.7 (n = 3 per group). Following anesthesia, animals were sacrificed, and small intestine and liver tissues were rapidly excised, cleaned of surface blood and debris, blotted dry, snap-frozen in liquid nitrogen, and stored at −80 °C until analysis. The expression of CYP3A1 and CYP2C11 mRNA in small intestine and liver, as well as CYP3A1 and CYP2C11 protein levels in liver, were evaluated using qRT-PCR and Western blot, respectively. (Note: human CYP3A4 and CYP2C8 are homologous to rat CYP3A1 and CYP2C11.)
Western Blot Analysis
Frozen liver tissues were homogenized on ice and lysed. The lysates were centrifuged, and supernatants were collected. Protein concentrations were determined using the BCA assay, followed by denaturation in a boiling water bath for 15 min. Denatured proteins were separated by SDS-PAGE and transferred onto PVDF membranes. Membranes were blocked with 5% nonfat milk for 30 min, washed, and incubated overnight at 4 °C with primary antibodies against CYP3A1, CYP2C11, and β-actin. After washing, membranes were incubated with the corresponding secondary antibodies at room temperature for 30 min. Following final washes, equal volumes of ECL solution A and B were mixed and applied to the membrane. Chemiluminescent signals were captured using a chemiluminescence imaging system, and raw TIFF images were analyzed with AIWBwell™ software. Statistical analyses were performed as described in Section 2.4.1.
Quantitative Real-Time PCR (qRT-PCR) Analysis
Frozen liver and small intestine tissues were homogenized, and total RNA was extracted. RNA concentration and purity were assessed using a Nanodrop 2000 spectrophotometer, and high-concentration samples were diluted to a final concentration of 200 ng/μL. Reverse transcription was performed using the SweScript All-in-One RT SuperMix for qPCR (including gDNA remover), with a total reaction volume of 20 μL per sample. The reverse transcription protocol was set as follows: 25 °C for 5 min, 42 °C for 30 min, and 85 °C for 5 s.
qPCR reactions were prepared in 0.1 mL PCR plates, each sample run in triplicate. The reaction mixture per well consisted of 7.5 μL 2×Universal Blue SYBR Green qPCR Master Mix, 1.5 μL forward and reverse primers (2.5 μM), 2 μL cDNA, and 4 μL nuclease-free water. Amplification was carried out with the following cycling conditions: 95 °C for 30 s (pre-denaturation), followed by 40 cycles of 95 °C for 15 s and 60 °C for 30 s (annealing/extension), with fluorescence acquisition at 0.5 °C increments. Relative gene expression was calculated using the ΔΔCT method: ΔCT_sample = CT_target – CT_reference; ΔCT_control = CT_target – CT_reference; ΔΔCT = ΔCT_sample – ΔCT_control; fold change = 2^–ΔΔCT. Statistical analyses were conducted as described in Section 2.4.1.
Results
Validation Results of the LC–MS/MS Method
Precision and Accuracy
The method demonstrated satisfactory intra-day precision (RSD ≤5.17%) and inter-day precision (RSD ≤ 10.38%) across three concentration levels (50, 500, and 4000 ng/mL). Accuracy, expressed as the relative error (RE), was within ±4.70% for all levels (see Table 1).
Test Results of Precision and Accuracy for Quantitative Analysis of Paclitaxel.

Recovery and Matrix Effect
At three concentration levels (50, 500, and 4000 ng/mL), the mean extraction recoveries of paclitaxel ranged from 84.94% to 91.95% (RSD ≤ 12.56%), while the matrix effect values ranged from 105.62% to 117.90% (RSD ≤ 10.35%). Both parameters met the acceptance criteria for bioanalytical method validation (recovery: 70-120%, RSD ≤ 15%; matrix effect: 85-115%, RSD ≤ 15%) (see Table 2).
Test Results of Extraction Recovery and Matrix Effect for Quantitative Analysis of Paclitaxel.

Stability
For paclitaxel samples at theoretical concentrations of 50, 500, and 4000 ng/mL, stability was evaluated under three storage conditions: storage at 4 °C for 4 h, three freeze–thaw cycles, and long-term storage at −40 °C for 15 days. RSD was used as the evaluation metric. The results showed that RSD values ranged from 2.11% to 5.45% after 4 h at 4 °C, 1.06% to 3.22% after three freeze–thaw cycles, and 1.38% to 4.47% after 15 days of long-term storage. All RSD values were within the acceptable limits for quantitative bioanalysis, indicating that paclitaxel remained stable under all tested storage conditions across the examined concentration levels (see Table 3).
The Test Results of Stability Testing for Quantitative Analysis of Paclitaxel.

Changes in Gut Microbiota Composition and Diversity Following Three Consecutive Doses of Nab-Paclitaxel
At the phylum level, compared with Group A, the relative abundance of Actinobacteriota was significantly decreased in Group B (P < .05). In Group C, the relative abundance of Firmicutes was markedly reduced (P < .05), while Proteobacteria and Cyanobacteria were significantly increased (P < .05). Furthermore, compared with Group B, Group C showed a further significant elevation in the relative abundance of Proteobacteria and Cyanobacteria (P < .05) (See Figure 2).

The changes in phylum-level gut microbiota in rats before three consecutive administrations.
At the genus level, compared with Group A, the relative abundance of Ligilactobacillus was significantly decreased in Group B (P < .05), while UBA3282 was significantly increased (P < .05). Similarly, in Group C, Ligilactobacillus abundance remained significantly lower than that in Group A (P < .05). Moreover, compared with Group B, Group C exhibited a significant reduction in Lactobacillus and an increase in Ruminococcus_C abundance (P < .05) (See Figure 3).

The changes in genus-level gut microbiota in rats before three consecutive administrations.
Alpha-diversity analysis of the gut microbiota indicated that the Observed Species index was significantly higher in Group B than in Group A (P < .05) (See Figure 4). In Group C, the Simpson (See Figure 5a), Pielou_e (See Figure 5b), Shannon (See Figure 5c), Allens_H (See Figure 5d), and Rao's quadratic entropy indices (See Figure 5e) were all significantly increased compared with Group A (P < .05). Additionally, compared with Group B, Group C showed further increases in Allens_H (See Figure 6a) and Rao's quadratic entropy indices (P < .05) (See Figure 6b).

The results of analyzing gut microbiota alpha diversity between experimental group A and experimental group B.

The results of analyzing gut microbiota alpha diversity between experimental group A and experimental group C.

The results of analyzing gut microbiota alpha diversity between experimental group B and experimental group C.
Beta-diversity analysis based on Bray–Curtis distances revealed significant differences in microbial community structure among the experimental groups. Principal coordinate analysis (PCoA) showed separation of samples along the first principal coordinate (PC1), which accounted for 24.7% of the total variance. Pairwise PERMANOVA tests indicated a statistically significant difference in microbial composition between Group A and Group C (P < .05). In contrast, no significant differences were observed between Group A and Group B (P > .05) or between Group B and Group C (P > .05) (See Figure 7). The gut microbiota structure in the multi-dose group (Group C) showed significant deviation compared to the single-dose group (Group A) (P < .05), indicating that repeated administration of nano-paclitaxel can alter the host's gut microbiota in a cycle-dependent manner.

The results of analyzing gut microbiota beta diversity.
Changes in Pharmacokinetic Parameters After Repeated Nab-Paclitaxel Administration
Compared with Group A, the clearance (CL), mean residence time from 0 to t [MRT(0–t)], mean residence time from 0 to ∞ [MRT(0–∞)], terminal half-life (t1/2z), and apparent volume of distribution (Vz) in Group B decreased by 28.29%, 19.32%, 27.10%, 16.35%, and 38.63%, respectively. In contrast, the area under the concentration–time curve from 0 to t [AUC(0–t)], AUC from 0 to ∞ [AUC(0–∞)], zeta and Cmax increased by 41.46%, 40.65%, 19.13%, and 42.09%, respectively. All intergroup differences were statistically significant (P < .05).
Compared with Group B, Group C exhibited an 18.98% decrease in zeta, whereas MRT(0–t), MRT(0–∞), and t1/2z increased by 27.88%, 39.16%, and 24.03%, respectively, with all differences reaching statistical significance (P < .05). The plasma concentration–time profiles of paclitaxel in each group are shown in Figure 8.
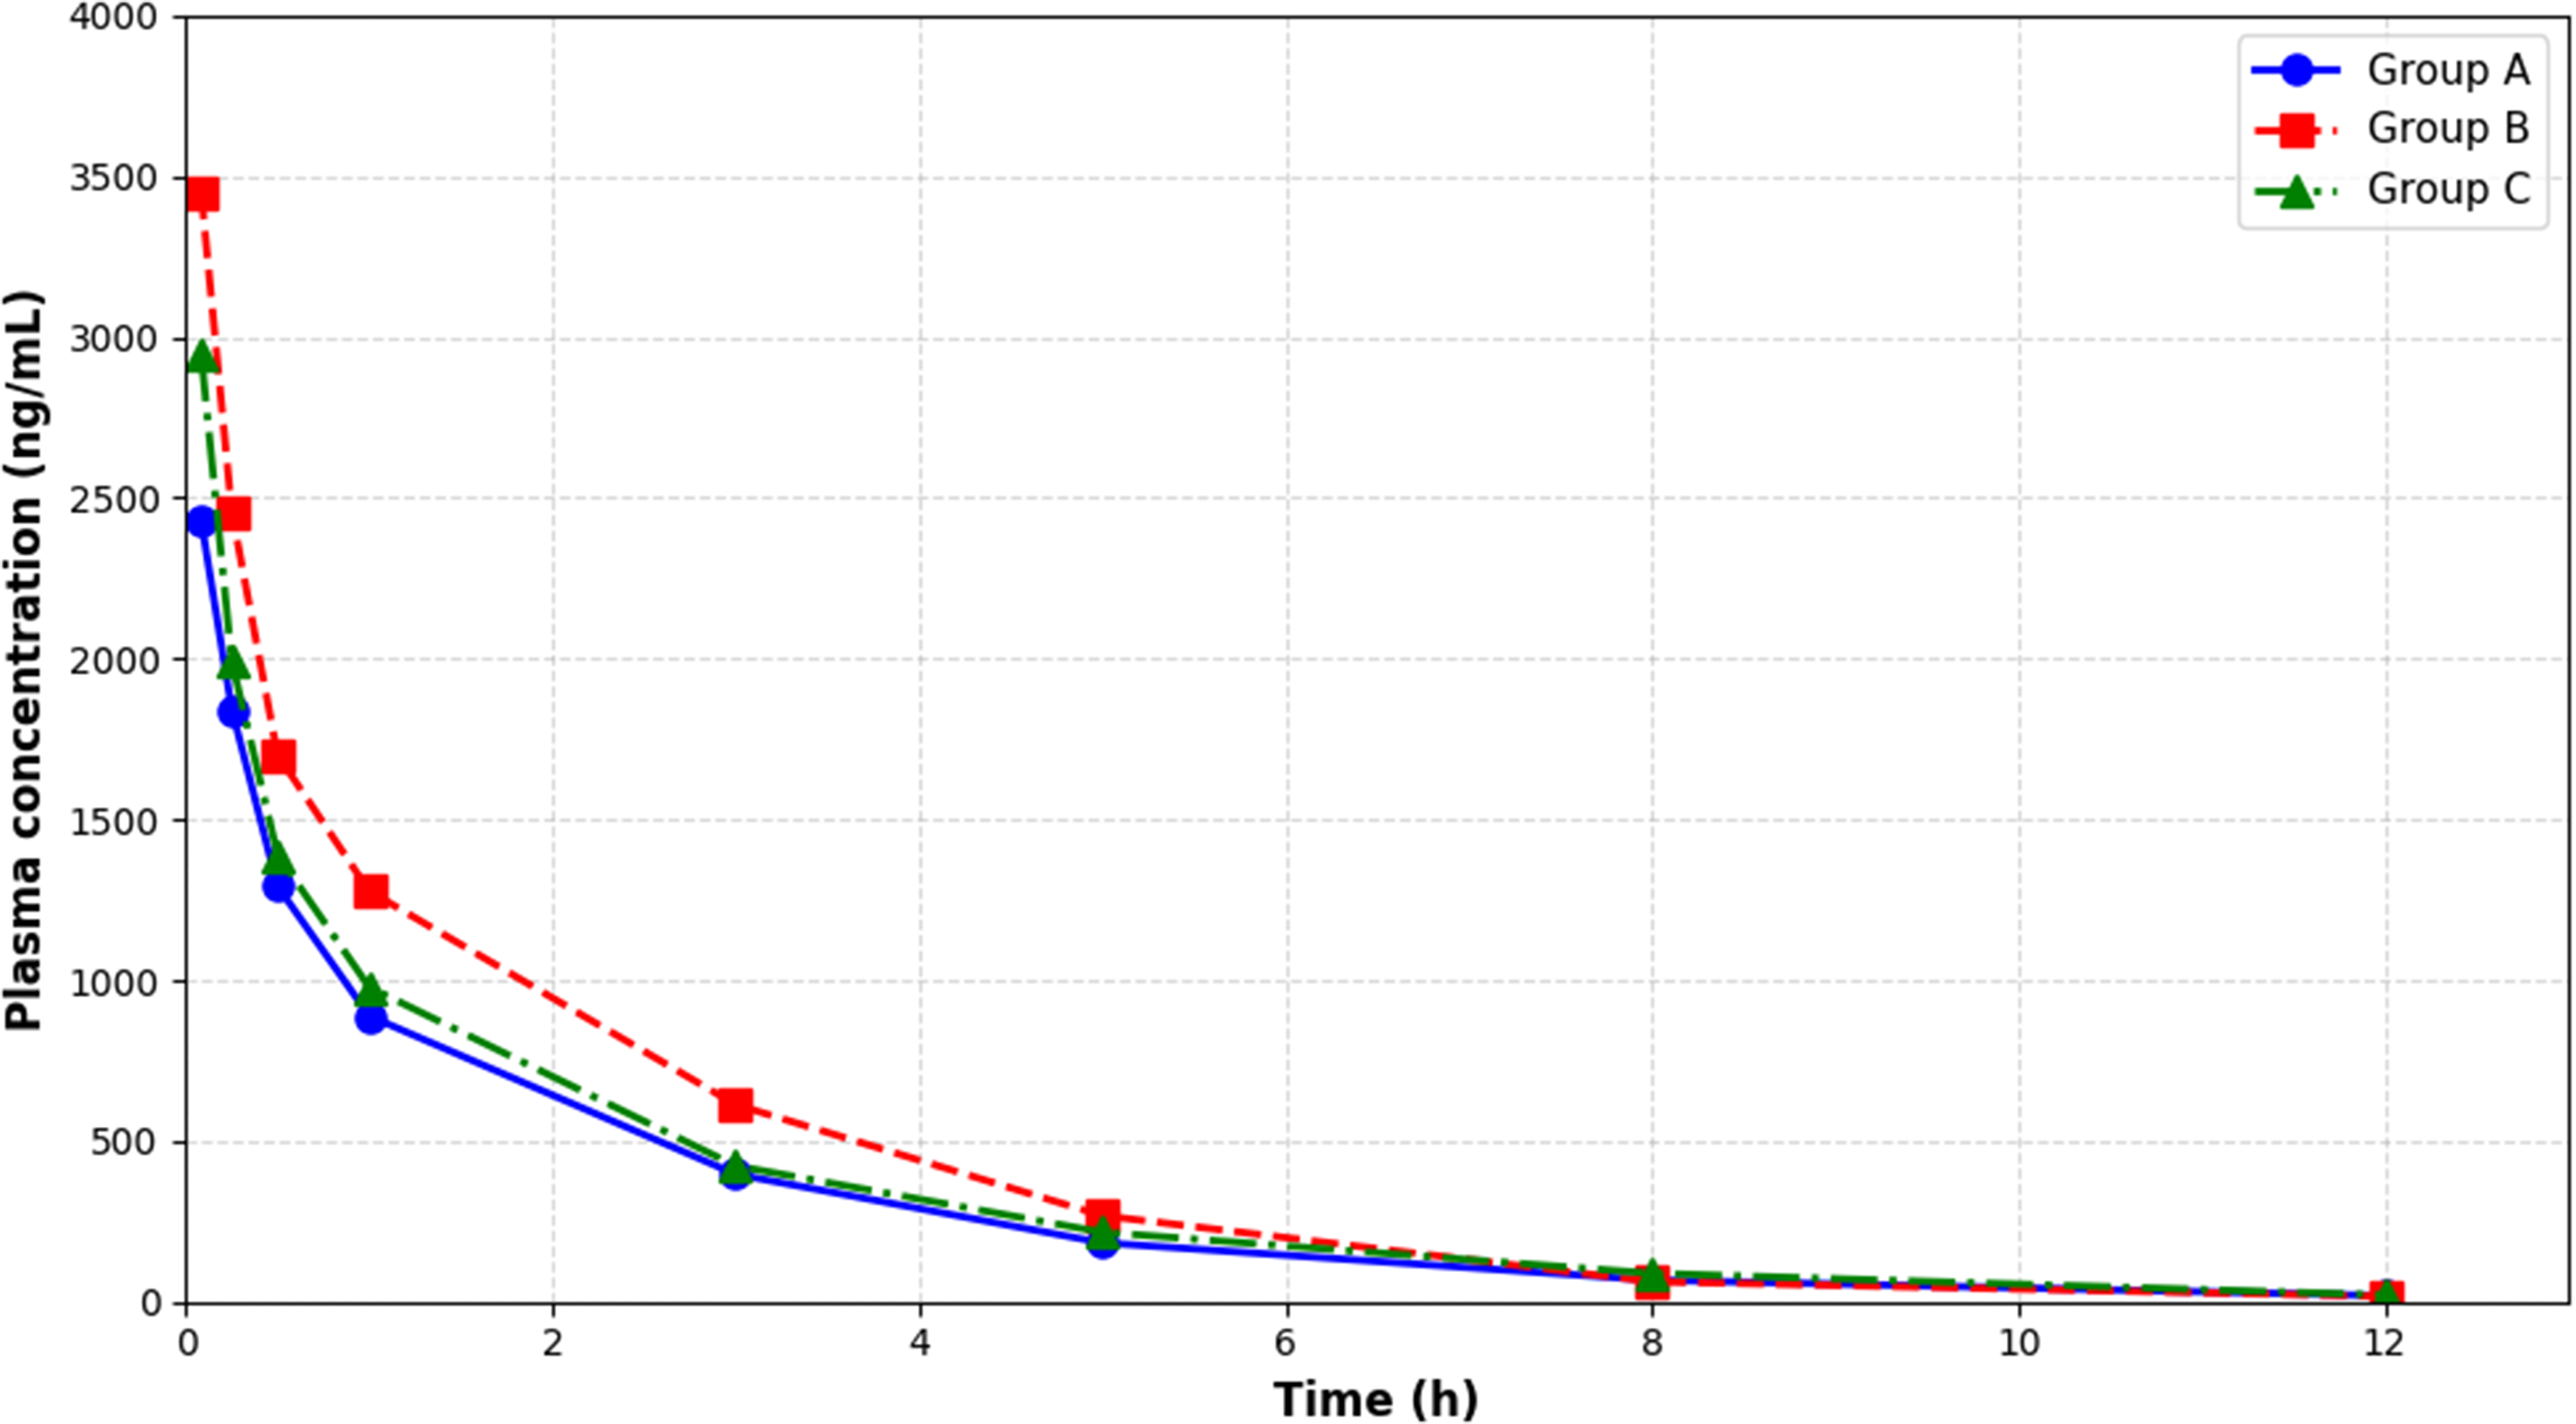
The concentration-time curves of paclitaxel in rat plasma from each experimental group.
Alterations of Gut Microbiota in Rats After Consecutive Administration
At the phylum level, compared with the baseline (prior to the first administration), the abundance of Actinobacteriota significantly decreased after a single administration, while after two consecutive treatment cycles, the relative abundances of Proteobacteria and Cyanobacteria further increased markedly. The reduction of Actinobacteriota may indirectly decrease the total production of short-chain fatty acids, thereby weakening the intestinal barrier and increasing intestinal permeability, which allows harmful substances such as lipopolysaccharide to more readily enter the systemic circulation and trigger low-grade systemic inflammation. 14 In a healthy intestinal microbiota, Firmicutes and Bacteroidetes are the dominant phyla that maintain a dynamic balance, whereas Proteobacteria and Cyanobacteria normally exist in very low proportions. The significant elevation of the latter two phyla disrupts this equilibrium and indicates an unhealthy intestinal microenvironment. 15 At the genus level, compared with baseline, the relative abundance of Ligilactobacillus significantly decreased after one treatment cycle (P < .05). Ligilactobacillus is a relatively new genus within the family Lactobacillaceae, encompassing several well-recognized probiotic species such as Ligilactobacillus salivarius and Ligilactobacillus murinus, which are commonly found in the intestinal tracts of animals. These bacteria contribute to gut health through multiple mechanisms, including lactic acid production to lower intestinal pH and inhibit pathogen growth, maintenance of the epithelial barrier via promotion of mucin secretion and tight junction integrity, modulation of immune responses to alleviate inflammation, and competitive exclusion of pathogenic microbes. Therefore, the decline in Ligilactobacillus abundance implies a reduction of key beneficial bacteria, potentially leading to impaired intestinal barrier function and weakened immune regulation, rendering the gut more vulnerable to pathogens or inflammatory insults. 16 After two treatment cycles, the relative abundance of Lactobacillus also significantly decreased (P < .05). Lactobacillus is one of the most important and well-established probiotic genera contributing to intestinal homeostasis and host defense. 17 With increasing treatment cycles, the abundance of beneficial bacteria progressively decreased, while potentially harmful bacteria increased, suggesting that these alterations in microbial composition may be induced by continuous administration of nab-paclitaxel (albumin-bound paclitaxel).18,19
Pharmacokinetic Changes in Rats Following Multiple Consecutive Dosing Cycles
After three consecutive dosing cycles, from group A to group B, the pharmacokinetic parameters CL, VRT(0–t), VRT(0–∞), t1/2z, and Vz significantly decreased, while Zeta and Cmax markedly increased. From group B to group C, Zeta significantly decreased, whereas VRT(0–t), VRT(0–∞), and t1/2z significantly increased, and all intergroup differences were statistically significant (P < .05). The parameters VRT(0–t), VRT(0–∞), and t1/2z exhibited a trend of initial decline followed by elevation, while Zeta showed the opposite pattern, first increasing and then decreasing. VRT(0–t) represents the mean residence time from zero to the last measurable concentration point, VRT(0–∞) denotes the mean residence time extrapolated to infinity, and t1/2z refers to the terminal elimination half-life, which is the time required for the plasma drug concentration to decrease by half after the distribution equilibrium is reached. This parameter mainly reflects the rate of drug elimination from the body and determines the dosing interval, with a longer half-life generally allowing for an extended interval between doses. These results indicate that the in vivo disposition of nab-paclitaxel (albumin-bound paclitaxel) may not follow a simple linear pharmacokinetic process but rather depends on the number and frequency of administrations. From group A to group B, the significant increase in AUC suggests that increasing dosing frequency may enhance systemic exposure and consequently raise the risk of adverse effects, 8 while from group B to group C, the prolonged residence time implies that repeated administration may lead to drug accumulation, potentially resulting in toxicity or delayed pharmacological effects. 20 Therefore, for chemotherapeutic agents requiring multiple treatment cycles, predicting the pharmacokinetic behavior of repeated dosing solely based on single-dose data may be inappropriate, and therapeutic drug monitoring could be particularly important to optimize efficacy and minimize toxicity.
Changes in Hepatic CYP3A1 and CYP2C11 Protein and mRNA Expression in Rats After Multiple Consecutive Administrations
After three consecutive administrations, no statistically significant differences were observed in the hepatic protein expression levels of CYP3A1 and CYP2C11, nor in their mRNA expression levels in the liver and small intestine. (See Figure 9) This finding suggests that nab-paclitaxel (albumin-bound paclitaxel) may not affect the metabolism of co-administered drugs through the induction of hepatic CYP enzymes, implying a potentially higher level of safety in clinical combination chemotherapy. 8 Consequently, the probability of severe pharmacokinetic interactions between nab-paclitaxel and other drugs, such as CYP3A4 substrates, may be reduced. These results also indirectly confirm that the albumin nanoparticle delivery system effectively directs the drug toward target tissues (tumors), thereby minimizing its functional interference with normal tissues. 7 This highlights the unique pharmacological characteristics of nanomedicines and reinforces that conclusions drawn from studies on conventional paclitaxel cannot be directly extrapolated to nab-paclitaxel. Independent pharmacokinetic and pharmacodynamic evaluations of nab-paclitaxel are therefore essential. 20 In this study, a multi-cycle chemotherapy regimen was simulated in rats, and the results demonstrated that three consecutive administrations of nab-paclitaxel significantly altered its pharmacokinetic characteristics and induced pronounced intestinal microbiota dysbiosis. The close association between these changes suggests that, during clinical chemotherapy, the intestinal microbiota composition of patients may serve as a novel biomarker for evaluating individualized pharmacokinetic behaviors and adverse reactions to paclitaxel. Future studies should employ tumor-bearing animal models and integrate metabolomics, inflammatory cytokine profiling, and multi-omics correlation analyses to elucidate the role of the “gut–liver axis” in nab-paclitaxel chemotherapy, thereby providing a theoretical basis for optimizing chemotherapy regimens through interventions such as probiotics or fecal microbiota transplantation.21–23

The protein expression bands of CYP3A1 and CYP2C11 in rat liver.
Discussion
In summary, this study comprehensively evaluated the effects of consecutive administration of nab-paclitaxel on gut microbiota composition, pharmacokinetic behavior, and CYP enzyme expression in rats. Repeated dosing induced pronounced alterations in the microbial community, initially characterized by a reduction in Firmicutes followed by enrichment of Proteobacteria and Cyanobacteria at the phylum level. At the genus level, the relative abundance of Ligilactobacillus significantly decreased while UBA3282 increased, followed by a further decline in Lactobacillus and a marked elevation in Ruminococcus, accompanied by enhanced microbial diversity. Our findings are consistent with previous studies demonstrating that paclitaxel alters gut microbiota composition, leading to dysbiosis and a significant imbalance in the Bacteroidetes/Firmicutes ratio.21,23,24 Pharmacokinetic analyses revealed that, across multiple treatment cycles, the inter-molecular residence time first decreased and then increased; after the second administration, systemic exposure was elevated and remained stable, whereas clearance and volume of distribution declined and subsequently stabilized. Despite these pharmacokinetic variations, hepatic and intestinal expression of CYP3A1 and CYP2C11 exhibited only minor, statistically insignificant changes at both mRNA and protein levels. Collectively, these findings indicate that modulation of the gut microbiota, rather than CYP-mediated metabolism, predominantly governs the disposition of nab-paclitaxel during continuous treatment, providing experimental evidence that maintaining intestinal microbial homeostasis is crucial for sustaining stable pharmacokinetic profiles throughout repeated chemotherapy cycles. 25
The novelty of this study lies in the establishment of a rat model that simulates clinically relevant, consecutive chemotherapy cycles. This model was employed to investigate how repeated sodium paclitaxel administration influences the gut microbiota and drug pharmacokinetics, and to provide an experimental basis for optimizing dosing regimens and reducing treatment-related toxicity.
This study also has several limitations that should be considered when interpreting the results. First, the experimental design did not include a completely untreated control group, as all groups received paclitaxel administration. This is because the primary aim of the study was to compare differences among various treatment cycles rather than to evaluate the absolute effect of paclitaxel against a blank control. Nevertheless, the absence of an untreated control may somewhat limit a comprehensive interpretation of treatment-related changes. Second, the absence of routine body weight monitoring limits a complete evaluation of physiological status during treatment, even though weight is a well-established indicator of overall health and drug safety. Third, while the study focused on gut microbiome analysis and pharmacokinetics, serum metabolomics was not performed. Therefore, the systemic metabolic response could not be fully elucidated, which represents an important direction for future research. Finally, only male animal models were used, which precludes an examination of potential sex-dependent effects on paclitaxel response and microbiome modulation, thereby constraining the generalizability of the findings. Future studies incorporating multi-omics approaches and both sexes in the experimental design would help to more systematically clarify the integrated biological effects of cyclic paclitaxel administration.
Footnotes
Abbreviations
Acknowledgements
This work was supported by the laboratory platform of The Second Hospital of Hebei Medical University. The authors also gratefully acknowledge the reviewers and editors for their insightful comments and suggestions, which have significantly enhanced the scientific rigor and quality of this manuscript.
Ethics Statement
All experimental procedures were approved by the Animal Ethics Committee of the Second Hospital of Hebei Medical University. (2025-AE473).
Funding
The authors disclosed receipt of the following financial support for the research, authorship, and/or publication of this article: This work was supported by the Hebei Provincial Medical Science Research Project Plan, Hebei Province Natural Science Foundation of Hebei Province of China, (grant number No. 20221145), H2024206249).
Declaration of Conflicting Interests
The authors declared no potential conflicts of interest with respect to the research, authorship, and/or publication of this article.