
Abstract
Introduction
Colorectal cancer (CRC) remains a leading cause of cancer-related mortality globally, with drug resistance and poor prognosis significantly limiting treatment efficacy. To address this unmet clinical need, this study aimed to screen potential biomarkers for CRC drug resistance and prognosis through integrated bioinformatics analysis and clinical sample validation.
Methods
We analyzed Gene Expression Omnibus (GEO) database GSE153412 to screen differentially expressed genes (DEGs) between 5-fluorouracil (5-FU)-resistant and sensitive CRC cells (|log2FC| > 1.0, adj P < 0.05). Gene set enrichment analysis (GSEA) was used for pathway enrichment, Weighted gene co-expression network analysis (WGCNA) to identify resistance-related modules (correlation > 0.7, P < 0.01), and Protein-protein interaction (PPI) networks to screen hub genes. Their prognostic value was evaluated in TCGA-COAD, along with IC50 correlation. Finally, qPCR verified biomarker expression in clinical CRC samples.
Results
There were altogether 1033 DEGs screened. Through GSEA, Kyoto Encyclopedia of Genes and Genomes (KEGG) pathways and Gene Ontology (GO) terms enriched by the DEGs were obtained. By PPI network construction, hub genes were screened. In TCGA-COAD datasets, CAV1 (P = 0.018), CDH1 (P = 0.049), CXCL8 (P = 0.00068), CD24 (P = 0.00017), NR3C1 (P = 0.016), and ZEB1 (P = 0.042) were also related to CRC prognosis. The correlation analysis of key genes and drug resistance suggested the emergence of CDH1, CAV1, NR3C1, and ZEB1, which was also examined by clinical data validation.
Conclusion
Integrated bioinformatics and clinical validation analyses identified CDH1, CAV1, NR3C1, and ZEB1 as key biomarkers for CRC. These genes were significantly associated with 5-FU resistance and CRC prognosis, as supported by their dysregulated expression in clinical samples, highlighting their mechanistic roles in the CRC drug resistance pathways.
Introduction
Cancer heterogeneity coupled with its multifactorial pathogenesis constitutes a critical public health burden, which has compromised the patient quality of life and strained the healthcare infrastructures amid socioeconomic constraints, thereby necessitating innovative interventions. 1 Colorectal cancer (CRC) is still a major global cancer burden, with estimated 2.1 million new cases projected for 2025, accounting for 10.2% of all cancer diagnoses, and approximately 1.05 million related deaths, making it the third leading cause of cancer-associated mortality globally, only second to lung cancer and liver cancer. 2 Since 2000, the incidence of CRC has shown a persistent upward trajectory, and the global average annual growth rate is approximately 1.5%. This is primarily driven by risk factors such as population aging, high-fat diets during urbanization, and sedentary lifestyles, where developed countries exhibit slowing growth whereas low-income countries experience accelerated increases. 3 There are pronounced geographical disparities, typically, the age-standardized incidence rate (ASR) in high-income regions including North America and Western Europe is 35/100,000, whereas that in low-income regions like Africa is only 8/100,000, highlighting the impact of resource inequity on disease distribution. 4 With regard to survival rates, the global average five-year relative survival stands at 55%, while it falls below 40% in low-income countries due to limited screening access and diagnostic delays, it exceeds 65% among high-income nations. Notably, according to the 2025 statistics, the incidence in males (ASR 24/100,000) is higher than that in females (ASR 16/100,000), with risk differences linked to sex-specific exposures such as smoking and obesity. Although screening programs in Europe and America have reduced the mortality (with an annual decline of 1-2%), the global CRC death burdens remain persistently high, with projected fatalities rising to 1.2 million by 2030. 5 To sum up, the global epidemiological landscape of CRC underscores its escalating public health challenge, necessitating reinforced prevention strategies to mitigate the drug resistance problem and improve patient prognoses. Biomarkers are pivotal for cancer diagnosis, risk assessment, and crucially, for predicting therapeutic response and monitoring drug resistance—a major hurdle in CRC management. For example, MSI-H/dMMR, KRAS/NRAS, and BRAF V600E are currently the most critical biomarkers in clinical practice, directly influencing therapeutic decision-making, particularly the selection of targeted and immunotherapy. 5
Although 5-fluorouracil (5-FU) always has a key effect on treating CRC, like other chemotherapy drugs, it lacks specificity in killing tumor cells, therefore, it causes strong toxic and side effects, inevitably leading to bone marrow suppression, immune injury, cardiac toxicity, liver and kidney damage and other problems.6–8 To make up for this shortcoming, a batch of humanized monoclonal antibody drugs have been developed in recent years, which are targeted drugs designed for specific sites of cell signaling pathways, including bevacizumab, cetuximab, panitumumab, navumab, pamumab, remorum mab, epimab, trastuzumab, pabolizumab, and dotarimab. These drugs can achieve favorable therapeutic effects on specific patient groups. However, the use of such drugs is currently associated with numerous limitations, and clear genetic testing is necessary before selecting suitable targeted drugs. At present, the emerging targeted drugs are unable to replace traditional chemotherapy drugs. For a considerable period of time in the future, chemotherapy drugs represented by 5-FU will still have an unshakable position as the backbone in CRC treatment.9,10 Therefore, how to make tumor cells continuously sensitive to 5-FU drugs, enable chemotherapy drugs to fully execute their anti-tumor efficacy, and decrease their toxic and side effects, is an urgent basic research and clinical transformation problem to be solved.
Developed by the National Center of Biotechnology Information (NCBI), the Gene Expression Omnibus (GEO) database is a publicly available database including functional genomics data, which allows for the archival and free distribution of research community-submitted high-throughput gene expression, methylation, and sequencing datasets. 11 GSE153412 is a publicly accessible gene expression dataset archived in the NCBI GEO database. It originates from a cell-based study investigating the resistance of CRC to 5-FU. This dataset comprises 18 samples, comparing gene expression profiles of three distinct 5-FU-resistant HCT116 CRC cell lines versus drug-sensitive counterparts after 24-h treatment with 10 μM 5-FU. 12 The Illumina NovaSeq 6000 platform (GPL24676) is used for data generation to identify potential biomarkers or molecular mechanisms underlying chemotherapy resistance. The GSE153412 data in GEO datasets were examined in this work. CDH1, CAV1, NR3C1, and ZEB1 were screened as the potential biomarkers associated with drug resistance in CRC. These biomarkers enable early prediction of treatment response and resistance patterns in CRC patients, and thereby hold promise for advancing personalized medicine. Their validation can drive targeted drug development, reduce mortality and address the rising global burden highlighted in epidemiological reports.
Methods
Data Preprocessing and RNA Annotation
Data (GSE153412) were acquired based on the NCBI GEO (https://www.ncbi.nlm.nih.gov/), and 18 samples were selected, including three different 5-FU resistant CRC cell lines (HCT116) versus sensitive cells treated with 5-FU 10 μM for 24 h. The detection platform was GPL24676 Illumina NovaSeq 6000 (Homo sapiens). After downloading the transcriptome data, the count value matrix and TPM matrix of gene expression were then obtained.
The expression matrix data obtained were standardized using the R software limma package normalizeBetweenArrays method. Meanwhile, the boxplot function of R software was used for box plot construction, and the ggord package was adopted for principal component analysis (PCA).
Screening and Enrichment Annotation of Significant Differentially Expressed Genes (DEGs)
The samples were divided into drug-resistant versus sensitive groups based on their source, and significant DEGs between infected versus normal control groups at each time point were calculated with the edgeR package in R3.4.1 language upon the false discovery rate (FDR) < 0.05 and |log2 fold change (FC)| > 0.5 thresholds. Then, according to the significant DEGs levels obtained through screening, the pheatmap Version 1.0.8 in R3.4.1 language was utilized (https://cran.r-project.org/package = pheatmap). The expression values were subjected to bidirectional Hierarchical clustering according to Euclidean distance, and was displayed with heatmap. The online search software DAVID 2023q2 (https://david.ncifcrf.gov/) was employed for analyzing the biological processes alongside Kyoto Encyclopedia of Genes and Genomes (KEGG) pathways 13 associated with significantly enriched DEGs in each group, and FDR < 0.05 was selected as the significance level for enrichment.
The Weighted Gene co-Expression Network Analysis (WGCNA) Algorithm for Screening Phenotype-Related Gene Modules
Firstly, the three sets of significant DEG sets selected from each of the three time points were compared, and then the union genes of the three sets were selected for further research. As the bioinformatics algorithm for constructing co-expression networks,14,15 WGCNA can be used for identifying disease-related modules and screening important therapeutic targets or pathogenic mechanisms. To be specific, the threshold for screening gene module is that, the module set should contain ≥ 100 significant DEGs, with cut Height = 0.995. The significant DEGs within the selected key modules are used as targets for later analyses.
Protein-Protein Interaction (PPI) Network Construction
Utilizing the Search Tool for the Retrieval of Interacting Genes/Proteins (STRING, Version: 12.0, http://string-db.org/), the significant differential expression of important targets obtained before database search, as well as the gene product-protein interactions, was adopted to construct an interaction network through Cytoscape Version 3.6.1 (http://www.cytoscape.org/). The network was visualized and displayed, and topological analysis was performed on the network to obtain the degree value of each gene node in the network.
The Cancer Genome Atlas (TCGA) Colon Cancer Data Validation
The TCGA-COAD RNA-seq FPKM expression matrix and clinical survival data were obtained in the UCSC XENA database (https://xenabrowser.net/datapages/). By utilizing the Limma package of R software, DEGs in cancer versus non-carcinoma tissues were identified, and hub gene differential levels between cancer and adjacent tissues were also analyzed. The adj.p.val (FDR) < 0.05 served as the significance level. According to the cutoff method, the samples were grouped, and the R survival package was utilized for obtaining the Kaplan-Meier (KM) curve (overall survival, OS) to analyze the correlation between hub gene expression and prognosis in CRC.
Drug Sensitivity Analysis
Using the Genomics of Drug Sensitivity in Cancer (GDSC) database, TCGA-COAD tumor gene and cell expression profiles were adopted in combination with R language pRRophytic algorithm analysis to construct a ridge regression model for predicting drug half maximal inhibitory concentration (IC50), representing drug sensitivity. The higher IC50 value suggested that the drug was more sensitive to cancer, while the lower value indicated that the drug was more sensitive and effective.
Here, the R package pRRophytic (version: 0.5, https://osf.io/dwzce/?action = download) was used. According to those 198 drugs provided in this package, IC50 values were predicted; subsequently, Pearson correlation coefficients and corresponding significance p-values were calculated between the IC50 values of these 198 drugs and hub gene expression levels in the TCGA-COAD dataset.
Screening of key Drug-Resistant Targets
In line with the above credit analysis, those highly ranked resistant genes were obtained.
Clinical Sample Collection
Between May 2021 and June 2022, 24 matched pairs of CRC specimens were obtained from our hospital, comprising tumor tissues and corresponding adjacent non-carcinoma tissues. All the enrolled subjects were treatment-naïve CRC patients at initial diagnosis, while those with prior malignancy or receiving anti-tumor treatment were excluded. The study systematically assessed the expression profiles of key biomarkers CDH1, CAV1, NR3C1, and ZEB1 in both tissue types. This study involving the collection and analysis of colon cancer patient samples was approved by the Medical Ethics Committee of The People's Hospital of Rugao (Approval No. RGEC-2021-GS011). Written informed consent was obtained from all participants prior to sample collection, authorizing the use of their clinical specimens and associated data for research purposes. The study protocol strictly adhered to the ethical principles outlined in the Declaration of Helsinki.
Real-Time Quantitative Reverse Transcription-Polymerase Chain Reaction (qRT-PCR)
Trizol Reagent (Beyotime, Shanghai, China) was utilized for extracting total sample RNA following specific protocols, which was later prepared in cDNA using the PrimeScript™ RTreagent kit (Takara, Dalian, China) through reverse-transcription. qPCR was subsequently carried out by the ABI 7900HT Real-Time PCR system (Applied Biosystems, Foster City, CA, USA) to analyze CDH1, CAV1, and CXCL8 mRNA levels through using SYBR Premix Ex Taq™ kit (Takara, Dalian, China). The 2−ΔΔCt approach was employed for measuring mRNA expression, with GAPDH being the reference. The CDH1, CAV1, NR3C1, and ZEB1 primers were: CDH1 5’-CACAGCAAGTTCAAGGAGCAC-3’ (forward, F) and 5’-TCCTCTTCCTCTTCCTCTCCTT-3’ (reverse, R); CAV1 5’-AGAGTGCCCTGGAGTTTGTG-3’ (F) and 5’-TCCTCTTCCTCTTCCTCTCCTT-3’ (R), NR3C1 5’AGCTGGCTGTTTACCTTGTGG-3’ (F) and 5’-TCCATGAAGAGGGAAGGGTCT-3’ (R), and ZEB1 5’-GATGATGAATGCGAGTCAGATGC-3’ (F) and 5’-TGGCTGATTGGTTTTCTGCT-3’ (R). The primers of GAPDH were: 5’-GCGGCCTCTGGCTCCTG-3’ (F) and 5’-CGCTCCTGGTCCACCA-3’ (R).
Statistical Analysis
mRNA expression data were presented as mean ± standard deviation, while GraphPad Prism 9 software (GraphPad Software Inc., La Jolla, CA, USA) was adopted for graphing. Data between both groups were compared by paired Student's t-test. P < 0.05 suggested the significance threshold.
Results
Screening and Enrichment Annotation of Significant DEGs
Samples were stratified into drug-resistant versus drug-sensitive groups based on the cell origin, and differential gene expression analysis was performed across three CRC cell lines (HCT116, HT-29, and DLD-1) using edgeR under standard thresholds (|log₂FC| > 1 and FDR < 0.05). Volcano plots (Figure 1A to C) identified 1,524, 5,882, and 743 significant DEGs in the respective comparison groups, while hierarchical clustering of these DEG expression profiles illustrated clear separation between phenotypic groups across the three cell lines (Figure 1D), confirming distinct transcriptional signatures. Through conducting consensus DEG integration via Venny 2.1, DEGs expressed in ≥ 2 cell lines were screened, yielding 1033 integrated DEGs (Figure 2). Subsequently, functional enrichment analysis was performed, which revealed significant associations with Gene Ontology (GO) biological processes of axon guidance (GO:0007411), angiogenesis (GO:0001525), cell adhesion (GO:0007155), signal transduction (GO:0007165), and positive regulation of endothelial cell proliferation (GO:0001938), as well as with KEGG pathways including aminoacyl-tRNA biosynthesis (hsa00970), homologous recombination (hsa03440), and cell cycle (hsa04110), as visualized in Figure 3A and B.
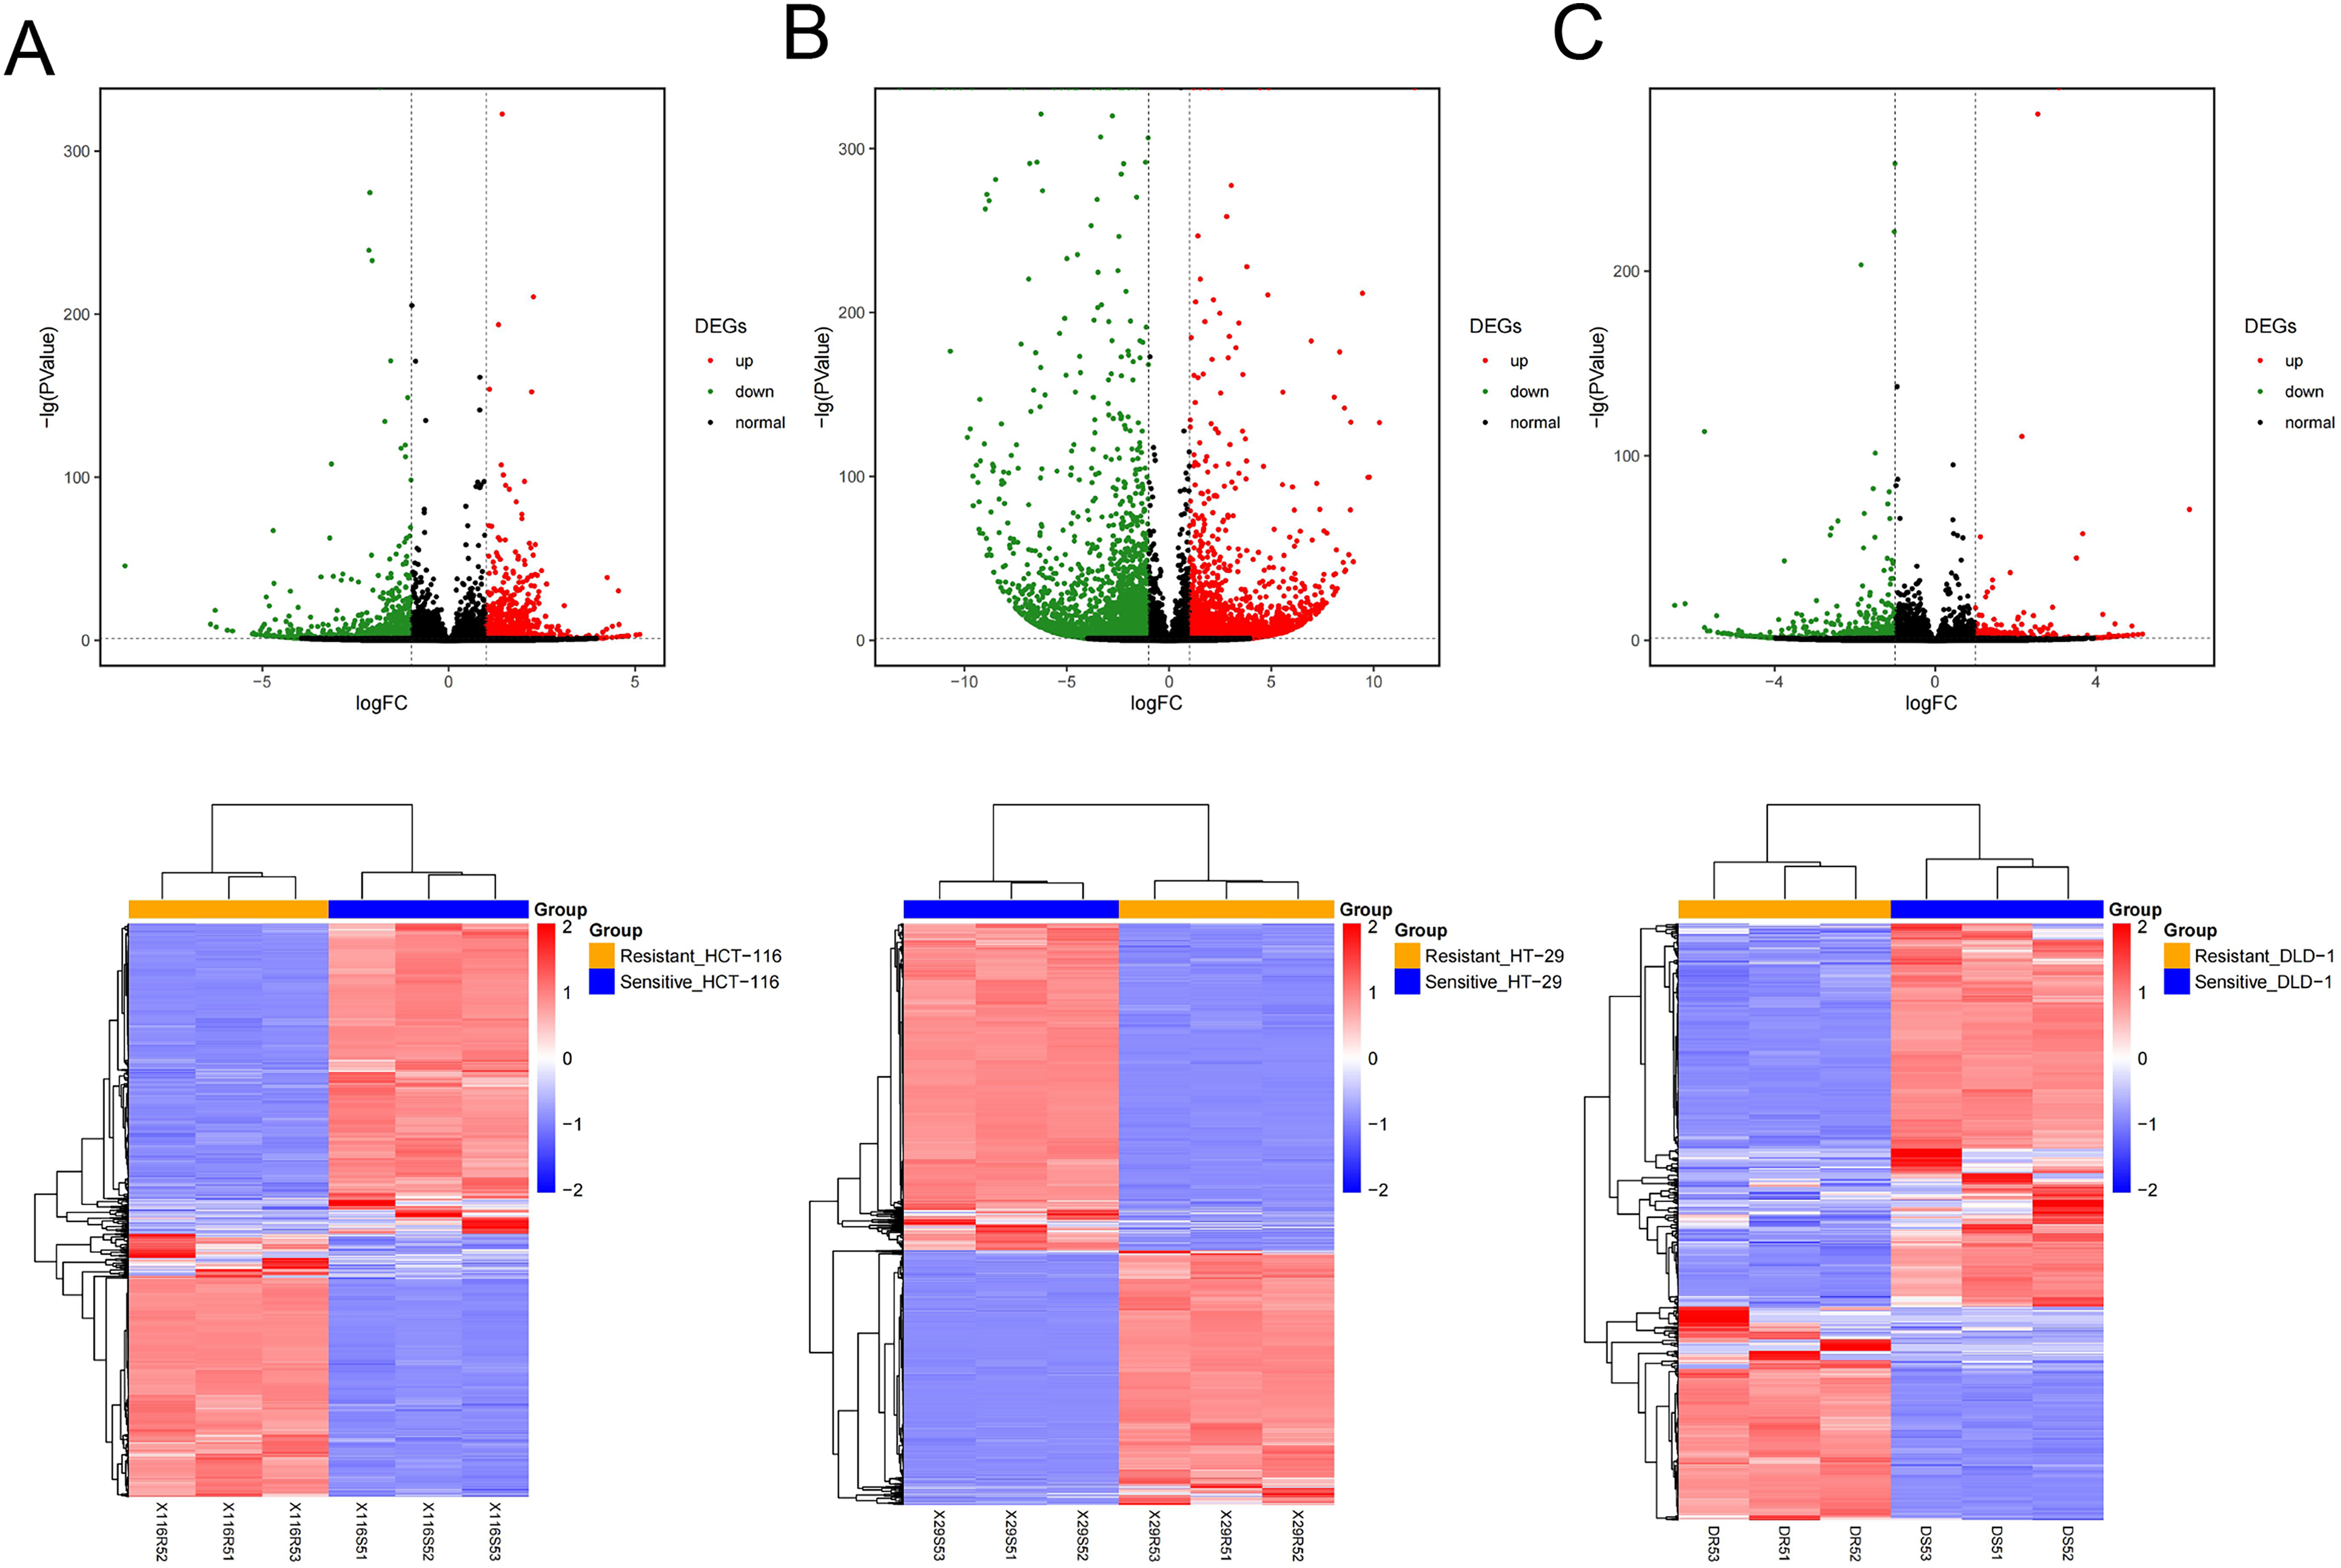
Results of significant DEGs sensitive versus resistant in the three cell lines.

Integration of venn diagrams for differential gene results across different cell lines.

Integration of GO and KEGG analysis points related to significant DEGs enriched.
The WGCNA Algorithm for Screening Gene Modules Significantly Related to Drug Resistance Characterization
Our analysis integrated 1033 significant DEGs and optimized the adjacency matrix weighting parameter (power) to establish a scale-free co-expression network. For meeting scale-free topology criteria, the optimal power value was determined through topology matrix analysis, selecting power = 30 with scale-free topology fit index (R2) exceeding 0.9 (Figure 4A). This configuration yielded an average node connectivity of 1, consistent with the small-world network properties. Later, hierarchical clustering was conducted with a dynamic tree-cutting threshold (cut height = 0.995) and minimum module size of 100 genes, identifying four distinct modules excluding the gray module (Figure 4B). According to the correlation analysis: ① the brown module (n = 198 DEGs) showed significant positive correlations with both cell type and drug-resistance phenotypes, whereas ② the yellow module (n = 150 DEGs) exhibited significant negative correlations with these traits (Figure 4C). Therefore, these two modules were prioritized for downstream analyses. Afterwards, these two modules were subjected to DAVID-based GO biological process enrichment, which demonstrated predominantly distinct functional profiles in their top 10 enriched terms, though one shared function was observed. The results were visualized in an integrated collaboration graph (Figure 5).

WGCNA analysis results.

Go BP enrichment analysis results of two significant co-expressed module genes.
Construction of the PPI Network
The STRING 12.0 database was utilized to identify PPIs among proteins encoded by genes from the brown and yellow modules, which were previously screened via WGCNA. Only interactions with scores > 0.4 were retained, and altogether 227 interaction pairs were obtained. A PPI network was subsequently constructed based on these pairs, as illustrated in Figure 6, comprising 138 nodes and 227 edges.
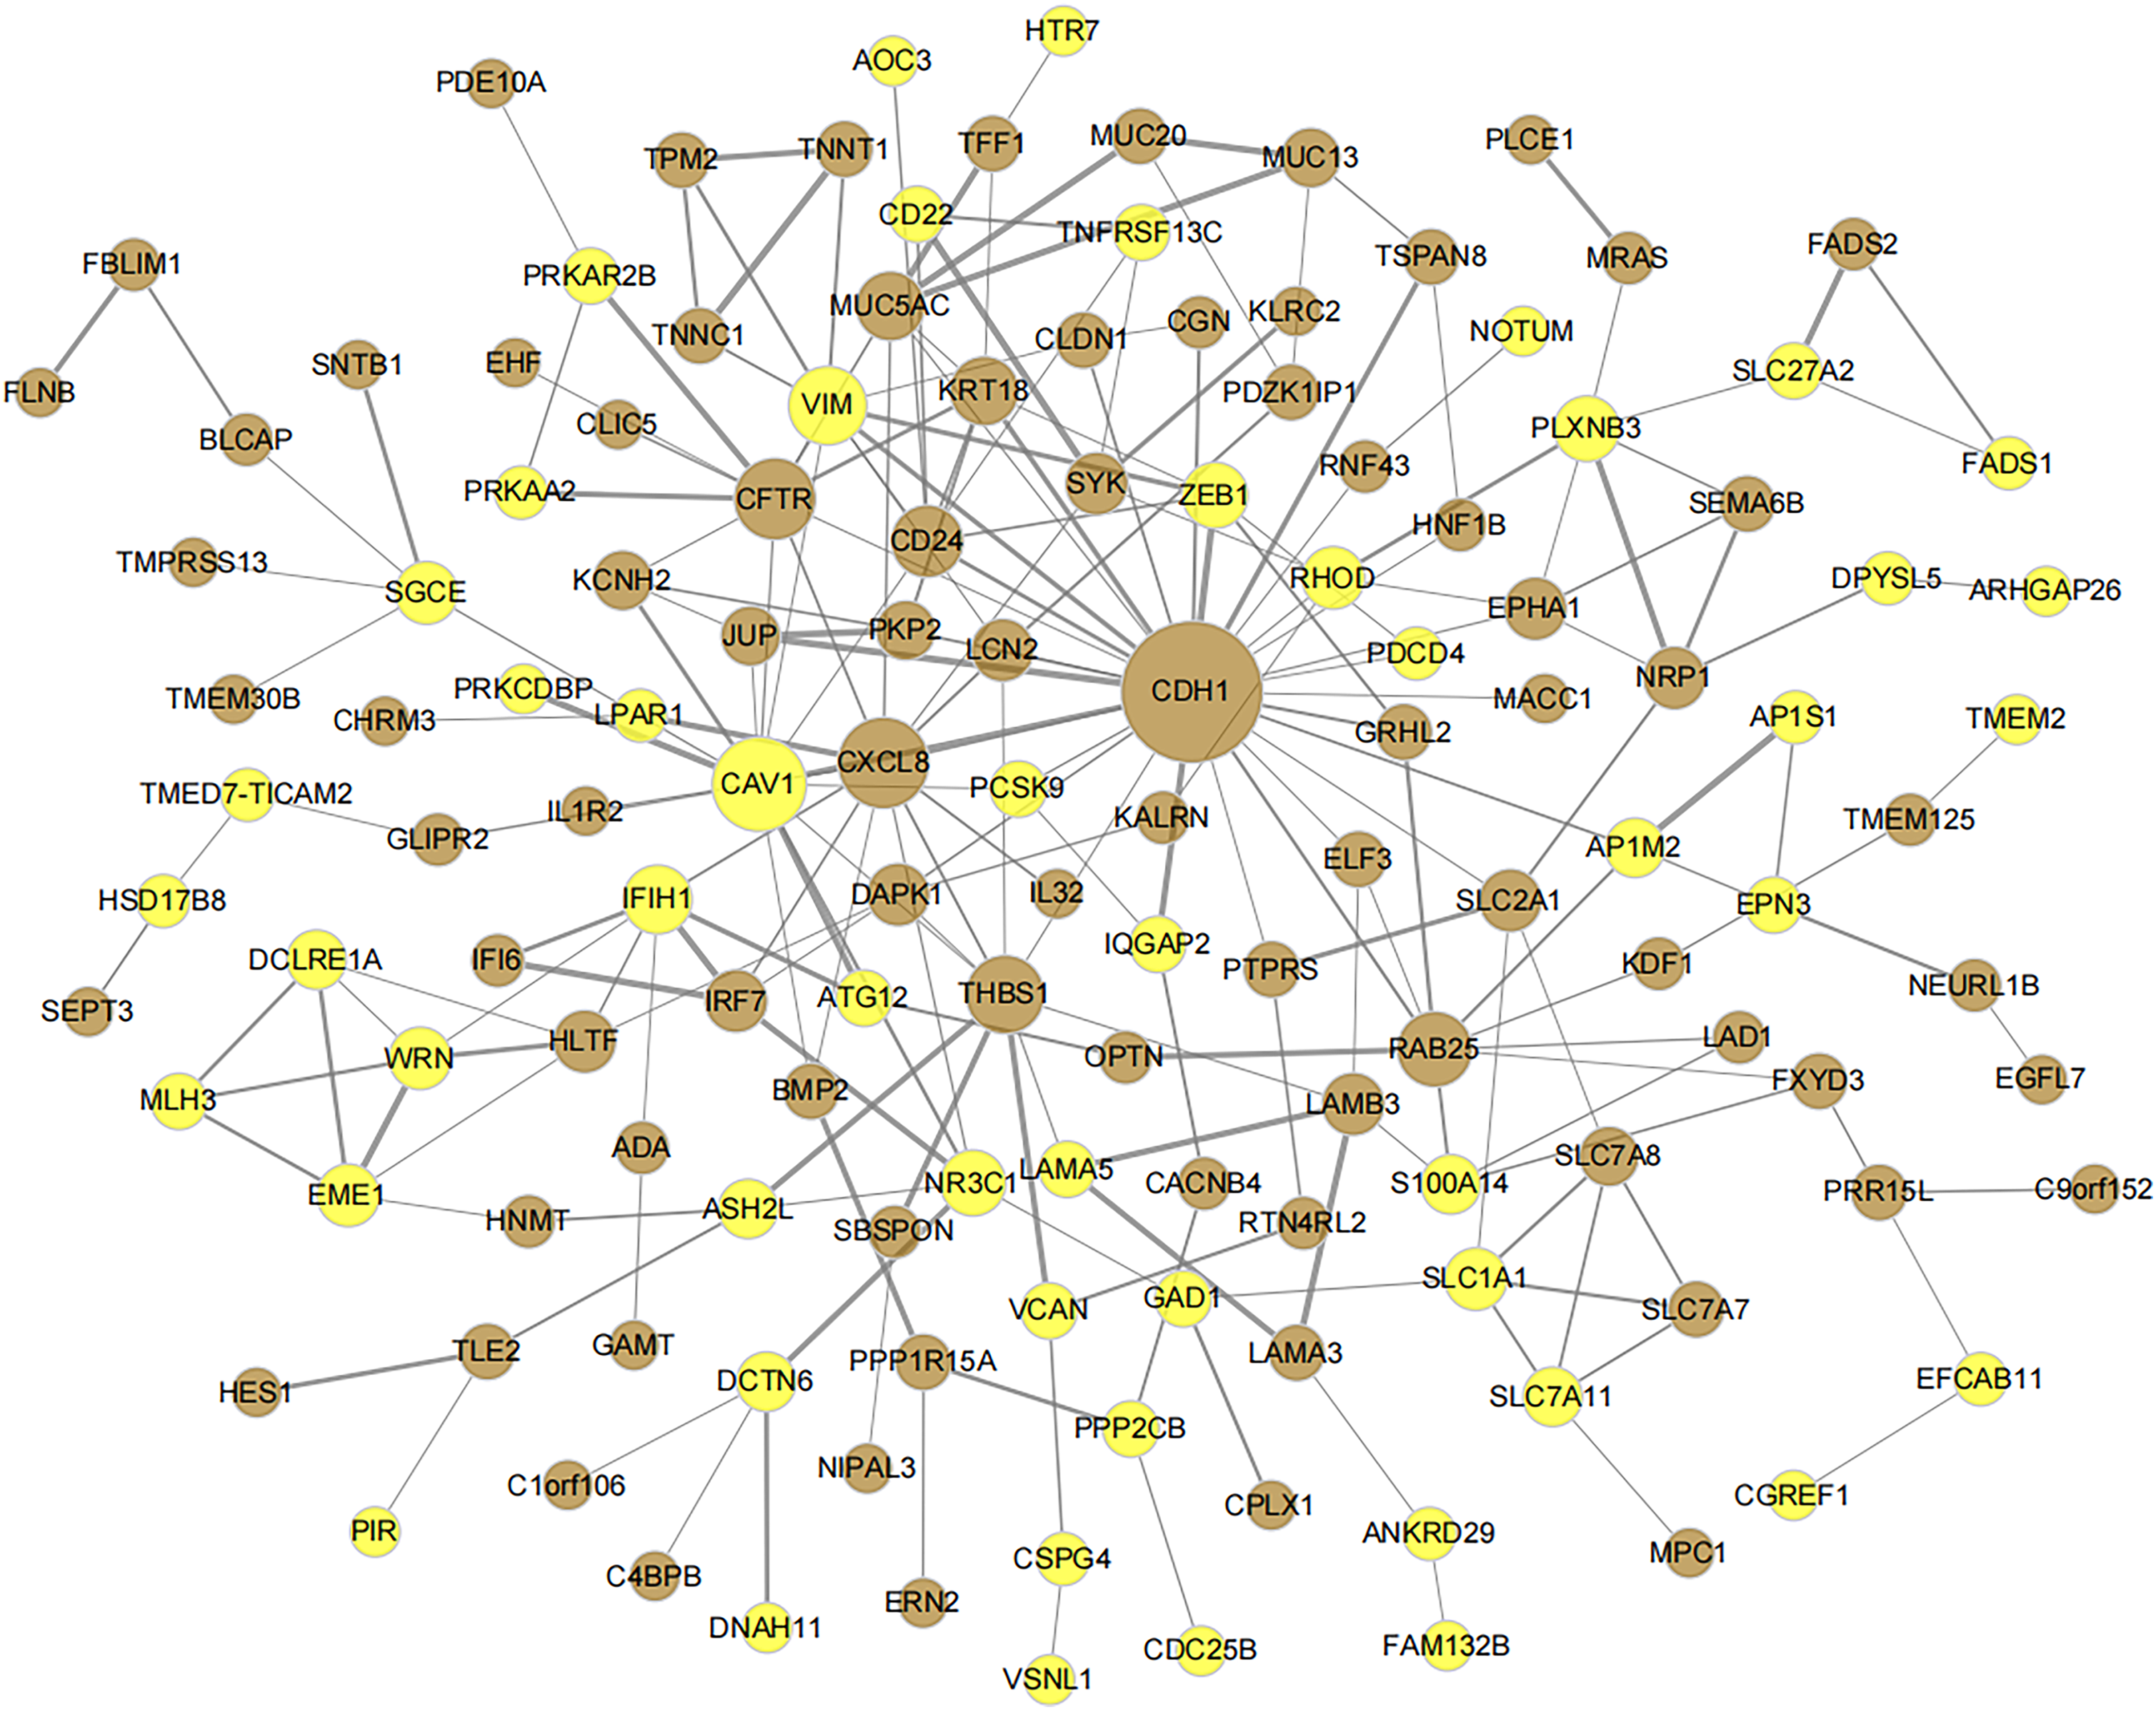
The significant co-expressed module gene product-protein interaction network diagram based on WGCNA. Brown represents the brown module gene in the WGCNA analysis results, and yellow suggests the yellow module gene. The larger node in the network graph indicates the higher degree of network connectivity and the higher importance of this gene in the network graph.
Thereafter, network extension analysis was performed on the PPI network to determine the degree of each gene, as presented in Table 1.
Degree of PPI Network Diagram.

TCGA-COAD Public Database Validation
Differential expression analysis of TCGA-COAD and survival prognosis KM analysis of the hub genes were performed. The results are presented in Table 2. As observed, CDH1, CAV1, CXCL8, CD24, NR3C1, and ZEB1 demonstrated significant associations with CRC prognosis. Their differential levels in TCGA-COAD are depicted in Figure 7, where CXCL18 was highly expressed in tumor tissues (P < 0.001), while CDH1, CAV1, CD24, NR3C1, and ZEB1 were significantly down-regulated within tumor tissues (P < 0.05). The impact of the above genes on OS in CRC patients is demonstrated in Figure 8. Besides, results of the pathways enriched by key hub genes (CDH1, CAV1, NR3C1, and ZEB1) are shown in Table 3.
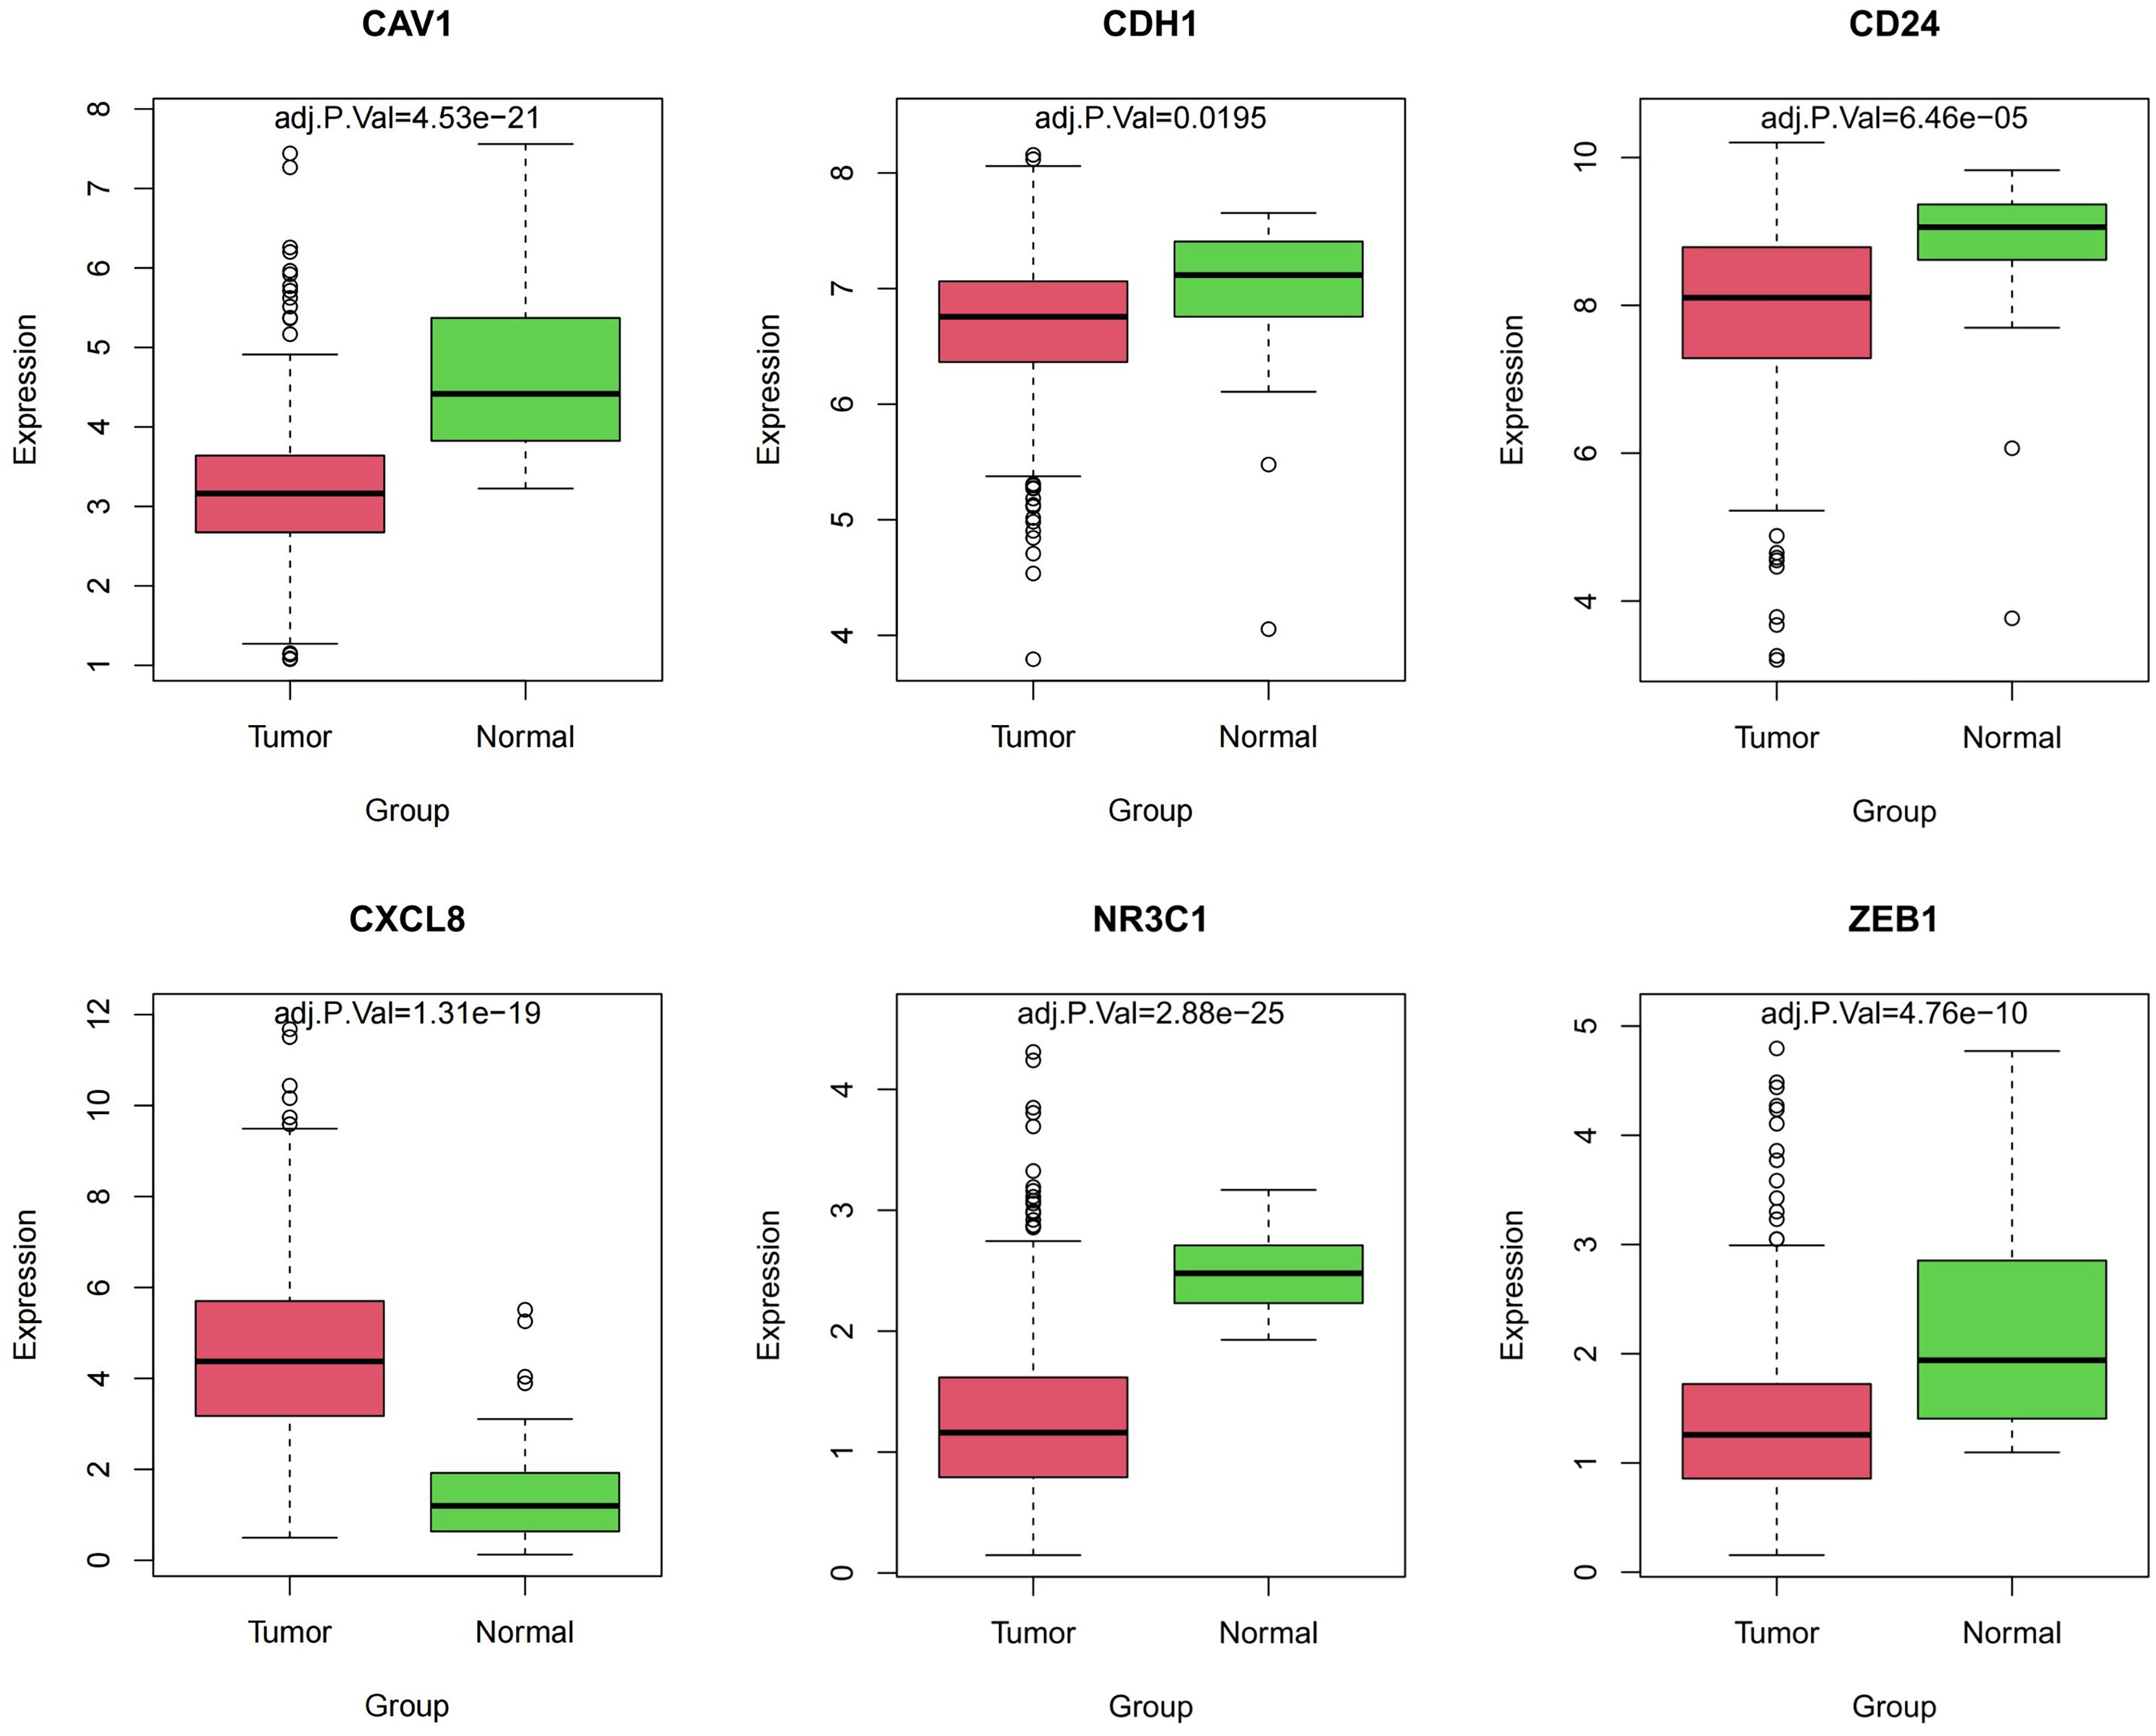
Key hub gene differential expression within TCGA-COAD datasets.

Os survival curve of key hub genes within TCGA-COAD datasets.
Expression and Prognostic Results of key hub Genes in TCGA-COAD Datasets.

The Results of the Pathways Enriched by key hub Genes.

Correlation Analysis Between key Genes and Drug Resistance
First, the IC50 values of 198 drugs were competed using the TCGA-COAD dataset. Then, both the IC50 values and hub gene expression levels were extracted from tumor samples, and the Pearson correlation coefficient along with the corresponding p-value was computed for each pair. Significant pairs were identified based on the correlation coefficient |r| > 0.5 and P < 0.05 criteria, and a correlation heatmap was subsequently plotted (Figure 9).

Heatmap showing correlations of key hub gene expression in TCGA-COAD datasets with drug IC50 values.
CDH1, CAV1, NR3C1, and ZEB1 Expression in CRC
In total, 24 paired CRC tumor tissues and normal tissues were collected to examine the mRNA expression of CDH1, CAV1, NR3C1, and ZEB1 by qRT-PCR. As discovered, their mRNA levels decreased within CRC tumor tissues (P < 0.01) (Figure 10A to D).
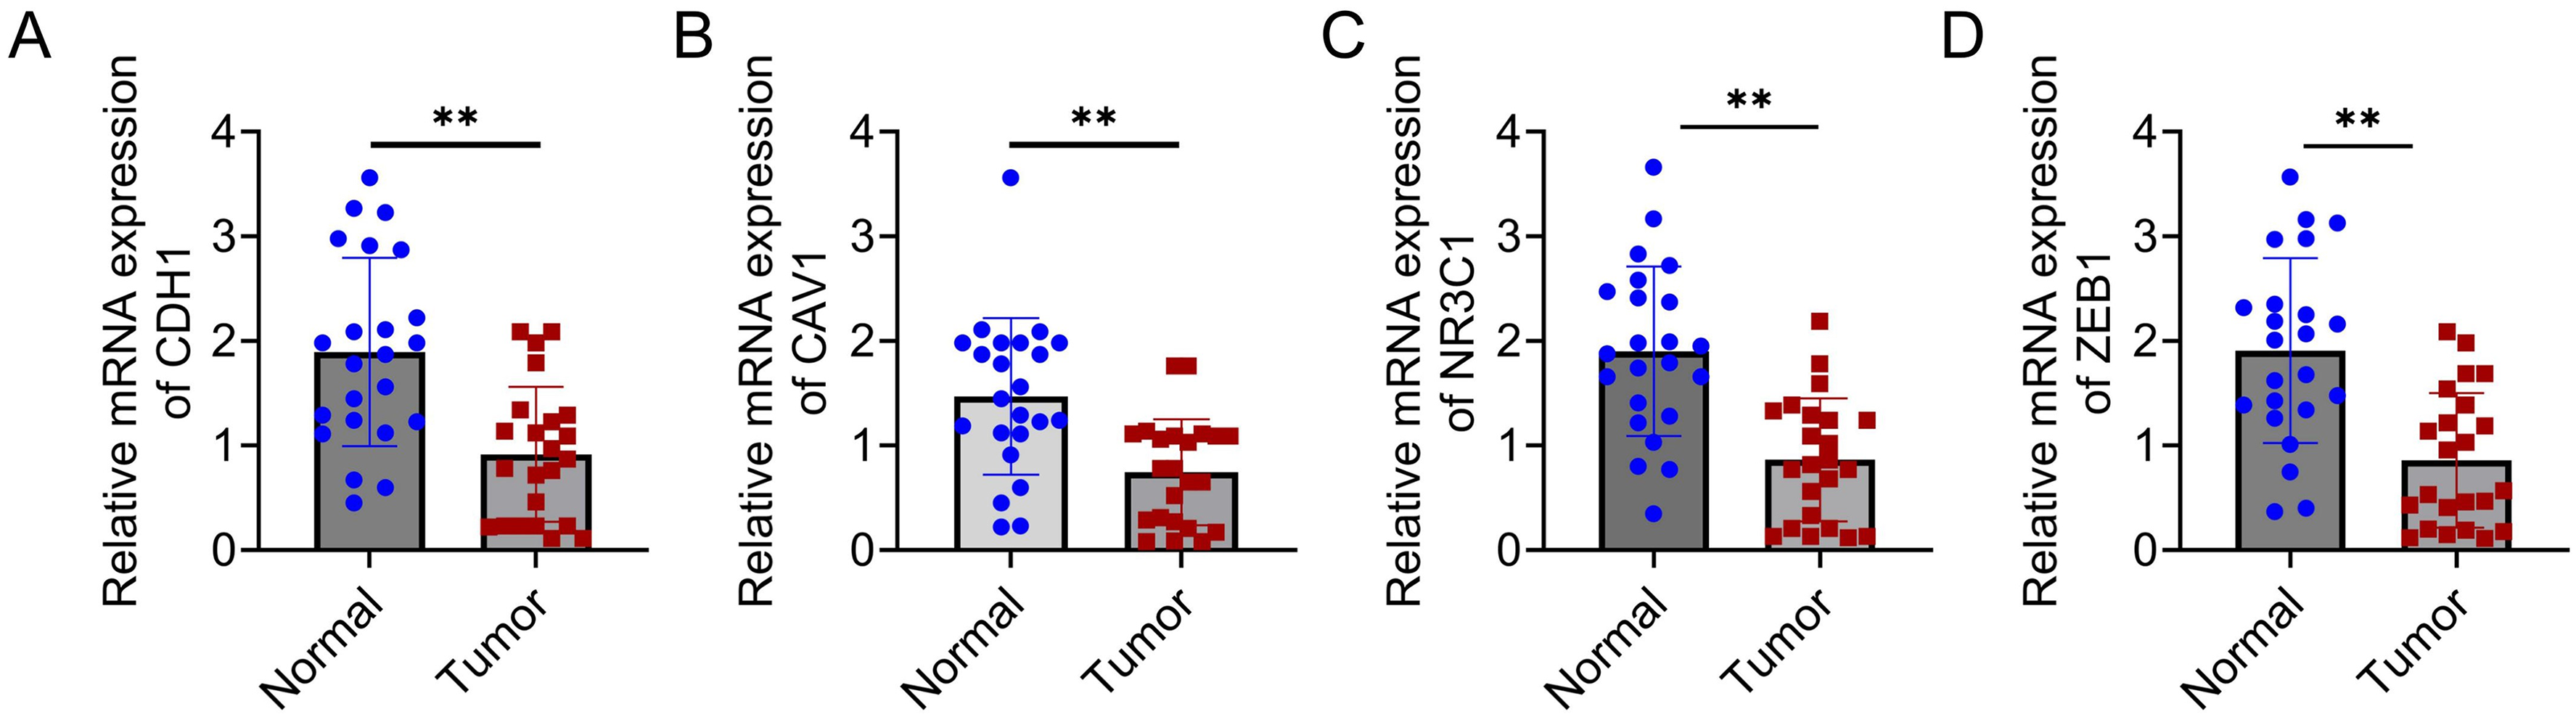
Clinical expression of CDH1, NR3C1, and ZEB1 in CRC
Discussion
CRC, which ranks third among cancers with regard to morbidity globally, causes over 2 million incident cases annually (GLOBOCAN 2023), and is still the second major factor inducing gastrointestinal cancer-associated mortality. First-line chemotherapeutic regimens incorporating 5-FU, such as FOLFOX and FOLFIRI, constitute the backbone of CRC systemic therapy. However, as demonstrated by relevant clinical evidence, 40–60% of advanced-stage patients develop suboptimal therapeutic responses, probably attributable to primary or acquired resistance, and the objective response rates (ORRs) are limited to 15–25%. The resistance mechanisms of CRC involve multidimensional regulatory networks: (1) the elevated dihydropyrimidine dehydrogenase (DPD) activity accelerates 5-FU catabolism; (2) the thymidylate synthase (TS) gene amplification or promoter hypermethylation reduces drug efficacy; (3) tumor-associated macrophages (TAMs) within tumor microenvironment (TME) release interleukin-6 (IL-6) to activate the PI3 K/AKT pro-survival signaling; and (4) aberrant non-coding RNA (ncRNA) expression (eg, miR-21 overexpression) facilitates apoptotic evasion. Currently, the available clinical interventions encompass combination targeted therapy (eg, bevacizumab for enhancing drug delivery), epigenetic modulation (DNA methyltransferase inhibitors for reversing TS silencing), and novel prodrug development (eg, capecitabine for tumor-selective activation). To make future breakthroughs, it is necessary to optimize personalized treatments through the dynamic monitoring of circulating tumor DNA (ctDNA), so as to overcome resistance barriers.
In this study, the GSE153412 dataset was analyzed and 1033 DEGs were identified. GSEA revealed that these DEGs were significantly enriched in KEGG pathways including aminoacyl-tRNA biosynthesis (hsa00970), microRNAs in cancer (hsa05206), bladder cancer (hsa05219), homologous recombination (hsa03440), small cell lung cancer (hsa05222), amoebiasis (hsa05146), proteoglycans in cancer (hsa05205), cell cycle (hsa04110), platinum drug resistance (hsa01524), and herpes simplex virus 1 infection (hsa05168), all of which were associated with drug resistance mechanisms. For GO analysis, the DEGs were enriched in molecular functions and cellular components such as extracellular matrix structural constituent (GO:0005201), single-stranded DNA-dependent ATP-dependent DNA helicase activity (GO:0017116), peptidase activator activity (GO:0016504), protein binding (GO:0005515), four-way junction DNA binding (GO:0000400), GTPase activator activity (GO:0005096), and core promoter proximal region sequence-specific DNA binding (GO:0000987). Using the WGCNA algorithm, gene modules strongly correlated with drug resistance phenotypes were identified, and the PPI network was later constructed, which prioritized CDH1, CAV1, CXCL8, CD24, NR3C1, and ZEB1 as hub genes. Furthermore, validation in TCGA-COAD datasets confirmed that these genes were significantly correlated with CRC survival outcomes. Moreover, correlation analysis further identified CDH1, CAV1, NR3C1, and ZEB1 as key regulators of drug resistance, among which, CAV1 demonstrated particularly strong involvement in endocytosis (hsa04144), bacterial invasion of epithelial cells (hsa05100), focal adhesion (hsa04510), proteoglycans in cancer (hsa05205), prion diseases (hsa05020), viral myocarditis (hsa05416), and fluid shear stress-induced atherosclerosis (hsa05418). Notably, according to previous studies,16–18 caveolin-1 (encoded by CAV1) plays a pivotal role in tumor cell transformation processes. Caveolin-1, a principal structural component of caveolae membranes, is predominantly localized to specialized invaginations on cell surface where it orchestrates key cellular processes like material trafficking, signal transduction, and multiple pathophysiological pathways. Different from its pro-tumorigenic role in certain contexts, caveolin-1 exerts the tumor-suppressing effect on lung cancer, as evidenced by a significantly decreased positive expression rate (58.46%) in cancer tissues relative to that in the non-carcinoma counterparts (100%), and its expression levels are inversely correlated with the metastatic potential. Mechanistically, caveolin-1 can suppress the proliferation of breast cancer by inhibiting the Ras/ERK signaling cascade, as demonstrated by its capacity to attenuate ERK phosphorylation and subsequently suppress the downstream oncogenic signaling19–21
Previous studies have investigated the roles of microRNA, circRNA, etc, in drug resistance in colon cancer, and biomarkers such as TBX15 and SDHB have also been reported.22–24 Our study is the first to integrate bioinformatics analysis with clinical validation for identifying CDH1, CAV1, NR3C1, and ZEB1 as the novel biomarkers for 5-FU resistance in CRC, shedding novel mechanistic lights on drug resistance pathways. While this study provides valuable insights, there are still several limitations to be noted. First, the experimental design relied exclusively on 18 cell line samples from GSE153412 under a single drug treatment condition (10 μM 5-FU for 24 h), which may inadequately capture clinical tumor heterogeneity and the dynamic evolution of drug resistance over the extended treatment periods. Second, although prognostic correlations of key genes (CDH1, CAV1, NR3C1, and ZEB1) were validated using TCGA datasets, their functional mechanisms remain unverified through in vitro/in vivo experimental models. Third, the cell line-based approach neglected critical TME factors (eg, cancer-associated fibroblasts and immune cell infiltration) that significantly modulate drug response. To address these gaps, future investigations should employ patient-derived organoids (PDOs) and humanized mouse models to validate the drug resistance-regulatory functions of candidate genes, utilize single-cell sequencing technologies to dissect specific contributions of genes like CAV1 to the tumor-microenvironment crosstalk, and develop combination treatment strategies targeting these key regulators while evaluating their potential as liquid biopsy biomarkers for clinical translation.
To conclude, our integrated bioinformatics analysis identified CAV1, CDH1, NR3C1, and ZEB1 as the robust biomarkers for CRC prognosis and chemoresistance. This was evidenced by their consistent differential expression levels, co-expression module membership in WGCNA networks, high-degree centrality in PPI interactions, and significant correlations with patient prognoses in TCGA-COAD datasets and clinical data validation. Mechanistically, these genes regulate key resistance pathways including extracellular matrix remodeling, drug efflux systems, and epithelial-mesenchymal transition (EMT), positioning them as promising targets for therapeutic intervention and prognostic stratification.
Footnotes
Acknowledgements
Not applicable.
Ethics Approval Statement
This study involving the collection and analysis of colon cancer patient samples was approved by the Medical Ethics Committee of The People's Hospital of Rugao (Approval No. RGEC-2021-GS011). Written informed consent was obtained from all participants prior to sample collection, authorizing the use of their clinical specimens and associated data for research purposes. The study protocol strictly adhered to the ethical principles outlined in the Declaration of Helsinki.
Informed Consent Statement
Written informed consent was obtained from all participants for the use of their clinical data in this study. The ethics approval statement (Approval No. RGEC-2021-GS011) and consent details are consistent across the title page and manuscript.
Author Contributions Statement
Pengfei Wu and Guodong Liu Conception and design of the research, Acquisition of data, revision of manuscript for important intellectual content;
Lening Shao: Acquisition of data, performing the experiment, drafting the manuscript;
Yongyou Wu: Analysis and interpretation of data; performing the experiment.
All the authors read and approvaled the manuscript.
Funding
The authors received no financial support for the research, authorship, and/or publication of this article.
Declaration of Conflicting Interests
The authors declared no potential conflicts of interest with respect to the research, authorship, and/or publication of this article.
Data Availability Statement
All data in this study can be obtained by contacting the corresponding author.