
Abstract
Introduction
Commercial automatic planning modules are currently limited to single, conventional disease types, which severely restricts their utility when dealing with unconventional plans. Given that such unconventional plans are actually the norm in most hospitals, there is an urgent need for an automatic planning algorithm that can be applied to a wide range of clinical situations. To address this issue, we developed an algorithm capable of automatically cropping target areas and setting optimization conditions for multiple diseases, known as the Auto Crop and Optimization Setup Algorithm (ACOSA). This paper presents the principles of ACOSA and conducts a preliminary comparative evaluation of its performance against existing solutions.
Methods
The development of ACOSA utilized the Eclipse Script Application Programming Interface (ESAPI) scripting language provided by Eclipse. Based on the input prescriptions, the algorithm simulates the operations of a physicist, automatically crops the target areas, and sets appropriate optimization parameters. Retrospectively, 20 cases of glioma and head and neck cancers were selected. Without considering organ-at-risk dose limits, dose calculations were performed using both ACOSA and Eclipse's built-in AutoCrop, and a dosimetric comparison was conducted.
Results
In terms of target volume homogeneity index (HI) and D98, the AutoCrop group demonstrated slight superiority over the ACOSA group. However, the ACOSA group exhibited superior performance in conformity index (CI), gradient index (GI), D2, and particularly in parameters reflecting the rate of low-dose fall-off outside the target volume, including Ratio20, Ratio30, and Ratio40, when compared to the AutoCrop group.
Conclusions
ACOSA can be reliably applied in clinical settings and demonstrates superiority over the AutoCrop module of the Eclipse planning system.
Introduction
With the continuous advancement of radiotherapy technology, the proportion of three- dimensional conformal intensity-modulated plans has gradually increased. To improve the efficiency and quality of intensity-modulated plan design, extensive research on automatic plan design has emerged, achieving significant progress. Early studies on dose prediction focused on predicting the dose distribution to Organs At Risk (OAR) based on the spatial relationship between OARs and target areas, thereby guiding plan design.1,2 With the advent of Eclipse RapidPlan technology, it became possible to automatically add optimization parameters based on predicted Dose-Volume Histograms (DVH), achieving automatic optimization of radiotherapy plans. Subsequent studies demonstrated that RapidPlan offers significant time and dosimetric advantages.3–5 Additionally, the Auto- planning feature of the Pinnacle planning system (Philips Healthcare, The Netherlands, Koninklijke Philips N.V., Amsterdam) also showed considerable time and dosimetric benefits. 6
Meanwhile, clinical medical physicists have increasingly explored the application of scripting to achieve various supportive functionalities7–9 as well as complete automated treatment planning workflows.10,11 However, all existing automated treatment planning implementations still exhibit limitations in terms of versatility and scalability, which prevents comprehensive coverage of clinical application scenarios and constrains the broader adoption of automated treatment planning technologies.
To address this issue, we designed a prescription-driven algorithm applicable to automatic target delineation and prescription dose setting for multiple disease sites, named the Auto Crop and Optimization Setup Algorithm (ACOSA). This lays the foundation for future development of multi-disease automated treatment planning. The purpose of this study is to develop the ACOSA algorithm and perform a preliminary evaluation of its performance. The latest Target AutoCrop function introduced in Eclipse Treatment Planning System version 15.5 shares similar functionality with ACOSA. Once enabled, AutoCrop automatically identifies overlapping target volumes with conflicting dose objectives and creates a 5-mm buffer zone between targets. According to Duan et al, 12 AutoCrop has demonstrated favorable clinical efficacy, making it a suitable comparator for evaluating ACOSA performance. AutoCrop does have certain limitations, including inflexible adjustment of constraint conditions, incompatibility with Multiple-Criteria Optimization (MCO), Stereotactic Radiosurgery Normal Tissue Objective (SRS NTO), and Automatic Lower Dose Objective (ALDO), and inability to be invoked through ESAPI, thus preventing integration into automated planning workflows. In contrast, the ACOSA algorithm has none of these restrictions and implements more rigorous logic for dose buffer zone configuration. Through comparison with the AutoCrop function, we can better assess the value and potential of the ACOSA algorithm in actual clinical applications.
Materials and Methods
General Information
Retrospectively, 20 cases of glioma and 20 cases of nasopharyngeal carcinoma treated with radiotherapy at our Department of Radiotherapy between January 2021 and January 2022 were selected. The study was approved by our institutional Ethics Committee. For comparative analysis, each patient received two treatment plans: one utilizing the ACOSA algorithm (script) and the other employing the AutoCrop feature (autocrop). All patients underwent contrast-enhanced Computed Tomography (CT) scans using a Philips big-bore Four-Dimensional Computed Tomography (4DCT) scanner (Philips Healthcare, Koninklijke Philips N.V., Amsterdam) in quiet breathing state, with a slice thickness of 3 mm.
Target Area Delineation and Prescription Dose
For glioma cases, the Gross Tumor Volume (GTV) was delineated by senior physicians according to the National Comprehensive Cancer Network (NCCN) Guidelines for Central Nervous System Cancers (Version 2.2025). Clinical Target Volume 1 (CTV1) and CTV2 were generated by expanding the GTV outward by 10 mm and 20 mm, respectively. Subsequently, Planning Target Volume1 (PTV1) and PTV2 were formed by expanding CTV1 and CTV2 outward by 3 mm, respectively. The prescription doses for PTV1 and PTV2 were set at 60Gy and 50.4Gy, respectively. For head and neck cancer cases, which included various disease types, target delineation was performed by senior physicians according to the NCCN Guidelines for Head and Neck Cancers (Version 5.2025), including Primary Gross Tumor Volume of Nasopharynx (PGTVnx), Primary Gross Tumor Volume of Neck Nodes (PGTVnd), PTV1 and PTV2. According to experimental requirements, the prescription doses were uniformly set at 70Gy, 66Gy, 60Gy and 50.4Gy, respectively.
Script
The ESAPI script interface provided by Varian allows users to read or manipulate patient plan data within the Eclipse planning system using C# code. Compared to other planning system script interfaces, ESAPI uses the C# programming language to call related built-in Eclipse functions and drive automatic planning. The C# language has inherent advantages in User Interface (UI) design, allowing for more comprehensive and flexible human- computer interaction and achieving functionalities that other scripting languages cannot. Leveraging this advantage, we designed a UI interaction interface to obtain prescription information, as shown in Figure 1, to gather different prescription information for various plans. The flowchart for the target area automatic constraint setting strategy is shown in Figure 2 (For details, see Supplemental Material 1). Where Tcurrent is the current target area being traversed in the list, A is a transitional structure, the definition is as follows: The spatial region covered by the dose fall-off from high-dose target volumes to the prescription dose level of the current target volume. The iterative update rule for transition structure A is as follows: In the initial state (first iteration cycle), A equals the current target volume; in subsequent cycles, A is updated through the following steps: expand the previous state of A by 3 mm in the craniocaudal direction and by DropLength in other directions, then merge it with the current target volume to obtain the new transition structure A. Tnew is obtained from Tcurrent-A based on the algorithm logic. The study assumes that, under ideal conditions, the dose outside the target volume falls by 10% every 2.5 mm; therefore, the calculation formula for DropLength is as follows:


Ui interface display.

Flowchart of target area cropping and optimization condition setting.
Where Dprevious is the prescription dose of the previous target area in the list, and Dcurrent is the prescription dose of Tcurrent. Before calculating V (%), Tprevious needs to be uniformly expanded to obtain Ring, with the expansion distance calculated as:

The formula for calculating V (%) is:

Plan Comparison
All plans were completed using the Eclipse 15.6 planning system (Varian Medical Systems, 2599 Barrett Commons Drive, Palo Alto, CA 94304, USA) and the TrueBeam accelerator model. The script generated Intensity-Modulated Radiation Therapy (IMRT) plans using 6 Megavoltage-Flattening Filter Free (6MV-FFF) energy with a dose rate of 1400 Monitor Units (MU)/min. The beam directions were automatically generated by the script, All plans used fixed beam angles, with glioma cases utilizing 7 beams and a minimum beam separation angle of 30 degrees, designed to irradiate the target from as close as possible. Nasopharyngeal carcinoma cases used 9 uniformly distributed beams. With a uniform collimator angle of 0 degrees, and no non-coplanar beams were used. Dose calculations were performed using the Anisotropic Analytical Algorithm (AAA) algorithm, calculation resolution is 0.25 cm.
To focus solely on the optimization strategy for target areas and avoid the influence of Organs at Risk (OARs), all plans did not consider OARs. Optimization conditions were generated using the script (The logic for optimization condition settings can be found Figure 2, and the volume and weight parameters are referenced in Supplemental Material 1), and after two rounds of optimization, the final dose was calculated. If any target area showed coverage below 95%, the prescription dose coverage was manually adjusted to 95%. This plan was saved as the Script plan.
A copy of this plan was made, and the lower limit of the target area was set to 100% of the prescription dose with a volume of 100%, and the upper limit was set to 103% of the prescription dose with a volume of 0. Since ACOSA uses 103% of the prescription dose for the upper limit, the same dose constraint was applied in AutoCrop. After selecting AutoCrop, two complete rounds of optimization were performed, and the dose was normalized in the same way, saving the plan as AutoCrop. To quantify the dose distribution of the target area, the following target area data were obtained:
Conformity Index (CI)
13
:

Where TVRI is the target volume covered by the 95% prescription dose, TV is the target volume, and VRI is the volume of the 95% prescription isodose.
Homogeneity Index (HI)
14
:

Gradient Index (GI):

Where VDprescription/2 is the volume covered by 50% of the prescription dose, and VDprescription is the volume covered by the prescription dose.
D2 and D98:
Represent the highest and lowest doses in the target area, respectively. 15
Radio40, Radio30, Radio20:

Where n is the target dose, Vn is the volume covered by nGy dose, and Vtarget is the volume of the target area.
Analysis Method
Statistical analysis was performed using IBM SPSS Statistics version 25. Based on the normality test results, different statistical methods were applied: for data that conformed to normal distribution, paired t-test was used for inter-group comparison; for data that did not conform to normal distribution, Wilcoxon signed-rank test was used for analysis. A p-value of < .05 (two-tailed) indicated statistical significance.
Results
Using internally developed scripts, DVH data were batch extracted, with data for gliomas presented in Table 1 and a representative case shown in Figure 3. Among these, only the p- value for PTV1's HI exceeded 0.05, indicating no statistical significance, while all other metrics demonstrated statistical differences. For statistically significant metrics, ACOSA outperformed AutoCrop across all indicators except for the dose metrics D98 and HI. Specifically: For PTV1: CI, GI and D2 improved by 0.01, 0.45 and 24 cGy respectively. For PTV2: CI, HI, GI, D2, Ratio40, Ratio30, and Ratio20 improved by 0.05, 0.01, 0.05, 24 cGy, 0.16, 0.26, and 0.3 respectively. As shown in Figure 3, the ACOSA-generated plan also exhibits a smaller low-dose region. The overall trends in DVH parameters for head and neck cancer cases were consistent with those observed in glioma cases, with detailed data presented in Table 2 and a representative case illustrated in Figure 4 (For details, see Supplemental Material 2).

(a) DVH comparison between script and AutoCrop groups. (b) Dose distribution comparison between script and AutoCrop groups.

(a) DVH comparison between script and AutoCrop groups. (b) Dose distribution comparison between script and AutoCrop groups (For details, see Supplemental Material 2).
Dosimetric Parameters Comparison Between Script and Auto Crop (Mean ± Standard Deviation).
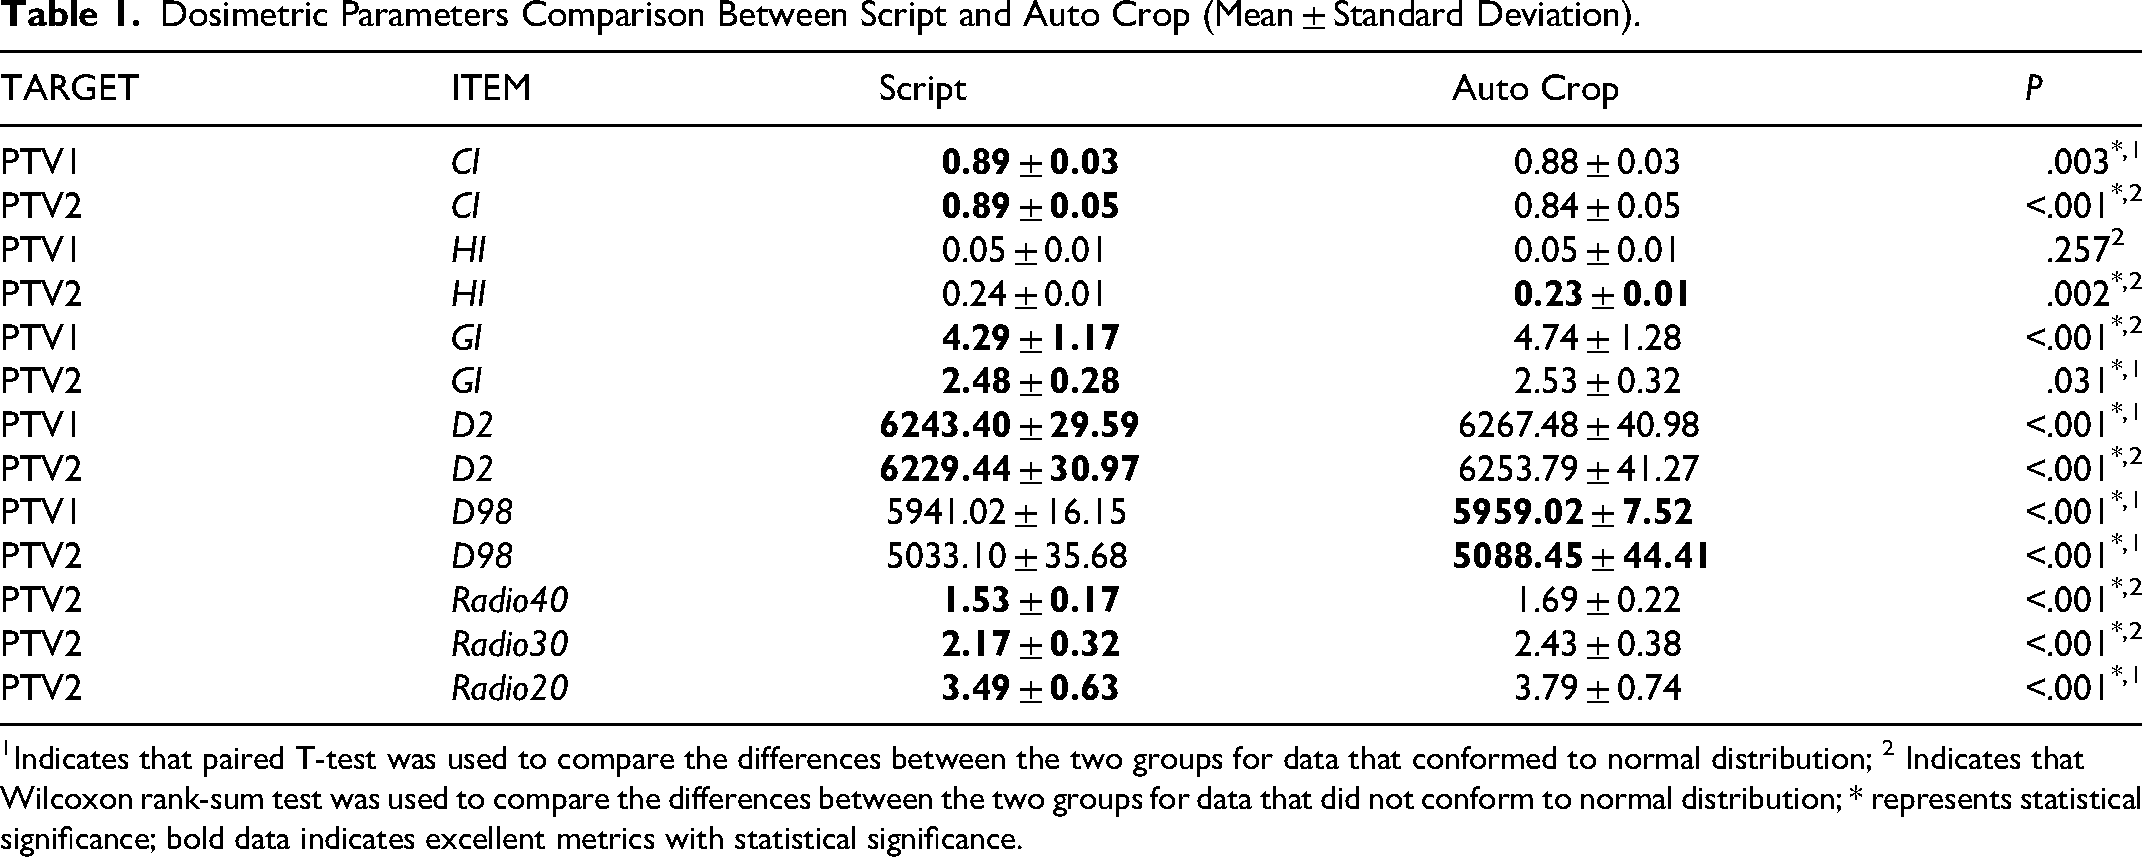
Indicates that paired T-test was used to compare the differences between the two groups for data that conformed to normal distribution; 2 Indicates that Wilcoxon rank-sum test was used to compare the differences between the two groups for data that did not conform to normal distribution; * represents statistical significance; bold data indicates excellent metrics with statistical significance.
Discussion
In recent years, the rapid development of artificial intelligence has transformed the methods for achieving automatic planning, making AI-based automatic planning a research hotspot with promising results. 16 Current mainstream algorithms, such as deep neural networks and convolutional deep neural networks, essentially focus on feature extraction and classification, requiring large amounts of homogeneous data for training. With the support of vast datasets, AI algorithms extract higher-dimensional features for automatic planning, resulting in AI-based automatic plans generally outperforming script-based plans in terms of quality. However, the biggest drawback of this approach is its lack of flexibility. 17 Models trained on large sample datasets can only be applied to plans that are homogeneous with the training data, meaning that prescriptions, delineation habits, and naming conventions must match the training data exactly, or unexpected results may occur.
This method may improve efficiency in medical institutions where a single disease or a few types of tumors predominate. However, in many hospitals, cancer cases are diverse and complex, often at advanced stages, with some patients undergoing second or even third courses of radiotherapy. These patients have complex conditions and non- uniform prescriptions, making it difficult to apply even commercially available automatic planning modules,18,19 such as Eclipse's RapidPlan or Pinnacle's Auto-Planning, in clinical practice. For these reasons, clinical practitioners need a flexible and broadly applicable automatic planning algorithm.
To make an algorithm applicable to multiple diseases, it must address the different target areas and dose gradients required for each disease. Simple plans may have a single prescription dose, while complex plans have no upper limit, and the spatial relationships between target areas can be very intricate. Simple script logic cannot achieve this, and research in this direction is sparse. Therefore, we designed ACOSA using ESAPI as an interface.
Compared to the commercial AutoCrop module, the ACOSA algorithm demonstrated superior dosimetric advantages. The study results revealed that the AutoCrop group showed slightly better performance in terms of homogeneity index (HI) and D98 metrics compared to the ACOSA group. However, for all other metrics—particularly dose fall-off related parameters—the ACOSA group exhibited significant advantages. Figures 3 and 4 illustrate that the ACOSA group achieved faster dose fall-off within the target volume and smaller low-dose regions. Through empirical analysis, this phenomenon was primarily attributed to two factors: First, when using AutoCrop, the Eclipse treatment planning system restricts the optimization condition settings for targets, which prevents the NTO (Normal Tissue Objective) from functioning properly. Second, AutoCrop employs a uniform 5 mm ring margin setting between different target volumes, whereas ACOSA establishes individualized margin strategies based on dose gradients between target volumes. Based on these mechanisms, plans generated by ACOSA demonstrated superior performance in maximum dose values, conformity index, and low-dose fall-off speed compared to the AutoCrop approach. Correspondingly, due to restricted low-dose fall-off, AutoCrop plans showed marginal advantages in D98 and HI metrics. Furthermore, it should be particularly noted that all AutoCrop operations are performed automatically in the background, preventing physicists from intervening in the process. This limitation precludes fine-tuning of target volume optimization parameters when using this approach. In contrast, the script-based ACOSA algorithm does not possess such limitations. Lou et al also conducted similar multi-disease automatic planning research. 20 However, unlike our study which employs a single script logic to automatically crop target volumes and set prescription optimization conditions, they preset dedicated templates for each disease type. Essentially, this represents an integration of single-disease automatic planning approaches, which still cannot meet complex and variable clinical requirements. Although this study only used cases from two anatomical sites to validate algorithm performance, head and neck cancer cases inherently encompass multiple disease types and different target delineation methods, sufficiently demonstrating the algorithm's versatility. In addition, we fully leveraged the advantages of ESAPI in UI design 21 to develop a feature-rich interactive interface that can conveniently obtain radiotherapy prescription information, effectively lowering the barrier to script usage and significantly enhancing the user interaction experience.
The ACOSA approach also has its limitations. Firstly, the algorithm is not suitable for unconventional fractionation, and due to its strict constraints on dose fall-off, it is not applicable to radiotherapy plans that require sacrificing conformity, such as breast cancer and mediastinal tumors. The final 2.5 mm in Formula 1 is an empirical value, which, under optimal conditions, can achieve a 10% dose fall-off, but this empirical value is not applicable to all situations. The multiplier of 3.5 in Formula 2 and the addition of 5 in Formula 3 are values found to be relatively suitable after repeated experiments. These are areas that need further refinement in future work. Secondly, we did not consider organ-at-risk (OAR) dose constraints when comparing the ACOSA algorithm and the AutoCrop function, in order to eliminate confounding factors and purely evaluate the performance differences of the two algorithms in terms of target volume dosimetry. This approach enabled us to more clearly understand the characteristics of the algorithms themselves, without being influenced by different OAR constraint settings. However, this differs from actual clinical practice, as OAR protection is a critical factor that must be considered when developing radiotherapy plans in real clinical environments. Despite this limitation, our study results remain significant because they reveal the fundamental performance differences between the two algorithms in target volume optimization. Finally, this study primarily focused on the performance of the algorithm in automatic target cropping and optimization setting, and did not involve the complete planning process, so other important parameters in treatment plan evaluation were not included in the comparative analysis, such as plan complexity and execution time.
Future research will prioritize the integration of organ-at-risk protection mechanisms and automatic iterative optimization functions to build a complete automated planning workflow, conduct more comprehensive comparative analyses, and better meet clinical needs. Subsequently, we will also attempt to combine with artificial intelligence to further enhance the clinical practice value of the script.
Conclusion
In conclusion, we developed the ACOSA algorithm based on the ESAPI interface, which is capable of prescription-driven automated target delineation and optimization condition setting for multiple disease types. Overall, ACOSA outperforms the AutoCrop module in terms of performance and offers greater flexibility, laying the foundation for achieving automated radiotherapy solutions for multiple disease types.
Supplemental Material
sj-docx-1-tct-10.1177_15330338251411617 - Supplemental material for ACOSA: A Script-Based Algorithm for Multi-Disease Target Crop and Optimization in Radiotherapy
Supplemental material, sj-docx-1-tct-10.1177_15330338251411617 for ACOSA: A Script-Based Algorithm for Multi-Disease Target Crop and Optimization in Radiotherapy by Han Guo, Zhiqing Xiao, Huandi Zhou, Yanqiang Wang, Miao Wang, Xiaotong Lin, Junling Liu, Xiuwu Li and Xiaoying Xue in Technology in Cancer Research & Treatment
Supplemental Material
sj-docx-2-tct-10.1177_15330338251411617 - Supplemental material for ACOSA: A Script-Based Algorithm for Multi-Disease Target Crop and Optimization in Radiotherapy
Supplemental material, sj-docx-2-tct-10.1177_15330338251411617 for ACOSA: A Script-Based Algorithm for Multi-Disease Target Crop and Optimization in Radiotherapy by Han Guo, Zhiqing Xiao, Huandi Zhou, Yanqiang Wang, Miao Wang, Xiaotong Lin, Junling Liu, Xiuwu Li and Xiaoying Xue in Technology in Cancer Research & Treatment
Footnotes
Abbreviations
Acknowledgment
The authors gratefully acknowledge VARIAN Medical Systems for their technical support and guidance in implementing the ESAPI (Eclipse Scripting Application Programming Interface) platform.
Ethical Considerations
The study was approved by the Ethics Committee of the Second Hospital of Hebei Medical University(Protocol #2023-R270), the requirement for informed consent to participate has been waived by the Ethics of the Second Hospital of Hebei Medical University.
Consent to Participate
The requirement for informed consent to participate has been waived by Ethics Committee of the Second Hospital of Hebei Medical University.
Consent for Publication
Not applicable
Author Contributions
Xiaoying Xue, PhD: Conceptualization, Methodology, Validation, Funding acquisition, Investigation, Project administration.
H Guo, MSc: Methodology, Writing-original draft, Software, Validation, Visualization.
Z Xiao, MSc: Conceptualization, Investigation, Supervision, Writing-review & editing.
H Zhou, MD: Methodology, Validation, Writing-review & editing.
Y Wang, BSc: Formal analysis, Writing-review & editing.
M Wang, MSc: Data Curation, Writing-review & editing.
X Lin, MSc: Formal analysis. Resources.
J Liu, BSc: Data Curation, Visualization.
X Li, MSc: Resources, Validation.
Funding
The authors disclosed receipt of the following financial support for the research, authorship, and/or publication of this article: This work was supported by the The Medical Science Research Project of Hebei Province (grant number 20241170), Hebei Natural Science Foundation (grant number H2023206913; J230003).
Declaration of Conflicting Interests
The authors declared no potential conflicts of interest with respect to the research, authorship, and/or publication of this article.
Supplemental Material
Supplemental material for this article is available online.
References
Supplementary Material
Please find the following supplemental material available below.
For Open Access articles published under a Creative Commons License, all supplemental material carries the same license as the article it is associated with.
For non-Open Access articles published, all supplemental material carries a non-exclusive license, and permission requests for re-use of supplemental material or any part of supplemental material shall be sent directly to the copyright owner as specified in the copyright notice associated with the article.