
Abstract
Introduction
Positron emission tomography-based biology-guided radiotherapy is an advanced radiation therapy technique that utilizes real-time imaging data from radiopharmaceuticals to deliver a tracked dose to a targeted area. The uptake of positron emission tomography radiopharmaceuticals in the same patient can vary due to changes in physiological condition and response to treatment. Thus, the robustness of the therapeutic approach under various uptake conditions is a property that needs to be understood.
Methods
An 18F-fluorodeoxyglucose fillable cylindrical phantom, which contained a spherical target measuring 22 mm in diameter and a c-shaped organ-at-risk, was placed inside the ArcCHECK device. Two treatment plans with identical constraints were developed, each based on unique planning positron emission tomography images, using the RefleXion X1 system. Plan 1 was based on a planning image with a target-to-background ratio of 8:1 while plan 2 was based on a planning image with a target-to-background ratio of 4:1. All pre-treatment go-no-go thresholds were disabled to allow all fractions to proceed to treatment regardless of PET characteristics. Twenty-five fractions of plan 1 were delivered in groups of five consecutive fractions, using phantoms prepared with different target-to-background ratios ranging from 10:1 to 2:1. Five fractions of plan 2 were delivered based on a phantom prepared with a similar target-to-background ratio as the plan. Each treatment fraction was characterized by its target activity concentration, normalized target signal, and effective target-to-background ratio. Treatment accuracy was evaluated using the 3%/2mm absolute gamma criteria.
Results
For plan 1 and plan 2, 91.7% and 40% of deliveries exceeded a 90% 3%/2mm absolute gamma threshold, respectively. Of these deliveries which would be clinically allowed by the machine, 100% exceeded the 90% 3%/2mm.
Conclusion
For deliveries meeting the minimum activity concentration and normalized target signal requirements for target-to-background ratios of 6:1 to 10:1, positron emission tomography-based biology-guided radiotherapy demonstrated robust, and accurate treatment results for static targets. For target-to-background ratios of 2:1 and 4:1, which are not clinically deliverable, the treatment gamma results demonstrated signal-limited instability.
Introduction
Positron emission tomography (PET) is a highly sensitive modality capable of visualizing 3D biodistributions of picomolar radiopharmaceutical quantities. 1 Driven by patient physiology, the use of target-specific tracers provides a mechanism of contrast for staging primary masses. When applied to radiotherapy, PET has been demonstrated to improve outcomes by better defining the target volume for treatment planning.2,3 Biology-guided radiotherapy (BgRT)4,5 builds upon the strengths of PET by utilizing 18F-fluorodeoxyglucose (FDG) to exploit the high levels of metabolic activity of cancerous tissue and use that signal as a fiducial to guide external beam radiation. Using a novel rotating dual-arc PET system positioned perpendicular to an in-plane 6-megavolt (MV) linear accelerator (LINAC), the PET signal can be measured and processed in real-time to modulate fluence and achieve a tracked therapeutic delivery. The technology is cleared for treating tumor volumes in lung and bone using the PET radiotracer FDG. 6
FDG-fillable phantoms are employed to facilitate a comprehensive assessment of PET image quality in the context of BgRT, as well as to evaluate the accuracy of therapeutic dose delivery under static, bone-lesion mimicking conditions.
7
In oncological screenings using PET, standard uptake values (SUV) for lytic and mass bone lesions
8
can achieve an
In this work, we evaluated the impact of the PET signal variations10–12 between planning and delivery on the dosimetric accuracy of BgRT, as the uptake and distribution of FDG in a patient can change after simulation due to 1) fasting state of the patient, 2) reduced uptake due to the obliteration of tumor vasculature from hypofractionation, 3) increased uptake due to tumor growth/resistance during treatment. Thus, accurate delivery of BgRT under a range of physiological conditions is paramount. This study experimentally examined BgRT dosimetry when PET target-to-background ratio (TBR) deviations occur between planning and delivery, using a treatment plan created with a TBR of 8:1 and treatment TBRs ranging from 2:1 to 10:1 during BgRT delivery. Clinically relevant activity levels were used throughout planning and delivery. Additionally, the impact of radioactive decay on therapeutic accuracy was examined for each of the treatment TBRs listed above. Furthermore, a 4:1 TBR planning PET with a 4:1 TBR treatment PET was also delivered to assess the impact of low TBR PET on plan-to-delivery agreement. The true TBR, effective image TBR, normalized target signal (NTS), activity concentration (AC), and delivery accuracy using a 3%/2mm absolute gamma metric are reported.
Materials and Methods
Biology-guided Radiotherapy with Positron Emission Tomography
BgRT aims to define a new set of requirements driven by conventional clinical external beam radiotherapy (EBRT) standards and the integration of radiotracers to guide EBRT in real-time.
13
Equation 1 redefines conventional radiotherapy treatment planning (i.e., image-guided radiotherapy) by including PET projection data. The planned dose (D) is a linear transformation of the dose calculation matrix (A) and fluence (

To implement this transformation in practice, BgRT calls upon the well-established filtered back-projection (FBP) reconstruction method to quickly generate near real-time images to identify the presence of a tracer-avid target. These rapidly acquired PET scans, termed limited-time-sampled (LTS) PET images, are input to the BgRT delivery algorithm. The algorithm maps LTS images to fluence to determine the multi-leaf collimator (MLC) segmentation and beamlet delivery in real-time. A key property of FBP PET images is linearity, as shown in Equation 2 – i.e., any FBP PET scan of conventional clinical acquisition length is equivalent to the summation of a series of individual LTS PET images,

To enable BgRT treatment, the plan must have a relationship with the LTS images to accurately deliver the treatment dose. It is assumed, see Equation 3, that the PET image used in planning is an adequate representation of the PET image to be acquired during treatment. This allows BgRT to relate the treatment plan created using planning PET to the individual LTS PET images to be acquired during delivery.


In practice, since the planning PET and treatment PET sinogram data are never identical, the preservation of the planned prescription dose under various radiopharmaceutical uptake conditions must be investigated to demonstrate maintained treatment accuracy.
RefleXion Medical X1 System
The RefleXion
TCT1410859-struc0x.png○R\c:IMG X1 (Hayward, CA), 14 as shown in Figure 1, is a multi-modal imaging and therapy system that includes both PET and CT imaging systems. Within the operational workflow of the device, localization is first performed with the onboard fan-beam kilovoltage computed tomography (kVCT) X-ray beam. 15 Upon completion of the localization process using kVCT, the couch moves towards the PET-LINAC isocenter. At this stage, a PET image can be acquired either for planning or, with an appropriately created BgRT plan, for a pre-treatment PET evaluation to determine if the patient has sufficient signal to proceed to delivery.
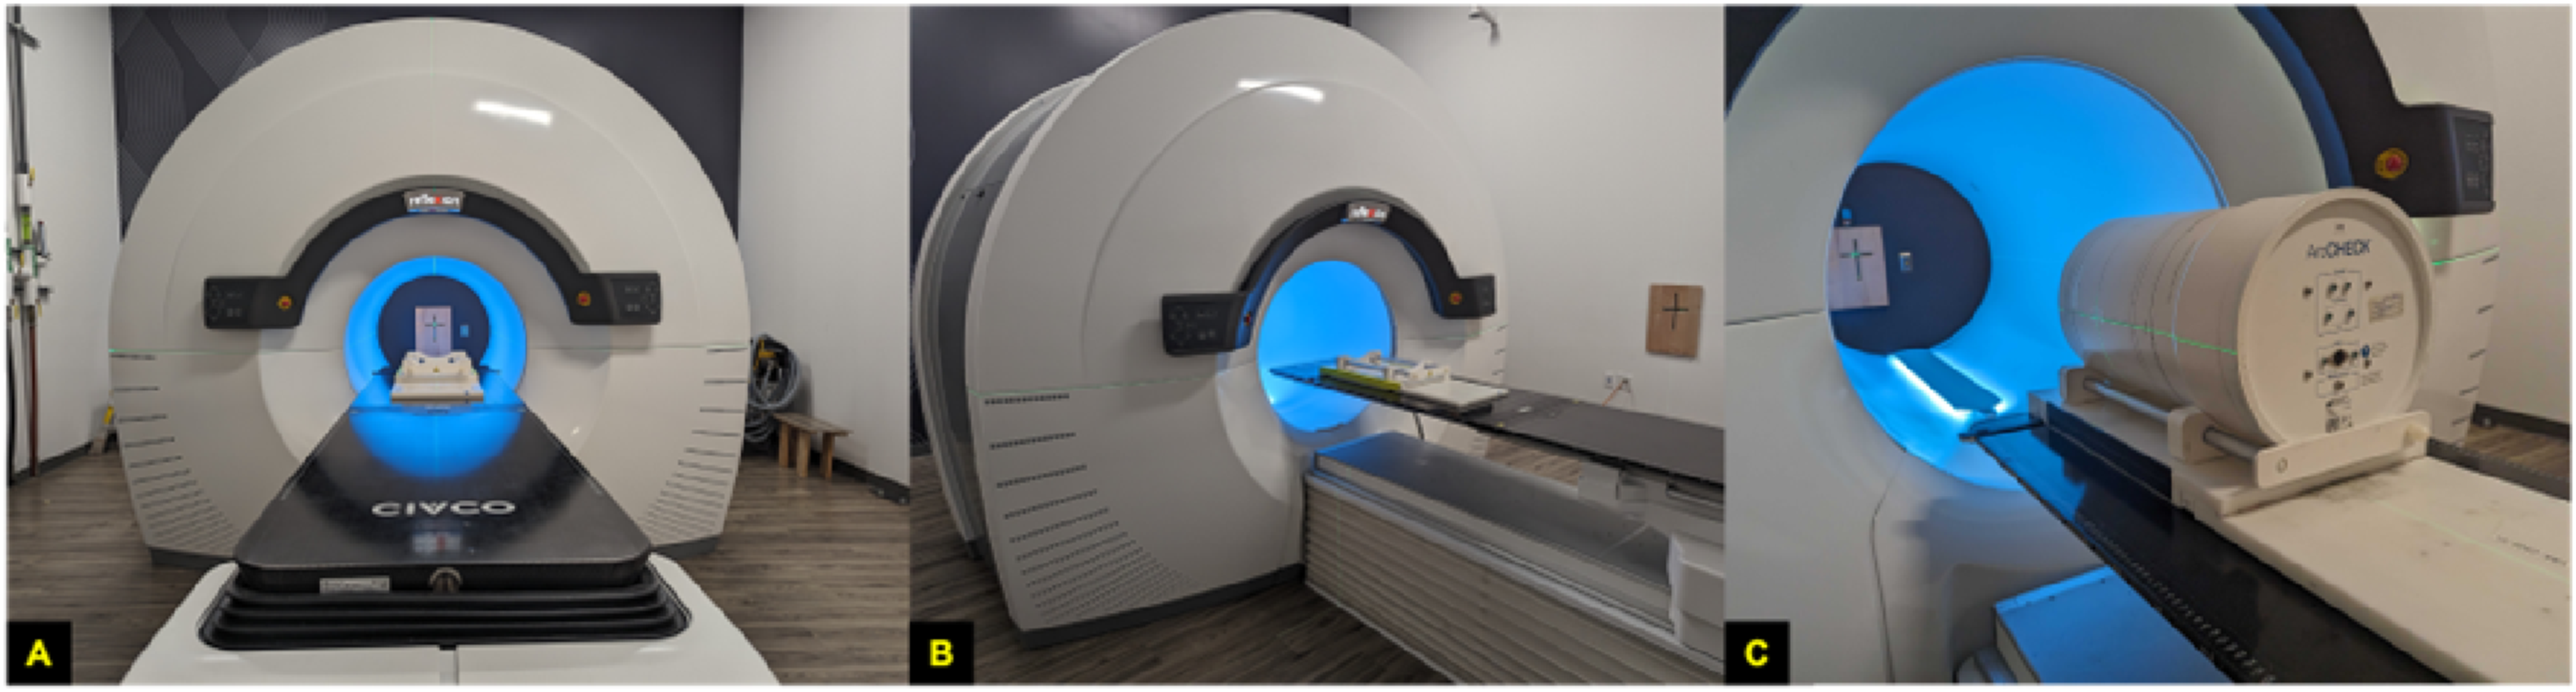
(A) X1 System view along IEC-Y (B) Side view with ArcCHECK base on couch. (C) ArcCHECK plus base on X1 couch.
The X1 kVCT uses an X-ray tube with a peak of 120 kV and a max amperage of 400 mA. The subsystem covers a 500 mm transverse field of view (FoV) with a 16 slice fan-beam geometry achieving a per slice thickness of 1.25 mm. The PET subsystem utilizes silicon photomultipliers (SiPMs) coupled with lutetium-based scintillators featuring 4.14 mm x 4.14 mm x 20 mm crystals. A total of 64 detector modules are arranged in two PET arcs (32 per arc) mounted at 90 degrees relative to the 6 MV flattening filter free LINAC. 16 The 6MV LINAC delivers a dose rate of 1000 cGy/min modulated by a jaw, configurable to 1 or 2 cm openings in the superior/inferior direction, with a binary MLC composed of 64 tungsten leaves allowing for a maximum treatment area of 1 cm x 40 cm or 2 cm by 40 cm; BgRT treatment delivery is limited to a 2 cm jaw openings only. All subsystems are mounted to a gantry rotating at a fixed 60 rotations per minute.
Experimental Phantom, and ArcCHECK Assembly
The experimental studies performed in this work used the commercial Sun Nuclear ArcCHECK quality assurance helical diode detector array17,18 to measure absolute dose. The dose calibration for the device was performed by calibrating the diode reading against ion chamber (Exradin A14SL 19 ) measurements in solid water with equivalent build-up. 20 Within the ArcCHECK a custom FDG fillable phantom designed by RefleXion Medical was inserted. The phantom, as shown in Figure 2, is a sealed acrylic cylinder. The phantom is designed to allow reconfiguration as desired by mounting individual targets and organs-at-risk (OARs) to the lid. The configuration selected for the presented studies used a 22 mm spherical target composed of two individual hemispheres and a c-shape structure simulating the cardiac left ventricle. The individual targets were created using 3D printing techniques from stereolithography. The spherical target, c-shape, and housing cylinder less inserts have approximate volumes of 5 ml, 30 ml, and 2706 ml, respectively. The geometry of the ball and c-shape are shown in Figure 2.

(A) The fully assembled phantom. (B) The lid and selected configuration for experimental work. (C) The phantom placed within the ArcCHECK QA device. (D) Relative separation and sizes of the ball target and cylindrical OAR contour encompassing the c-shape. The c-shape is 30 mm thick.
Biology-Guided Radiotherapy Plan Creation
A planning CT was acquired using the Siemens Emotion 16 scanner with the Syngo CT 2012E software suite. MIRADA RTS software was used to generate the contour structure sets. The 22 mm sphere in the phantom was contoured as the gross tumor volume (GTV), and a 5 mm margin was added to generate planning target volume (PTV), and an additional 5 mm margin was given to PTV to create biology-tracking zone (BTZ); the BTZ is a BgRT specific conceptual volume that delineates a region where the system only responds to PET signals emanating from within the BTZ volume. The c-shape was contoured as a cylinder to be used as a partially FDG-avid OAR. The planning CT with overlaid contours is presented in Figure 3.
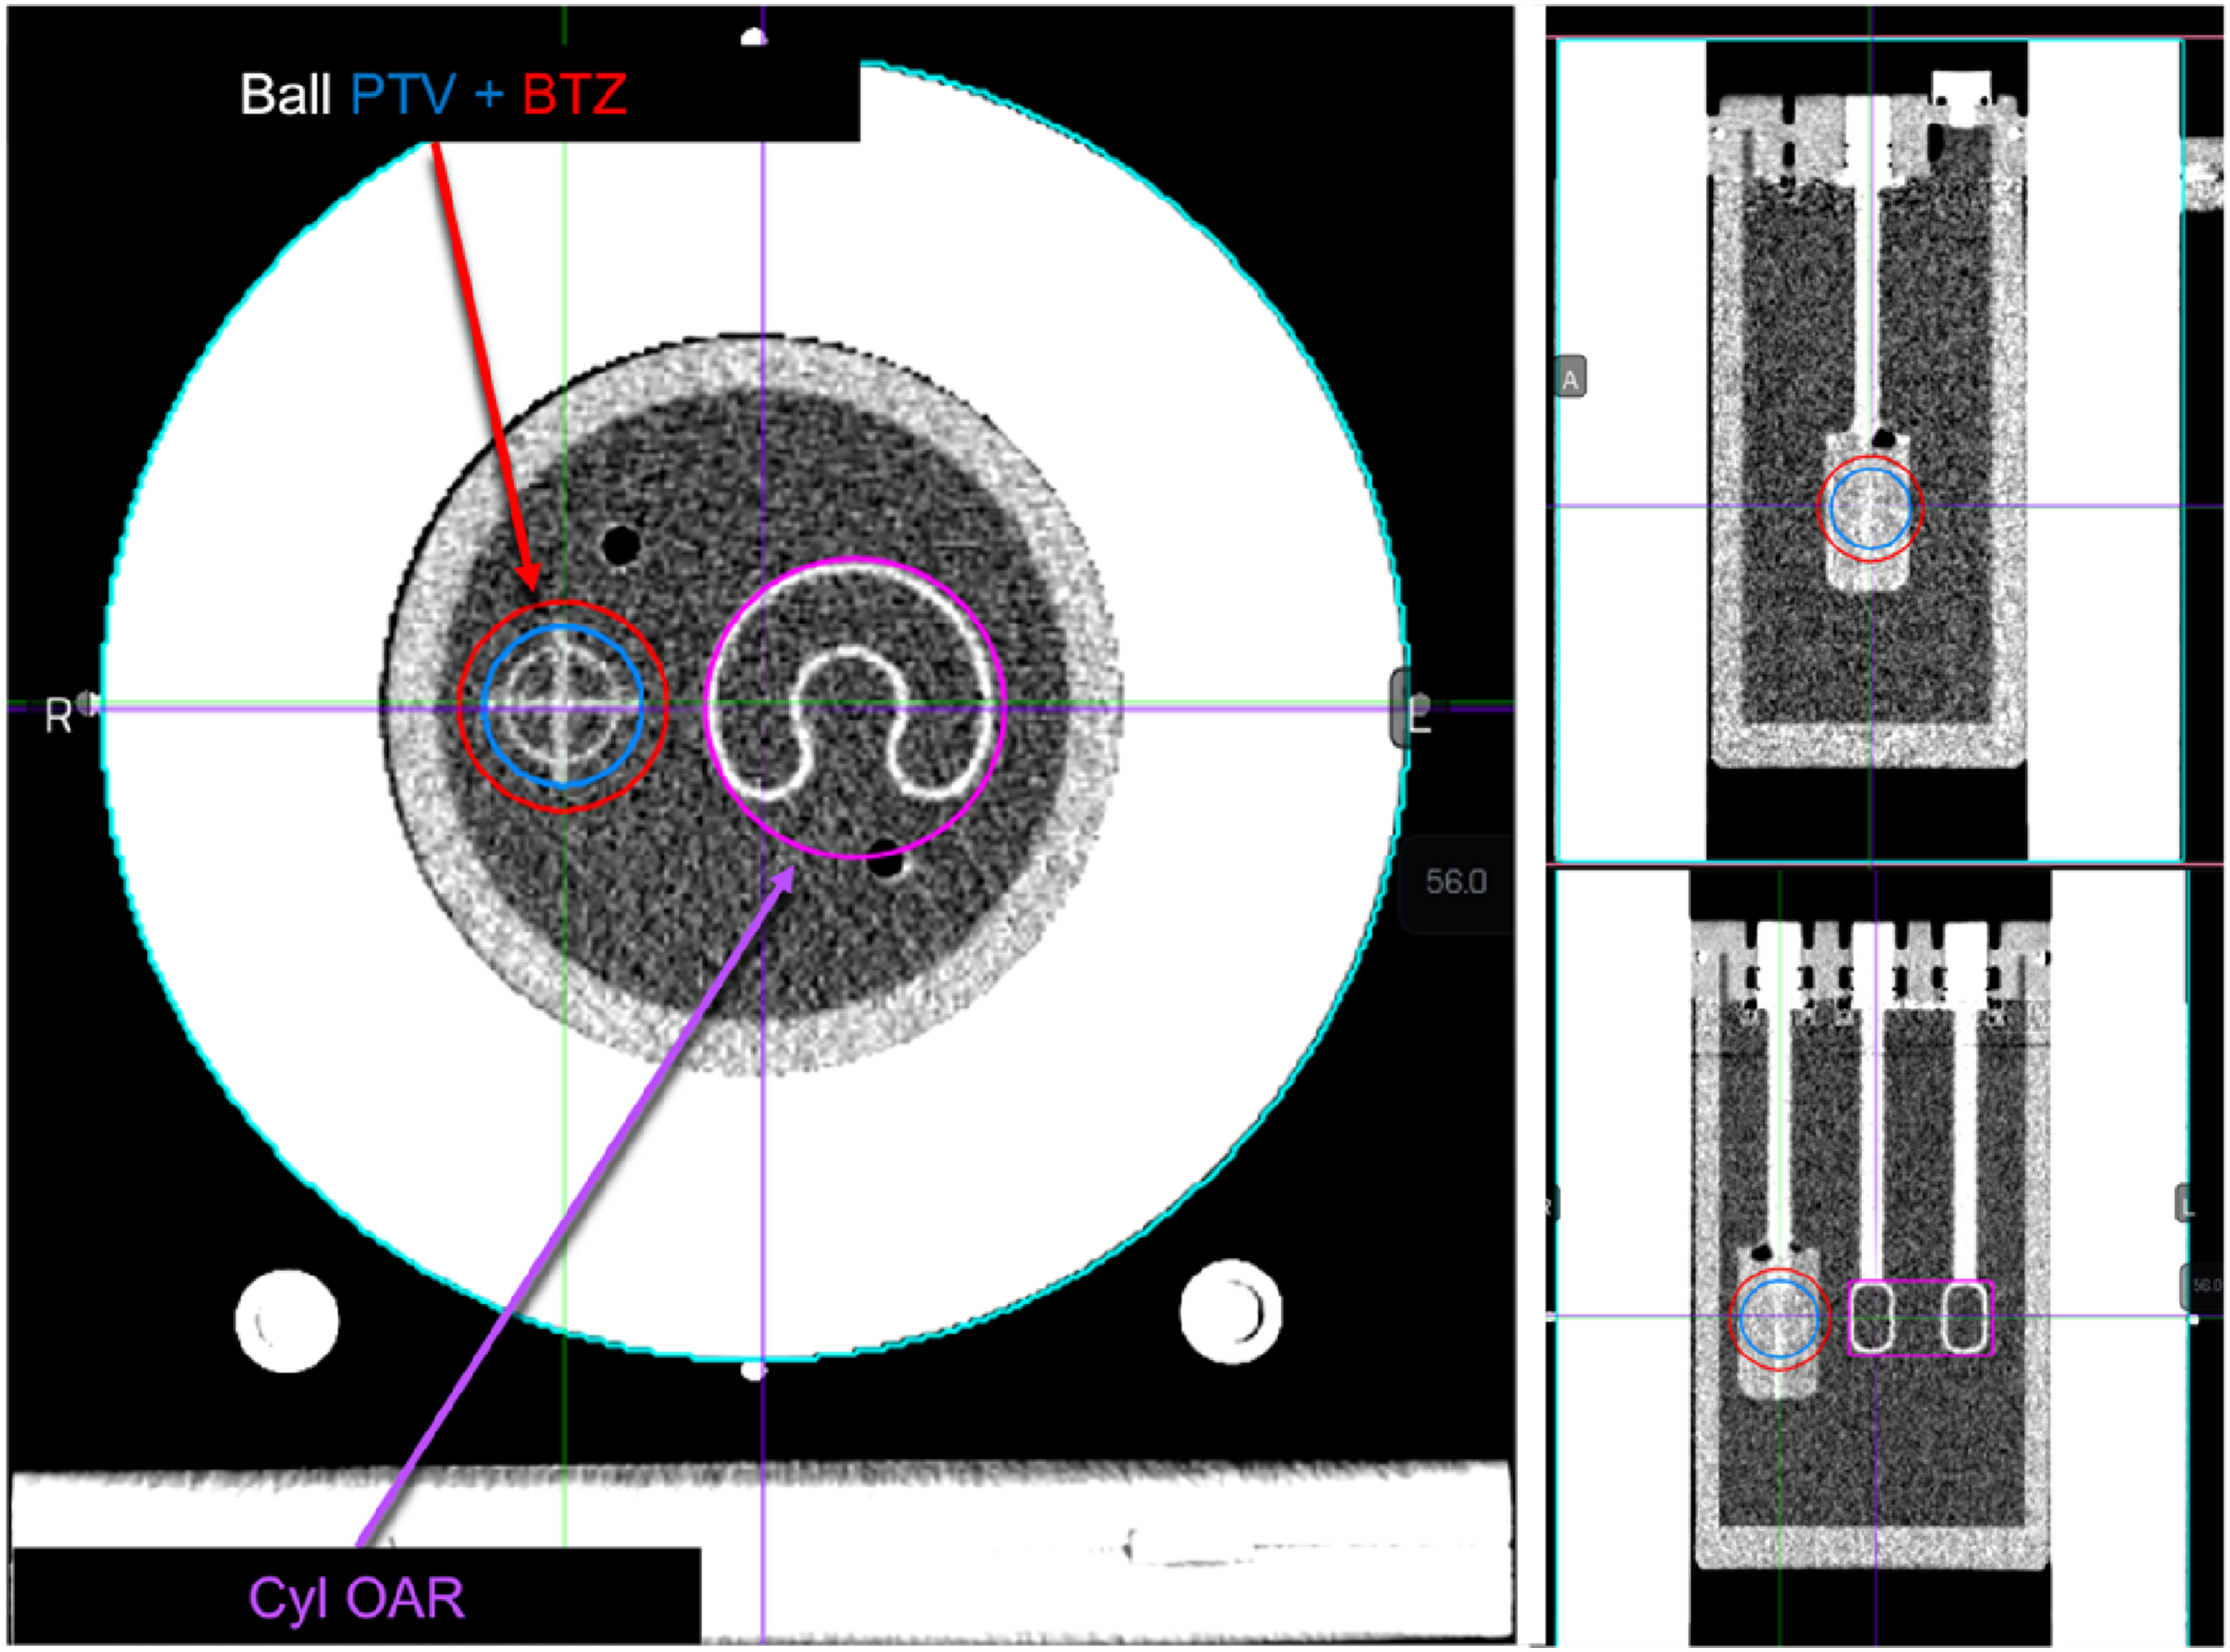
Planning CT of the ArcCHECK detector loaded with a custom spherical target c-shape phantom. Key planning contours generated with MIRADA are labeled. The plan isocenter was selected to align with the ArcCHECK center which was -2.6 mm, -266 mm, and 96 mm. This plan isocenter directly bisected the ball target and c-shape.
The planning CT and contours were imported into the RefleXion treatment planning system (TPS). 21 A plan template was created with a prescription dose of 5,000 cGy over 5 fractions. Shells were added in the TPS at distances of 5 mm, and 10 mm from the PTV for dose shaping. For the experiments discussed in this work, the BTZ tracking mode was set to non-periodic since the target remained stationary. Non-periodic operation forces each LTS image from Equation 2 to be 4 seconds long while updating every 100 ms.
The BgRT plan was approved for functional modeling (planning PET acquisition) using a kVCT localization protocol that used a tube voltage of 120 kV, a current of 150 mA, and an axial scan length of 200 mm. The PET functional modeling protocol for the plan specified 4 couch passes (superior-inferior-superior-inferior) of the couch through the PET isocenter, covering a scan length of 58.8 mm per pass in increments of 2.1 mm, totaling 28 individual couch positions referred to as beam stations. Two unique planning PET images of different TBRs were acquired as shown in Figure 4; the fill details of the phantoms for each TBR condition are presented in Table 1. The target and background activities are calibrated relative to the start time of the PET acquisition. For simplicity, the paper references the ideal TBR when communicating study conditions rather than the actual TBR.

(A) The 8:1 TBR planning PET image. (B) The 4:1 TBR planning PET image. (C) The per fraction dose using 8:1 TBR planning PET image. (D) The per fraction dose using 4:1 TBR planning PET image. Color-map for both planned dose images extends to 120% (1200 cGy) of the per fraction prescription.
True phantom characteristics for functional modeling PET studies.

Two separate BgRT plans were created: Plan 1 utilized the 8:1 image data for the planning PET, while Plan 2 employed the 4:1 data. Both plans used the same prescription dose, plan contours, and dosimetry objectives as shown in Table 2. These plan details were user defined initially with only the planning CT. The act of plan optimization and dose computation after the acquisition and inclusion of the planning PET dataset generated the fixed firing filter which was applied during treatment.
Dosimetry constraints for TBR studies.

Optimization of the 8:1 condition plan resulted in a maximum dose of 6043 cGy, a conformity index (CI) of 1.03, 95.39% coverage of the PTV, and a 17-minute delivery time. The 4:1 condition plan achieved a maximum dose of 6113 cGy, a CI of 1.04, 95.5% coverage, and 17-minute delivery time. The dosimetry characteristics of the resulting optimizations were considered sufficiently similar for direct comparison. Figure 4 shows the per fraction dose overlaid on the planning CT for the 8:1 and 4:1 plans. Each plan was approved for treatment delivery.
Biology-Guided Radiotherapy Experimental Phantom Studies
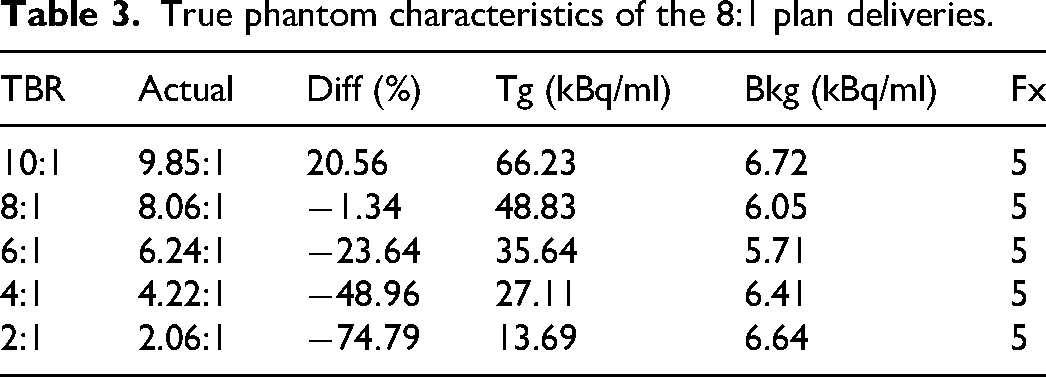
A total of 30 fractions were delivered for analysis. Of the 30 fractions, 25 fractions used the 8:1 plan. The fractions were delivered in sets of 5 and duplicate plans were generated using the plan copy functionality on the TPS to accommodate the 25 fractions delivered for the 8:1 plan. Twenty of the fractions used delivery TBRs that deviated from the planning PET TBR, and five fractions matched the planning PET TBR. The relative deviation between the delivery TBR and the planning TBR ranged from +20.56% (10:1 delivery condition) to -74.79% (2:1 delivery condition). A single phantom fill was used for each delivery TBR condition and was allowed to decay during the 5 successive fractions to test the accuracy of BgRT delivery as the signal decays while keeping the same TBR for each condition. To allow for comparison, each phantom was filled with near identical background activity concentrations. Table 3 summarizes the analytically calculated TBR, percent deviation from planning TBR, the initial target activity concentration, the initial background activity concentration, and the number of fractions delivered per condition.
True phantom characteristics of the 8:1 plan deliveries.
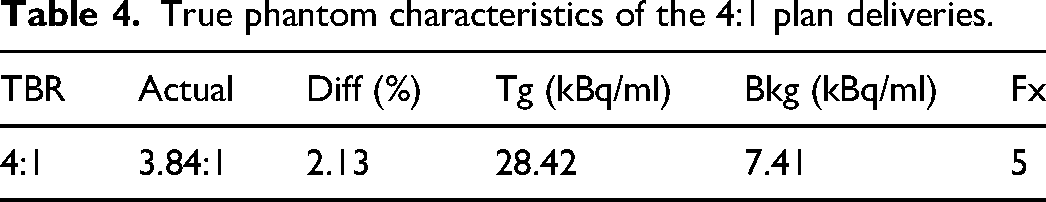
The remaining 5 fractions were assigned to the 4:1 plan with a matched 4:1 TBR at delivery. Table 4 summarizes the fill details of the phantom used for this part of the study. The analytical delivery TBR was within 5% of the actual planning PET TBR. These 5 fractions were used to determine if the agreement of the PET characteristics between plan and delivery were of greater importance to delivery accuracy than the magnitude of the phantom’s TBR and activity alone.
True phantom characteristics of the 4:1 plan deliveries.
PET Image Reconstruction Methods
The X1 system collects PET data in list-mode format, which is then binned into 2D sinograms using single-slice rebinning (SSRB). The sinogram binning uses 2.034 mm radial bins for all firing angles. Each 2D sinogram is then reconstructed using FBP with RAM-LAK filter and Gaussian smoothing kernel. PET data corrections for randoms, detector normalization, CT-based attenuation correction, and radiotracer decay are applied. Separate reconstruction threads are used for BgRT delivery and image display, differing in the temporal frame duration. For BgRT delivery, the frame duration is defined by the tracking mode – periodic (0.5s frame duration) or non-periodic (4s frame duration) – and the PET data incorporated into each frame is determined by a rotating buffer. For image display, each beam station PET image – the duration of which is determined by the specific plan used – is reconstructed individually and then stitched together to form the final, cumulative image. The axial scan length is calculated using the maximum length of the BTZ along IEC-Y, with an added buffer so that the PET system can fully sample the region.
PET Data Thresholds and Analysis Metrics
The following metrics were recorded, characterizing the relationship between PET and BgRT delivery accuracy. AC and NTS PET imaging metrics of the tumor are explicitly used to determine whether planning and treatment delivery are viable with the expected dosimetric accuracy.
Target Activity Concentration Metric:
22
AC is the local contrast between the target signal and the local background and measures how much signal is available to guide the treatment. The target signal is defined as the mean value of all voxels falling above 80% of the maximum PET voxel within the BTZ. A 3 mm shell is automatically created around the BTZ and defines the “background” region. The background signal is defined as the mean value of all the voxels within this background shell. A minimum AC of 5 kBq/ml is required for planning and delivery. The value is reported after plan optimization in the TPS, and after completion of the pre-treatment PET scan evaluation in the treatment delivery console (TDS). Normalized Target Signal Metric:
22
The NTS measures the target contrast relative to the background noise. It is analogous to a contrast-to-noise ratio and is defined as the AC metric divided by the standard deviation of the voxels within the background shell. An NTS value of 2.7 is required for planning, and a value of 2 is required to proceed to delivery. This value is calculated in parallel with the AC. Target to Background Ratio, Effective TBR, and TBR Recovery: The TBR is simply the ratio of the target signal relative to the background. TBR values calculated from PET images are referred to as the effective TBR. The discrepancy between the true and measured TBR was calculated using Equation 5, where only signal above the background was considered in the calculation. PET Operating Range Limits: A set of calculations performed prior to assessing the AC and NTS of a pre-treatment PET scan. This is done to ensure that the measured data sufficiently estimates the true Poisson mean of the PET bio-distribution so that AC and NTS are calculated accurately. Due to the minimum required statistical certainty, the operating range can exclude certain delivery conditions such as the 4:1 and 2:1 deliveries carried out in this work.
Note that the operating range was disabled, and the AC and NTS thresholds were temporarily lowered on the system to allow all BgRT treatments to proceed to completion.
Quantitative metrics computed in this experimental study utilized a combination of proprietary software from RefleXion and Sun Nuclear, as well as custom MATLAB scripts. The reported AC and NTS values were extracted from treatment records archived on the RefleXion treatment planning system after each fraction was delivered. Effective image TBR values were calculated from PET treatment images using the custom MATLAB scripts. Radiotherapy delivery accuracy was determined using an absolute 3%/2mm gamma criteria 23 to compare the delivered dose to the planned dose. The gamma passing rate was calculated using Sun Nuclear’s SNC Patient software version 8.
Statistical Analysis
Each plan and subsequent delivery series was carried out in groups of five matching the hypo-fractionated treatment scheme recommended for PET-based BgRT. A mean and sample standard deviation for AC, NTS, and TBR were calculated for each series. AC and NTS statistics were calculated from the values provided by the TDS. TBR values were calculated in MATLAB using a target 2D region-of-interest centrally located on the 22 mm sphere for each treatment PET image, and a background region-of-interest off target.
Results
Pre-Treatment PET Scan Quantification of the 8:1 Plan: Normalized Target Signal and Activity Concentration
AC and NTS were recorded after each pre-treatment PET scan. The analysis was performed for the 25 different TBR deviation conditions relative to the 8:1 plan. Figure 5 summarizes each measurement made for AC and NTS, separately, as a function of the background activity in kBq/ml per image per fraction. The first pre-treatment PET image for each series (covering 10:1 to 2:1) is shown in Figure 6. All experimental data fell within a background radioactivity range of 6.1 to 1.9 kBq/ml for all data sets within this cohort. AC values for 10:1 and 8:1 deliveries ranged from 17.8 kBq/ml to 6.38 kBq/ml, and 17.21 kBq/ml to 5.7 kBq/ml, respectively (all measured AC values for these deliveries maintained an AC value greater than the minimum threshold of 5 kBq/ml that is necessary to proceed to BgRT Delivery). For 6:1 deliveries, AC values ranged from 9.26 kBq/ml to as low as 4.23 kBq/ml. The fourth fraction, at 4.23 kBq/ml, did not meet the minimum AC required, indicating 4 of 5 fractions would be deliverable under nominal system performance conditions. For the 4:1 delivery, AC values ranged from 7.28 kBq/ml to 2.93 kBq/ml. The last three fractions with AC values of 3.08 kBq/ml, 3.4 kBq/ml, and 2.93 kBq/ml all fell below the 5 kBq/ml AC threshold limit. The final TBR delivery condition at 2:1 resulted in all five fractions being below the AC threshold, with a range of 3.82 kBq/ml to 1.89 kBq/ml. This indicates that, under normal clinical workflow, the system would have prevented BgRT treatment.

Pre-Treatment PET Activity Concentration (AC) values (Top) and Normalized Target Signal (NTS) values (Bottom) plotted against the measured background activity measured during the back-to-back BgRT deliveries as the FDG decays.
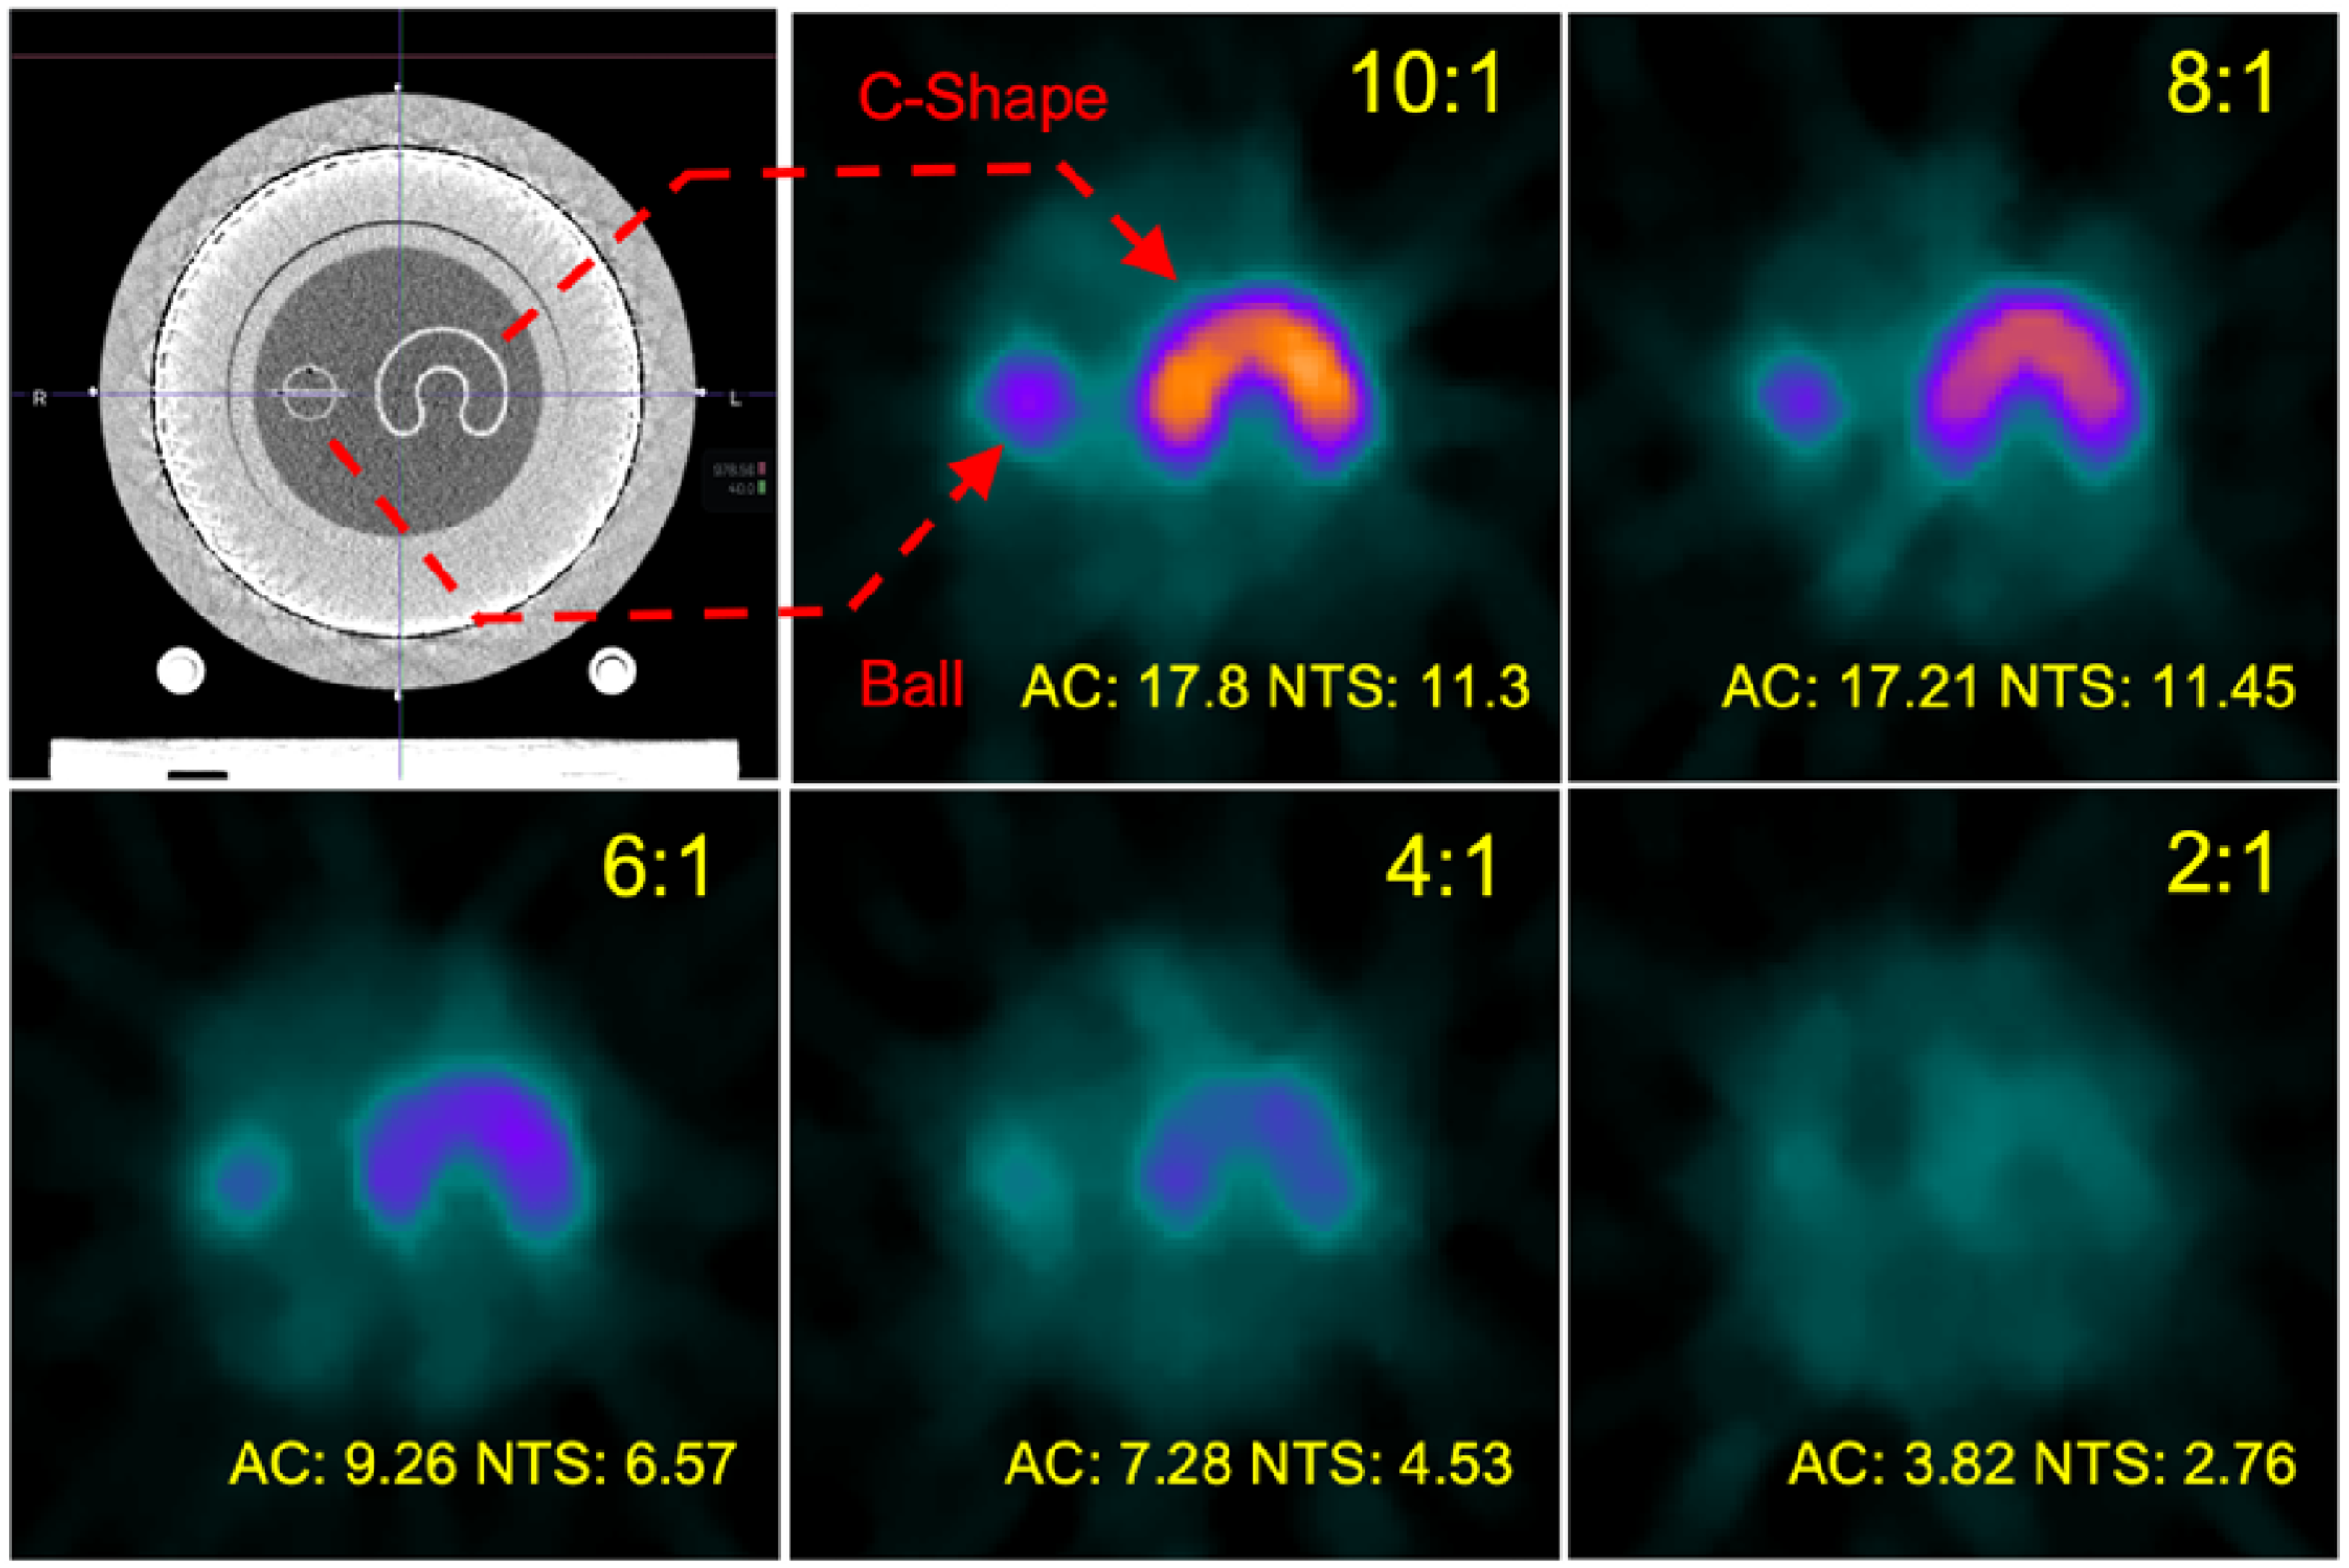
Pre-treatment PET images from the first fraction of each series for 8:1 plan. TBR is decreasing moving from left to right. AC and NTS are reported for each scan. All images exist on the same color scale range.
All pre-treatment evaluations met the minimum NTS requirements for proceeding to treatment. The 10:1 and 8:1 deliveries demonstrated NTS ranges of 11.3 to 7.37, and 11.45 to 6.65, respectively. TBR conditions for 6:1, 4:1, and 2:1 showed little dependence on activity levels of the phantom. The 6:1 NTS values ranged from 6.57 to 4.92, the 4:1 NTS values ranged from 4.53 to 3.22, and the 2:1 NTS values ranged from 2.76 to 2.15.
Treatment PET Image Characterization of 8:1 Plan
In the clinical version of the RefleXion X1, for the fractions that meet the operating range requirements but have an AC<5 or NTS<2 during the pre-treatment PET evaluations, the system will not allow the treatment to start. To test the accuracy of delivery in all conditions, the pre-treatment PET thresholds were lowered in the non-clinical version of the X1 to allow all 25 fractions to proceed to delivery. Every PET image generated at the end of the delivery was analyzed for an effective TBR value as well as a percentage recovery of the true TBR. A summary of the effective TBR per fractions is summarized in Table 5. The 10:1, 8:1, 6:1, 4:1, and 2:1 conditions had true TBR values of 9.85:1, 8.06:1, 6.24:1, 4.22:1, and 2.06:1. The mean effective TBR for each condition for all delivered fractions was 3.70, 3.32, 2.73, 1.80, and 1.39. The recovered TBR percentage of the true TBR for the 22 mm target was therefore 30.5%, 32.9%, 33.0%, 24.8%, and 36.8%. The mean percentage of the recovered TBR was 31.6% for the 22 mm target. All treatment PET images are visualized in Figure 7.
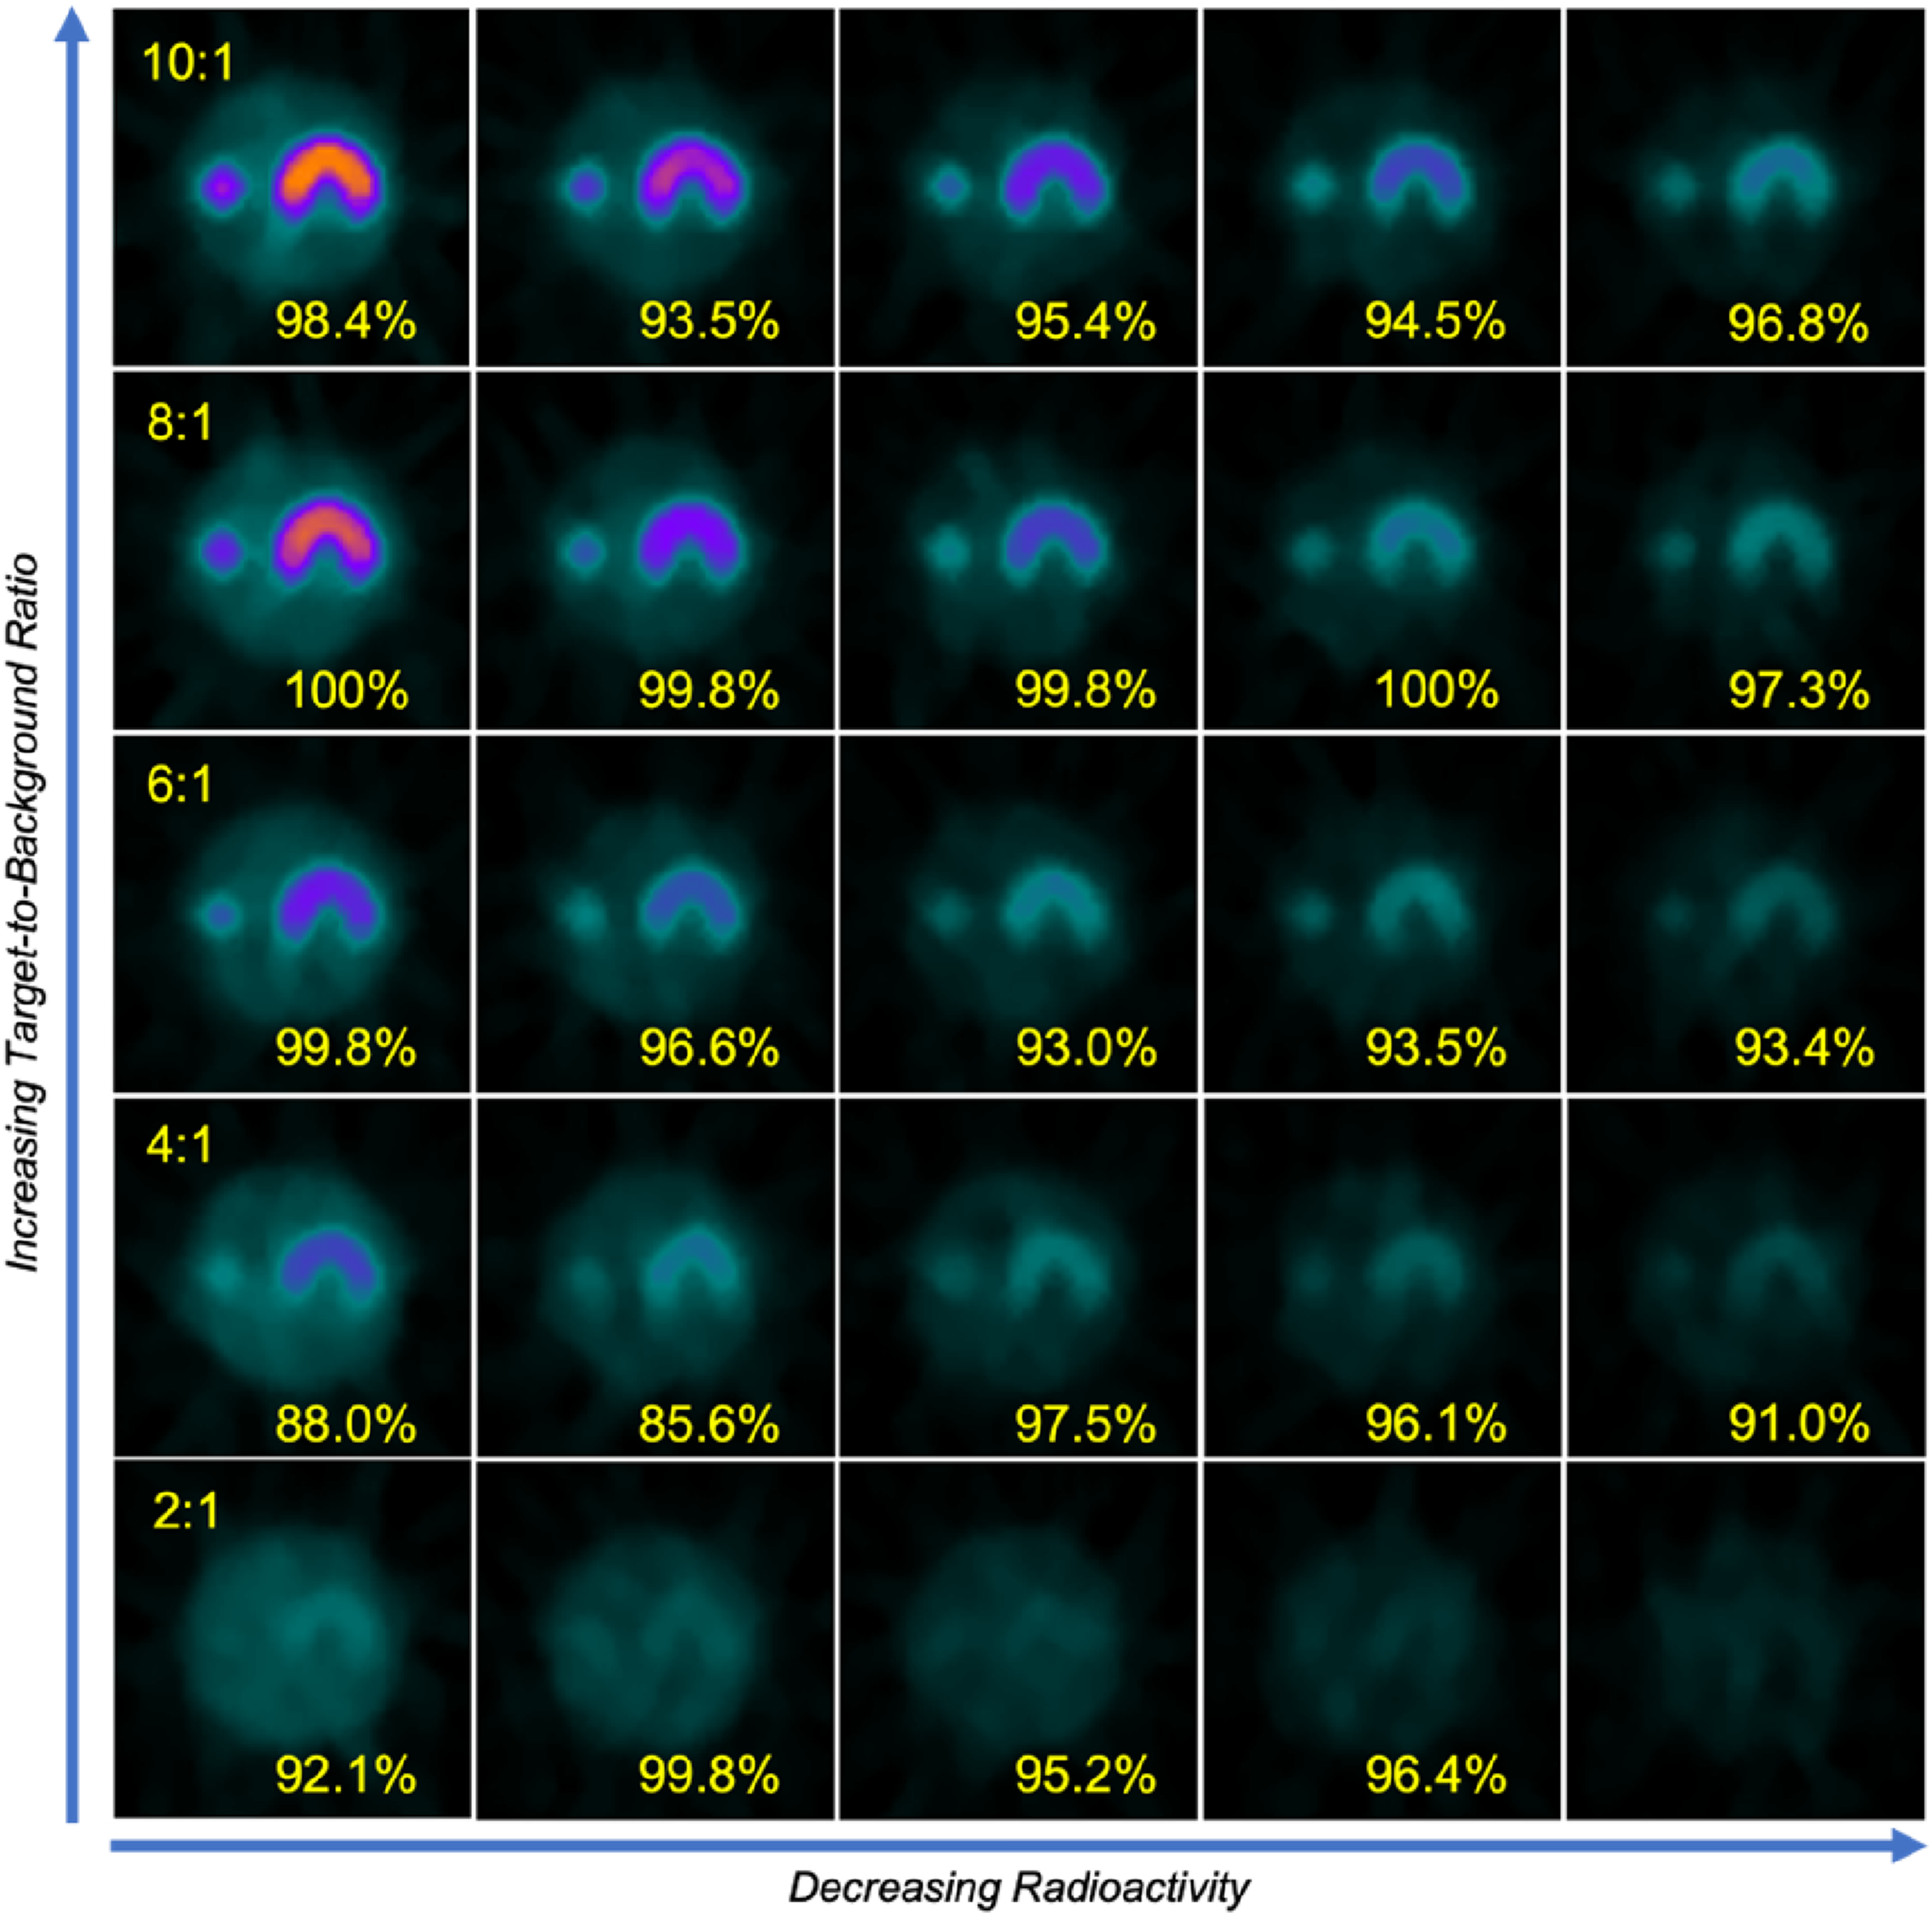
Mosaic of all treatment PET images obtained using the 8:1 plan. Gamma index results are arranged from left to right in decreasing radioactivity, and from top to bottom in decreasing TBR. All images exist on the same color scale range.
Effective TBR per fraction, mean, and standard deviation.

Delivery Accuracy by Absolute Gamma for the 8:1 Plan
Absolute 3%/2mm gamma pass rates were was measured for each completed delivery. Table 6 summarizes the measured gamma passing rates for all 25 fractions. The mean gamma values for deliveries from 10:1 to 2:1 TBR conditions were 95.7%, 99.4%, 95.3%, 91.2%, and 95.9%, respectively. The standard deviations for the TBR delivery conditions were 1.9%, 1.2%, 2.9%, 5.1% and 3.2%. The 8:1 planning TBR image and 8:1 delivery TBR image exhibited the highest agreement between the plan and delivered dose at 99.4%. All fractions for 10:1, 8:1 and 6:1 delivery TBRs achieved 3%/2mm gamma pass rates greater than 90%. The 4:1 TBR condition saw failure of the first two fractions with gamma index values of 88.0% and 85.6%. The 2:1 TBR condition achieved a mean gamma index of 95.9% but only completed 4 of the 5 intended fractions, with the last fraction interrupted during delivery due to insufficient PET signal.
Measured absolute 3%/2mm gamma (%) for 8:1 plan.

Out of 24 completed delivery fractions using the 8:1 plan, 100% (24 of 24) of the pre-treatment PET scans would pass the NTS limit(
Comparative Pre-Treatment PET Quantification and Treatment PET Delivery Accuracy for 4:1 Plan
Five fractions using the 4:1 plan were delivered with a matched TBR of 4:1 at delivery. Figure 8 summarizes the pre-treatment PET AC and NTS values as a function of background activity as the phantom decayed, and Figure 9 presents the pre-treatment and treatment PET images for each fraction. AC and NTS values for the 8:1 plan with a 50% reduction in TBR of 4:1 at delivery are also overlaid to show agreement with the AC and NTS values for the matched 4:1 plan with 4:1 delivery. AC values ranged from 7.28 kBq/ml to 2.93 kBq/m for the 8:1 plan and 10.1 kBq/ml to 2.80 kBq/ml for the 4:1 plan. NTS values ranged from 4.53 to 3.22 for the 8:1 plan and 7.28 to 3.73 for the 4:1 plan. Results indicate that when delivering with a TBR of 4:1, we observe similar AC and NTS values regardless of whether the planning PET had matched (4:1) or mismatched (8:1) TBRs. Likewise, the measured TBR using treatment PET images for matched 4:1 plan and deliveries shown in Table 7 (2.12

Pre-Treatment PET Activity Concentration (AC) values (Top) and Normalized Target Signal (NTS) values (Bottom) plotted against the measured background activity. These plots have the results for both plans delivered at the 4:1 TBR.

(Top Row) Pre-treatment PET images with AC and NTS values recorded for all 5 fractions of the 4:1 plan deliveries. (Bottom Row) The treatment PET images and measured gamma index values are shown. All images exist on the same color scale range.
Effective TBR per fraction of 4:1 plan.

The gamma index values of the final 5 fractions with matched TBR of 4:1 at planning and delivery are summarized in Table 8. The mean gamma index value of the deliveries was 89.1% with a standard deviation of 6.8%. This result is consistent with the mean gamma passing rate of 91.2% with a standard deviation of 5.1% observed with the 8:1 plan with a mismatched TBR of 4:1 at delivery. The similarity of these results, with both exhibiting a low mean gamma passing rate and more variation, suggests that delivery accuracy may become more sensitive to the TBR at delivery rather than to differences between planning and delivery for deliveries at lower TBRs.
Comparison of absolute 3%/2mm gamma (%) of 8:1 plan versus 4:1 plan at 4:1 deliveries.

Figure 10 is the first ArcCHECK result recorded from the 4:1 plan delivery series. In this delivery, a total of 437 data points were recorded with 393 points meeting the delivery criteria. Of the 44 points that failed, all were measured to be underdosing relative to the plan; the majority of the failing data points clustered in the higher dose region corresponding to the PET-avid region. The location and dosing behavior was similarly observed in the 4 following fractions.
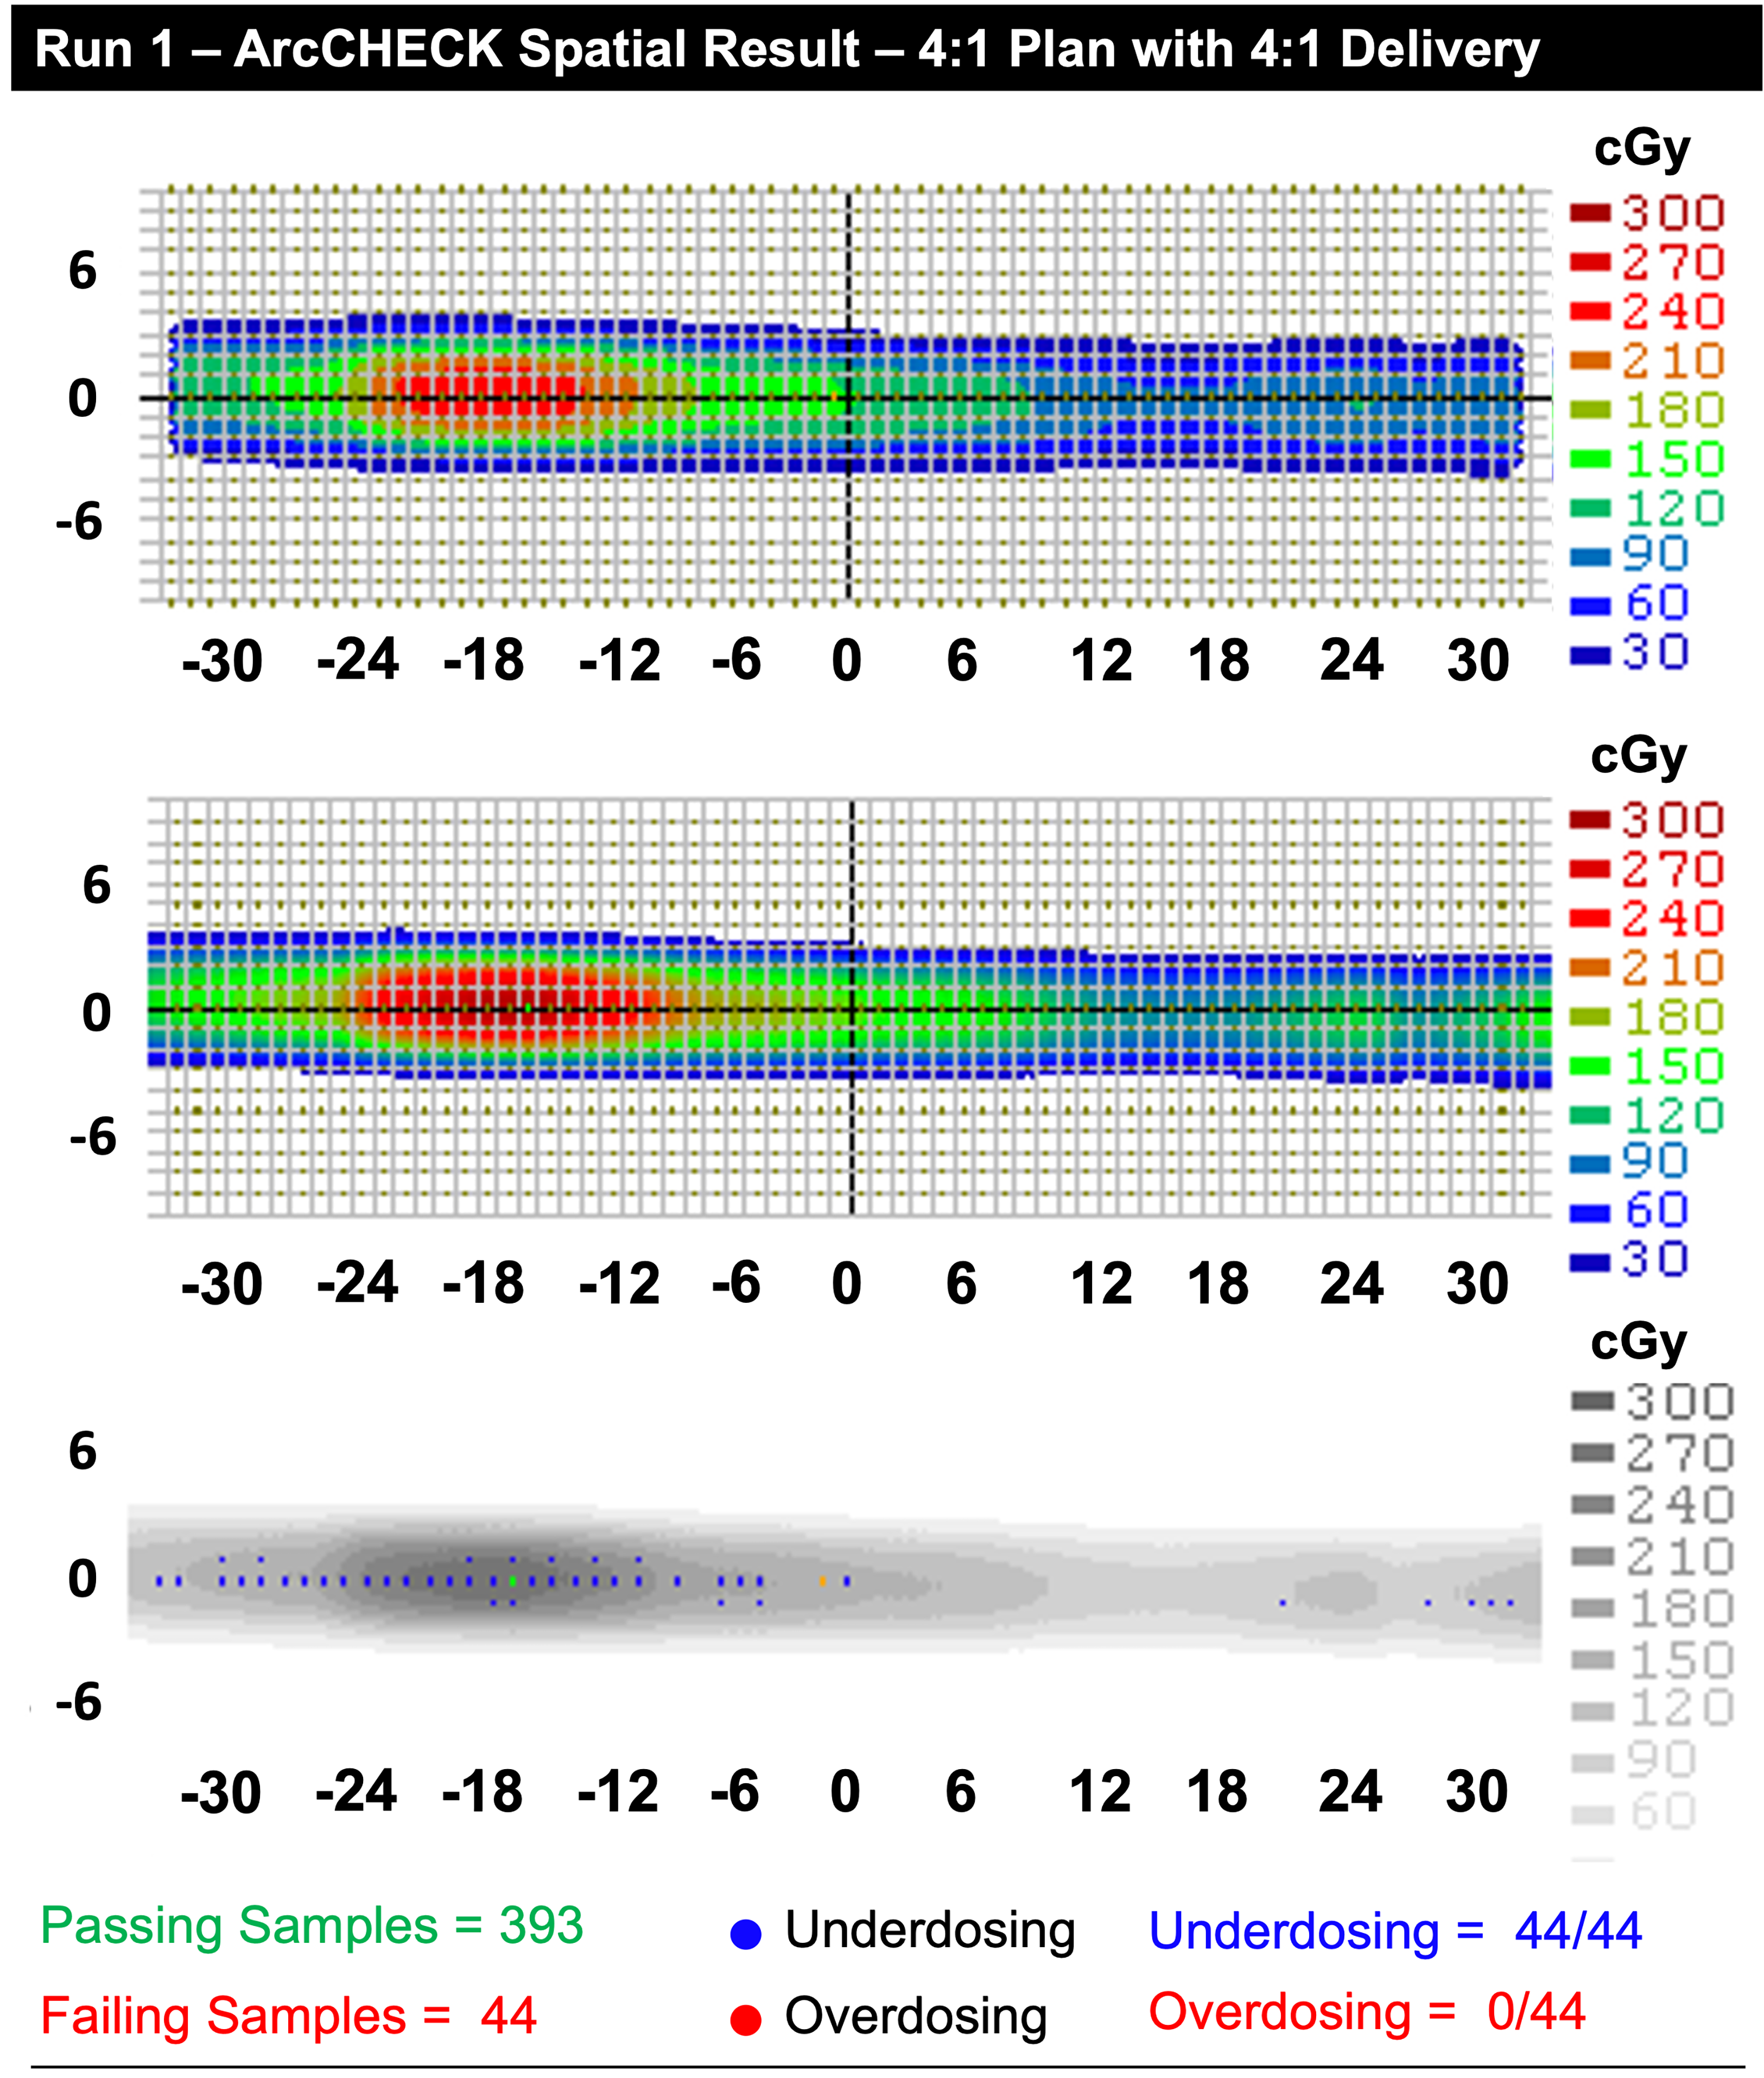
(Top) The measured ArcCHECK dose for fraction one of the 4:1 delivery. (Middle) The 4:1 TBR planned dose. (Bottom) The absolute gamma index map for the delivery. All points which failed demonstrated underdosing as the mechanism of failure. This remained the primary mechanism of failure for all factions delivered for this plan.
Discussion
PET-based BgRT treatment deliveries to phantoms demonstrated favorable results for static targets, with most 3%/2mm gamma indices exceeding the clinical requirement of 90% for 3%/2mm for the variants considered in this work. For the cohort of studies based on the 8:1 plan, BgRT treatment deliveries demonstrated consistent dosimetric agreement with the plan when the PET image characteristics of TBR are matched between the plan and delivery. Next, dosimetry accuracy is maintained for the 8:1 plan cohort, even though the treatment TBR on the day of delivery was varied or changed from 10:1 down to 6:1 with 3%/2mm gamma passing rates exceeding 90%. When the TBR at delivery was lowered to 4:1 (for the 8:1 plan), the delivery accuracy began to demonstrate instability, with some fractions falling below the clinically acceptable gamma index value. This instability was further observed in the 2:1 delivery with the failure to deliver the final fraction. The low activity and TBR resulted in an interlock stopping treatment; the treatment PET data was assessed to be too different from the pre-treatment PET image. Quantitatively, with the exception of the 2:1 condition, deviating from the planning TBR showed a reduction in the mean gamma index value and an increase in the delivery variance. It should be clearly understood, however, that these failure conditions are not currently clinically allowed due to the operating range, AC, and NTS thresholds imposed in the pre-treatment scan. As stated in the results, the deliveries that met the criteria for clinical delivery all exceeded the 90% 3%/2mm requirement to be considered safe. While matching the planning PET image to the treatment PET did provide the most quantitatively accurate results for the 8:1 condition, the result was not universal. When attempting to deliver BgRT treatments using a lower TBR of 4:1 on the day of treatment, with either a matched planning TBR of 4:1 or a mismatched TBR of 8:1, similar mean gamma index values across 5 fractions with equally similar standard deviations were observed. This indicates that, regardless of the conditions observed at the time of planning, if the TBR is lowered to 4:1 at the time of delivery, there is an inadequate amount of signal to maintain delivery accuracy, as indicated by the lower TBR and AC values. It is more difficult to infer the impact of NTS on the delivery as the metric had significantly less dynamic range for most TBR conditions. More importantly, the clinical system would have rejected 4:1 studies based solely on an insufficient signal prior to calculating AC and NTS, thereby inhibiting the delivery from moving forward.
For the lowest delivery TBR of 2:1 that was tested in this cohort, we measured slightly higher gamma passing rates (95.9
It is important to note that the delivery behaviors observed in this work do not likely represent the peak performance for BgRT as a treatment methodology but of the current hardware. As the technology makes decisions using quickly acquired PET images for real-time delivery, the prioritization of speed using FBP and the number of detectable coincidence events per LTS image likely impose the performance thresholds observed here. The current BgRT FBP algorithm (1) does not implement scatter correction and (2) uses a larger reconstructed voxel size under utilizing the peak PET spatial resolution performance. 16 A reliable method for real-time scatter correction would need to be developed, and the system would benefit from having a higher geometric sensitivity to reduce image noise dominating at smaller reconstructed voxel sizes while improving TBR through the alleviation of the partial volume effect. 24 The current approach significantly reduces the TBR recovery capabilities of the system, as shown with the mean TBR recovery of 31.6%. However, since there is no NEMA standard or Task Group for BgRT, the sensitivity of BgRT treatment accuracy as a function of PET image quality remains open to further study and refinement.
To improve understanding of the clinical potential of BgRT, future studies can build upon the current work to evaluate the upper and lower limits of performance as a function of (1) target size, (2) background heterogeneity, and (3) target motion. This study is limited to 22 mm diameter targets, larger targets will likely observe improved agreement between the true TBR and the effective TBR as well as overall improvements in AC and NTS quantitation due to the reduced impact of the limited reconstructed voxel size. Inversely, smaller targets, will likely be very challenging. The exact relationship between small diameter targets, the system PET pixel size, PET system sensitivity, and treatment gamma have not been thoroughly investigated. Furthermore, additional work must be performed looking at the complexity of the background that the target resides within; phantom studies in this work only investigated homogeneous backgrounds. Lastly, the studies here did not include motion and are more representative of bone-like clinical conditions. Motion studies must be investigated with an expanded number of parameters including (a) motion amplitude, (b) motion period, (c) motion agreement between plan and delivery, and (d) average target velocity.
Conclusion
BgRT on the X1 can accurately and safely deliver to a minimum TBR of 6:1, representing the lower limit of the clinical treatment range. The best treatment outcomes occur when PET planning characteristics match the treatment PET characteristics. As this is typically not the case clinically, the system does maintain a robust delivery when TBR, AC, and NTS deviate from the plan. However, with the current X1 algorithms and hardware, performance degrades with 4:1 TBR, indicating that targets or lesions with TBRs equal to or less than 4:1 are not suitable candidates for PET-based BgRT.
Footnotes
List of Abbreviations
Acknowledgements
The authors would like to thank the Reflexion Medical’s software support and product development engineering teams for ensuring continuous operation of the X1 system.
Funding
The author(s) received no financial support for the research, authorship, and/or publication of this article.
Declaration of Conflicting Interests
The author(s) declared the following potential conflicts of interest with respect to the research, authorship, and/or publication of this article: Dr. Andrew Groll, Dr. Sanchit Sharma, Dr. Timothy Pok Chi Yeung, Dr. Jeffrey Schmall, Dr. Angela J. Da Silva, and Dr. Manoj Narayanan are employees in the research and development (R&D) division of RefleXion Medical, Inc. Dr. Murat Surucu’s employer, Stanford University, receives research grants from RefleXion Medical, Inc.