
Abstract
Introduction
Previously, a multimodal imaging system including x-ray computed tomography (CT) and bioluminescence tomography (BLT) has been developed on iSMAART and is capable of accurately localizing small tumors on the millimeter scale in three dimensions (3D). Here, a “2D decomposition + 3D reconstruction” strategy is proposed to recover multiple tumors that are closely spaced and may have drastically different bioluminescence intensities.
Methods
In the iSMAART system, CT provides the animal anatomy and surface contours required for BLT reconstruction. The BLT and CT are physically registered, rendering superimposed images. For BLT reconstruction, the surface bioluminescence signal is first decomposed using a Gaussian mathematical model into multiple independent signal distributions, before separate reconstruction of individual targets. The final tumor distribution is the summation of the individual reconstruction results. BLT/CT imaging was performed on two types of metastatic tumor models, PC3 prostate tumors and HCT116 colorectal tumors, with 2 mice in each model. A double-blind histopathological analysis was conducted to verify the imaging results.
Results and Conclusion
By incorporating the proposed strategy, the iSMAART system accurately differentiated and localized multiple tightly clustered tumors of varying sizes and optical intensities in all mice, and four tumors in a single mouse were simultaneously diagnosed. The tumor sizes measured by BLT closely matched the histopathological results (mean value 2.76 vs 2.41 mm). In this study, we proposed a “2D decomposition + 3D reconstruction” strategy, which enables the iSMAART system to accurately localize and quantify multiple tumors in live animals despite significant signal overlap and intensity variations, providing a powerful tool to fulfill and even open up more high-demand research fields.
Introduction
Computed tomography (CT) provides excellent anatomical information, and has been widely used in preclinical small animal studies.1–6 However, due to limited soft tissue contrast, it is difficult to differentiate small tumors from surrounding soft tissues in CT images, even with the help of contrast agents. To accurately localize tumors and facilitate precise radiation guidance, tumor-specific molecular imaging is needed. As a solution, bioluminescence imaging (BLI) has been introduced in preclinical studies over the past few decades,7–11 as a sensitive and specific molecular imaging modality for tumor detection and monitoring.
Currently, most BLI systems work in two-dimensional (2D) mode, which means that we can obtain bioluminescence signals only from the animal surface without tumor depth information. In addition, BLI itself does not carry any anatomical information. To overcome these limitations and provide accurate three-dimensional (3D) tumor localization, which is particularly demanded for precision tumor irradiation, a multimodal system has been developed, namely, iSMAART, integrating CT and bioluminescence tomography (BLT) onto a single device.12–15 Taking advantage of the prior information provided by CT and our advanced reconstruction algorithms, it was demonstrated that the iSMAART system is able to localize small tumors with submillimeter accuracy 15 and provide adequate image guidance for irradiation. 13
Now, we challenge the iSMAART system with a more difficult task: in vivo multiple metastasis detection. Tumor metastasis is a major cause of cancer-related death and poses a significant challenge for cancer treatment. As the end stage of cancer, the metastasis phase is the last battlefield in cancer treatment. Scientists have made great efforts to understand the underlying mechanisms of cancer spread and develop new treatment regimens. A major challenge in metastasis research is that small metastases are difficult to detect, track and profile in vivo. Currently, the mainstream methods still require euthanizing the mice before imaging; hence, one animal can only be used at one single time point in longitudinal studies. In the previous work, the iSMAART system has made progress in accurately localizing small metastases without sacrificing the animals. 15 In subsequent studies, we noticed that adjacent tumor signals may overlap with each other on the animal surface and that interference occurs during the subsequent reconstruction process. In particular, the overlapping bioluminescence signals originating from different metastases may have large differences in intensity, sometimes even exceeding one order of magnitude, making it difficult to recover the tumors corresponding to the small surface signals in 3D.
In this study, we propose a signal decomposition-based reconstruction scheme that can decouple the surface bioluminescence signal and restore individual tumors via 3D reconstruction. The performance of the proposed reconstruction scheme and the signal decomposition algorithm were evaluated in four mice harboring multiple metastases with overlapping and diverse bioluminescence intensities.
Materials and Methods
System Configuration
The iSMAART imaging system (Fig. 1) consists of two subsystems: the CT and BLT. The CT subsystem includes a double-focus x-ray source (1 mm focal spot for CT imaging; 5.5 mm focal spot for irradiation), a 4-axis animal stage, and a flat panel detector. The BLT subsystem includes a reflecting mirror, a large aperture 25 mm f/0.95 lens (Schneider), and a charge-coupled device (CCD) camera (Andor Technology). The camera features a sensor array of 1024 × 1024 with a 13 µm pixel pitch and exhibits a high quantum efficiency of up to 95% within the spectral range for bioluminescence imaging. The two subsystems are physically registered 16 and share a common imaging coordinate. The details have been published in the previous work. 15 Here, CT provides both the animal anatomy and the surface contour required for BLT reconstruction.

Multimodal Imaging System Layout.
Animal Welfare
All animal studies were approved by the Institutional Animal Care and Use Committee (IACUC) of the University of Science and Technology of China (USTC), located in Hefei, Anhui Province. The approval number is USTCACUC23080123067, and the approval was granted on October 18, 2023. All experimental procedures were conducted in accordance with the ethical guidelines for animal research at USTC. Animals were housed in individually ventilated cages (IVCs) at approximately 23°C and 55% humidity under a 12-h light/dark cycle. Food and water were provided ad libitum. The reporting of this study conforms to ARRIVE 2.0 guidelines, 17 and the care and use of animals are in accordance with the Guide for the Care and Use of Laboratory Animals. 18
Animal Model
Two highly metastatic cancer models, PC3 prostate cancer and HCT116 colorectal cancer, and two mice per model were used to validate the multitarget imaging performance of the iSMAART system. All cancer cells (the Stem Cell Bank, Chinese Academy of Sciences) were labeled with firefly luciferase for optical tracking, and male immunodeficient BALB/c nude mice aged 6–8 weeks (Shanghai SLAC, Shanghai, China) were selected for the establishment of these cancer models. For the prostate cancer model, 5 × 10⁵ PC3 cells in 8.5 µL of phosphate-buffered saline (PBS) were injected into the dorsal prostatic lobe. For the colorectal cancer model, 5 × 10⁵ HCT116 cells in 50 µL of Matrigel (1:1 diluted with PBS) were injected into the cecum wall.
In Vivo Imaging
Approximately eight weeks after tumor cell implantation, the mice were anesthetized with isoflurane gas, received luciferin at 150 mg/kg for BLT imaging, anchored vertically onto the animal stage, and subjected to multimodal CT and BLT imaging. For CT imaging, the x-ray tube was set to 45 kV, 0.9 mA and a 1 mm focal spot, the flat panel detector was set to 0.1 s of exposure, and the rotation stage was operated at 8°/s. Following the CT scan, the CCD camera was set to 4 × 4 binning and 10 s exposure to acquire bioluminescence images at 0, 90, 180 and 270 degree for BLT reconstruction. Firefly luciferase with central wavelength at 610 nm was used for imaging, and bioluminescence signals were acquired without the use of any optical filters. More details can be found in the previous work. 15 Immediately following image reconstruction, the mice were euthanized by carbon dioxide inhalation, and the organs possibly containing target metastases were harvested and subjected to ex vivo bioluminescence imaging and blinded histological analysis.
Postmortem Imaging
To quantitatively evaluate the proposed reconstruction strategy, we performed an additional postmortem imaging study. Following anesthesia, the mouse was euthanized by carbon dioxide inhalation. Two cylindrical self-illuminated light sources (2 mm diameter, 6 mm length) were surgically implanted into the mouse abdomen with a fixed edge-to-edge separation of 2 mm using a custom holder. The same imaging protocol as in vivo studies was then applied. The light sources were clearly identifiable in CT images, which can be used to benchmark the BLT reconstruction results.
2D Signal Decomposition
Surface image signal decomposition leverages the observation that bioluminescence signals from individual tumor targets resemble 2D Gaussian distributions. Therefore, the goal is to Gaussian fit the signal distribution from each target and take the total signal as a linear combination of all individual Gaussian distributions. The decomposition process involves a series of steps: 1. Fitting the original signal using multiple Gaussians; 2. Generating masks from the Gaussian fitting result, with each mask corresponding to an individual Gaussian signal; and 3. Applying these masks to the original signal to decouple individual signals. The process can be mathematically represented as follows:


Starting from the above initial values, the final Gaussian fitting parameters were determined by minimizing the loss function using the trust region reflective algorithm.
Following the fitting process, we utilize the Gaussian-fitted image to generate masks (second row in Equation 1) and apply these masks to the original signal to obtain the decoupled signals (third row in Equation 1). Through the implementation of the aforementioned procedures, we decomposed a multitarget BLI signal into several single-target BLI signals, which were subsequently reconstructed individually. This methodology facilitates precise signal isolation, thereby enabling accurate single-target BLT reconstructions.
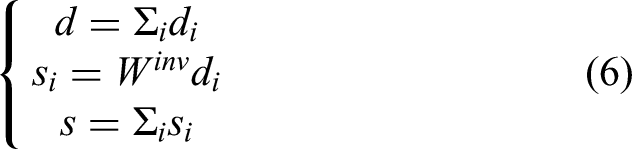
Multitarget BLT Reconstruction
We adopt the diffusion approximation with mixed-type boundary conditions
19
to describe bioluminescence light propagation in tissue and assume a homogeneous optical property distribution, which can be expressed as:


Results
Here, we choose two common but yet difficult scenarios in metastasis studies to test the imaging performance of our iSMAART system together with the proposed algorithm. The first common scenario is the simultaneous localization of multiple tumor targets with substantially different optical intensities. For illustration, we chose a PC3 prostate cancer model (PC3 m1) in which the primary implanted tumor (Fig. 2a, red arrow) and locally invaded metastases (Fig. 2a, green & blue arrows) both reside in the lower abdomen. In the conventional way, metastatic signals are barely differentiable from the primary tumor signal, and the corresponding tumors can hardly be recovered during the reconstruction process. Using the proposed signal decomposition algorithm, three signals were successfully decoupled, as shown in Fig. 2b. The color bars in Fig. 2b were chosen for the optimal ranges of each signal. It is observed that the optical intensity of signal 1 is almost twenty times greater than that of signal 3, proving that the proposed algorithm is effective in separating signals of drastically different intensities. Figure 3 shows the 3D BLT reconstruction results for the same mouse, where Fig. 3a shows the superimposed BLT/CT image slices in three orthogonal views. It is difficult, if not impossible, to differentiate the tumors on CT only (the first row in Fig. 3a). Figure 3b is the 3D rendering showing the relative positions of the tumors on the whole mouse scale. The colored arrows in Fig. 3a and 3b are corresponding to those in Fig. 2. Double-blind histopathological analysis was performed to confirm the reconstruction results, and tumors were found in the prostate (the primary implantation location), bladder and right testicle, as shown in Fig. 3c. All tumors found by multimodal imaging agreed well with the histological results. Consistent with the 2D decomposition results, the jet colors in Fig. 3a and 3b show that the source intensity of the tumor in the prostate (Signal 1 in Fig. 2b) was much greater than that of the tumor in the right testicle (Signal 3 in Fig. 2b). Interestingly, after signal decomposition, the BLT recovered and localized the tumor in the right testicle even with a one-order lower bioluminescence intensity.

2D Signal Decomposition Result of PC3 m1.

3D BLT Reconstruction Result of PC3 m1.
The second scenario represents the cases where tumor targets are clustered closely and the surface bioluminescence signals are tightly overlapped. We chose an HCT116 colorectal cancer model (HCT116 m1) for demonstration. Using our decomposition algorithm, we not only separated two low-intensity signals (Fig. 4b Signal 3 & 4; blue & yellow arrows in Fig. 4a) but also successfully decoupled two tightly overlapping signals (Fig. 4b Signal 1 & 2; red & green arrows in Fig. 4a). Rather than simply cutting the overlapping signals apart, the proposed method weights the overlapping regions so that the decoupled signals can preserve their intact distributions (Fig. 4b). The 3D reconstruction results for the mice are shown in Fig. 5, and four tumors were recovered: tumor in the colon (primary implantation), two subcutaneous metastases (abdominal ones) and one metastasis in colon. Notably, histological analysis revealed that the two abdominal metastases were very close, approximately 1 mm from each other (Abdo. Meta. 1 + 2 in Fig. 5c, arrows), which is consistent with the 3D BLT reconstruction (Coronal 2 in Fig. 5a) and the 2D signals (Fig. 4a).

2D Signal Decomposition Result of HCT116 m1.

3D BLT Reconstruction Result of HCT116 m1.
To further evaluate the in vivo performance of the proposed strategy, we compared it with the traditional algorithm 15 in the two live animal imaging examples. As shown in Supplementary Fig. 1, the proposed method demonstrated superior reconstruction capabilities. In the PC3 m1 case (Suppl. Fig. 1, panel a), the traditional method could only identify the primary implanted tumor which had the greatest signal intensity, but miss the two metastases (green & blue arrows) due to their relatively low optical intensities. The HCT116 m1 case (Suppl. Fig. 1, panel b) revealed more pronounced limitations of the traditional method: it failed to detect two low-intensity metastases (blue & yellow arrows) and could not resolve two closely spaced tumors (red & green arrows), both of which were successfully identified by the proposed reconstruction strategy.
The postmortem imaging experiment was conducted to quantitatively assess the performance of the proposed reconstruction strategy. As shown in Fig. 6, our proposed method successfully resolved optical signals from deep-seated targets separated by only 2 mm (edge to edge distance) while the traditional method failed. The light sources are radiopaque and appear bright in the CT images, allowing them to be segmented from the CT images. Their locations in CT images were served as the ground truth. The images demonstrating the ground truth are included in Fig. 6, where the image in panel c shows the locations of the two light sources and their locations (black dashed lines) are also marked in panel a and b for better comparison. Quantitative analysis shows that the depths (minimum distance from light source edge to mouse surface) of both targets were approximately 3 mm. The center-of-mass (COM) deviations were 0.39 mm for source 1 (red arrow) and 0.52 mm for source 2 (green arrow), respectively, confirming submillimeter localization accuracy. The reconstruction volumes for each source were 32.3 and 36.8 mm3, both of which were larger than the ground truth volume of 20 mm3, mainly due to the nature of light diffusion.

Postmortem imaging result.
Based on the 3D reconstruction results, it becomes possible to directly quantify the tumor sizes rather than simply measure the surface signal intensities, as is usually performed in 2D. We compared the tumor location and largest diameter (maximal distance from any two points) measured from histopathological sections and BLT reconstructions of all four mice involved in this study, and the results are presented in Table 1. The data in Table 1 indicate that the BLT results agree well with the histological results for both tumor location and tumor size (2.76 mm avg. in BLT vs 2.41 mm avg. in histology for tumor size, p = 0.074). There is a mismatch of up to 1 mm in tumor dimension for extremely small tumors (HCT116m2Testicle (R) Meta.), which was mainly due to the physical nature of the light diffusion pattern.
Comparison of Tumor Sizes in Histology and BLT.

Abbreviations: Meta. for metastasis, Abdo. for abdominal.
Discussion
Many efforts have been made to improve the reconstruction performance of optical tomography, but most of them have contributed to the matrix inversion step, ie, how to solve the inverse problem. Generally, if the surface distribution contains signals from multiple tumor targets, all tumors are treated as a whole during the reconstruction process. Therefore, if the signals from different tumor targets have considerable overlap, separating individual targets during the reconstruction process becomes difficult. In particular, if a large signal and a small signal are close to each other, the small signal is often overwhelmed by the large signal and hence cannot be recovered independently. By decomposing the multitarget signal into several single-target signals prior to the inversion step, this study aims to address the difficult multitarget reconstruction problem by solving a few simple single-target reconstruction problems that have already been well studied.
The proposed Gaussian signal decomposition method has been proven both effective and efficient and is able to successfully decouple multiple closely spaced signals in less than 3 s. The proposed strategy of “2D decomposition + 3D reconstruction” can be applied in a variety of ways. This study focused on the Gaussian decomposition method. Other signal decomposition methods, such as deep learning-based methods, can also be applied to this framework and may further improve the signal decomposition performance. In addition, other 3D BLT reconstruction algorithms can also be directly incorporated into this framework without modification.
It is demonstrated in Equation 1 that the sum of all decomposed signals exactly equals the original measured signal, thus the 2D signal decomposition process does not alter total signal intensity. In practice, it is very difficult, if not impossible, to acquire the absolute signal intensity of tumors. The relative signal intensity, however, can be preserved during the BLT reconstruction process.
Due to the diffusive nature of light, the surface signal loses detailed spatial resolution during light transport. However, the respective signal distributions of the two light sources at the animal surface can still be decoupled with our proposed strategy. In the postmortem experiment, two self-illuminated light sources with a separation of 2 mm were successfully resolved using the proposed method, but not the traditional method. In this case, the separation between the two light sources is not too small and the light travel distance to the surface is not too large, resulting in discernible local maximums in the surface signal distribution. It is estimated that tumors with a couple of millimeters can be differentiated. But in the live animal imaging the exact minimal distance of separation depends on the size, shape, and their relative signal intensity of tumors.
The Gaussian fitting procedure is a mathematical operation that can, in theory, be applied to any signal pattern. However, to ensure meaningful results, we have to impose some constraints. Theoretically, the Gaussian fitting process will stop if the surface pattern does not have mathematically discernible local maximums (signal peaks), ensuring that the output remains meaningful.
In this work, the optical parameters, ie, the absorption coefficient
Conclusion
In this work, a “2D decomposition + 3D reconstruction” strategy is proposed for successfully recovering closely spaced tumors. The surface bioluminescence distribution was first decomposed into multiple independent signals using a Gaussian model. By applying this strategy, the dual modality BLT/CT on the iSMAART system is able to retrieve individual tumors with substantial surface signal overlap and drastic signal intensity differences. With advanced multitarget imaging capability, the iSMAART system can become a more powerful tool for preclinical cancer research involving metastasis studies or requiring accurate tumor localization.
Supplemental Material
sj-docx-1-tct-10.1177_15330338251382977 - Supplemental material for Differentiation and Localization of Adjacent Murine Tumors Using X-ray and Bioluminescence Tomography
Supplemental material, sj-docx-1-tct-10.1177_15330338251382977 for Differentiation and Localization of Adjacent Murine Tumors Using X-ray and Bioluminescence Tomography by Jiahao Chen, B.S., Yunwen Huang, B.S., Ning Zhao, PhD, Yi Ru, B.S. and Yidong Yang, PhD in Technology in Cancer Research & Treatment
Footnotes
Acknowledgements
We would like to express our gratitude to Yiqun Han and Cheng Zheng for their help in conducting the imaging experiments.
Ethics Statement
All animal studies were approved by the animal care and use committee at University of Science and Technology of China (USTCACUC23080123067).
Funding
The research reported in this publication is supported by the Ministry of Science and Technology of China Key Research and Development Projects (Grant/Award Number: 2023YFC3504200), the Fundamental Research Funds for the Central Universities (Grant/Award Number: KY2030000197) and the Hefei Comprehensive National Science Center.
Hefei Comprehensive National Science Center, Fundamental Research Funds for the Central Universities, Ministry of Science and Technology of China Key Research and Development Projects, (grant number KY2030000197, 2023YFC3504200).
Declaration of Conflicting Interests
The authors declared no potential conflicts of interest with respect to the research, authorship, and/or publication of this article.
Data Sharing Statement
Research data are stored in an institutional repository and will be shared upon request to the corresponding author.
Supplemental Material
Suppl. Fig. 1. Comparison of proposed and traditional method. Panel a is the PC3 m1 case and panel b is the HCT116 m1 case.
References
Supplementary Material
Please find the following supplemental material available below.
For Open Access articles published under a Creative Commons License, all supplemental material carries the same license as the article it is associated with.
For non-Open Access articles published, all supplemental material carries a non-exclusive license, and permission requests for re-use of supplemental material or any part of supplemental material shall be sent directly to the copyright owner as specified in the copyright notice associated with the article.